Super Zone

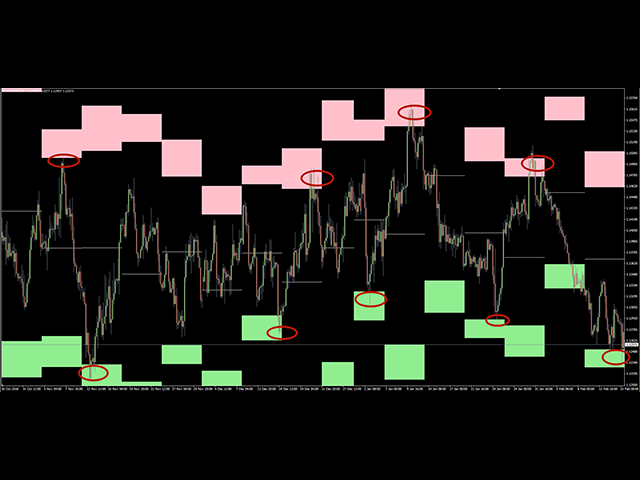
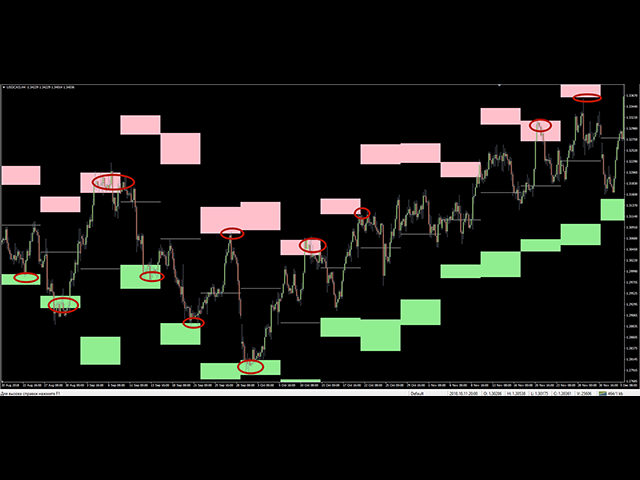
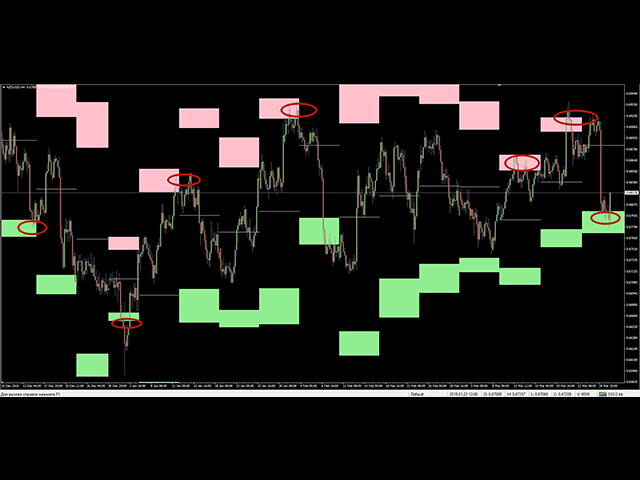
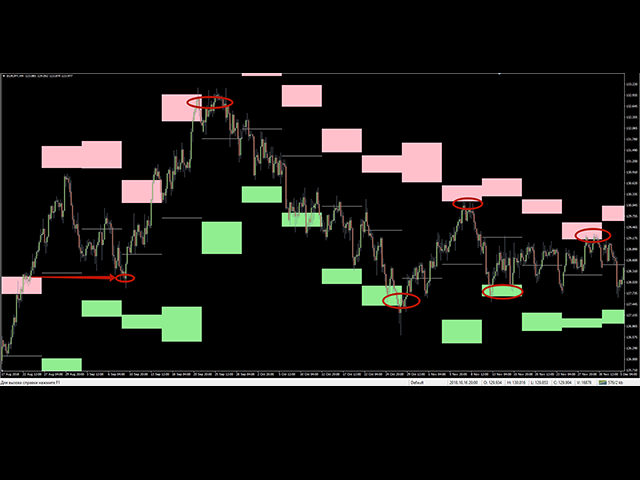
Several years of observing the principles of the operation of the Super Zone market worked, then and now, because the indicator allows you to see the trading range of the week and even the month that large market participants use. We are very easy to use on the H4 in the weekly range (in the tester it not work in the demo mode) - we sell from the upper zones and buy from the lower zones. Marks zones from the beginning of the week (month) that do not redraw, works on almost all currency pairs, working out 75-80%, if there is a breakdown, then with the same probability a return to the punched zone occurs, because at these levels orders of major players are set who will try to close positions with minimal losses. You can find similar products online, but the Super Zone indicator is configured to work thanks to the attached settings file and template (Download the template and set file, as well as see examples of the work in the discussions).


For normal operation of the indicator in the settings, it is necessary to include:


TimePeriod - 1 Week (1 Month)


Önerilen ürünler
PTW NON REPAINT TRADING SYSTEM + HISTOGRAM Non-Repainting ,   Non-Redrawing   and   Non-Lagging  Trading System. Does the following: - Gives Accurate Entry and Exit Points - Scalping, Day and Swing Trading  - 95% Accuracy  - Targets, where to take profits. - Shows Trends, Support and resistance levels - Works on All Brokers - Works on All Currencies, CFDs and Stocks - It does not place trades for you, it only shows you what trades to place. - It works on All Timeframes - It is for Trend or ran
Bu, 3Bar_Play olarak bilinen Fiyat Eylemine dayalı bir stratejidir ve 3Bar şamdan formasyonuna dayalıdır. Al/sat sinyal okları çıkmadan önce filtre ve onaylar için ek göstergeler eklenir. Bir yükseliş trendinde, düşüş trendinde veya yatay piyasada işlem görebilir. Eklenen göstergeler şunları içerir: Stokastik - Momentum Balıkçı - Trend ATR - Sinyal okunun tabanındaki Kaybı Durdur yerleşimini de açıkça tanımlayan Oynaklık (ATR Kaybı Durdurma yöntemini kullanarak). Ödül Riski, iyi bir risk yöneti
This is  a dashboard indicator that displays the Average Level of each selected currency pairs that filters and gives us a signal for overbought (>=90%) or if price at extreme peak above 90, and/or oversold (<=10%) or if price at extreme peak below 10. The calculation is using Relative Strength Index default periods (2 & 9) applied to three different higher time frames H4,D1,&W1. This won't change or altered even if you change symbol or switch to lower time frames or even in monthly and year
Bu gösterge, pratik ticaret için mükemmel olan otomatik dalga analizine yönelik bir göstergedir! Dava... Not:   Dalga sınıflandırması için Batılı isimleri kullanmaya alışkın değilim. Tang Lun'un (Tang Zhong Shuo Zen) adlandırma kuralının etkisiyle, temel dalgayı   kalem   , ikincil dalga bandını ise   segment   olarak adlandırdım. aynı zamanda segmentin trend yönü vardır. Adlandırma   esas olarak trend segmentidir   (bu adlandırma yöntemi gelecekteki notlarda kullanılacaktır, öncelikle söyleyey
BinaryIndi
Andrey Kravchenko
This is an arrow indicator for binary options. It does not redraw, arrows do not disappear. The indicator implements an optional tester for visual monitoring of the number of signal and win rate. Does not require adjustment or fitting. Works on all pairs and gold. The signal appears at the close of a candle. Entry is made on the next bar. Optional alert. For trading with robots, there is a setting for the number of bars in history. If 0, the entire history is used. The EA operation time: 24/5 Wo
Unlock Smarter Trading with the Bands Breakout! Are you tired of confusing charts and missed opportunities? Get clear, high-probability entry and exit signals right on your chart with the Bands Breakout  indicator! This isn't just another indicator; it's a complete, trend-aware system designed to simplify your trading decisions and focus only on the best moves. Our unique engine combines the momentum power of the EMA 10 with the volatility framework of the Bollinger Bands to find definitive buy
FREE
Free Lotus
Christophe Godart
Due to the huge success of the limited free version, the now low priced LOTUS version will continue being updated in the future. Optimal for Binary Options and Forex. For beginners and intermediates. Lotus is 100% non repaint. The strategy is based on 4 ADX parameters, including pivot points and candle patterns.  It is recommendable to combine the arrow with an moving average, Elliot waves indicator or Parabolic SAR. The main goal was to  keep it as simple as possible ! No useless oscillators.
The basis of the indicator is based on my trading strategy, according to which I trade daily. I automated my system so that it would learn on the market independently. The indicator will not show transactions on the history of the chart, since all calculations of the trading system are in real time. Differences from other indicators: Real time calculations Dynamic Take Profits Dynamic Signals Trend Signals Ideal for beginners Any Currency Pair Any TimeFrame Suitable for scalping To enter
Pyro Trend
Oleksii Ferbei
Pyro Trend is a new product that allows you to identify the current market phase (uptrend, downtrend or flat). The indicator is applicable for any data and periods. The middle of the trend wave, as well as the edges, are places of special heat and market behavior; when writing the indicator, an attempt was made to implement precisely finding the middle. Pyro Trend is a trend indicator that uses an original calculation algorithm. This indicator paints arrows in different colors depending on the
Yawabeh SD Pro –  Professional Supply and Demand Indicator Trade Smarter with Volume-Confirmed Supply/Demand Zones Our institutional-grade algorithm identifies high-probability reversal zones before price reacts, giving you the edge in Forex, Crypto, and Stocks. Key Features Multi-Timeframe Confirmation – View trend strength across multiple timeframes simultaneously – Align your trades with higher timeframe momentum Smart Alert System – Real-time notifications for: – Strong demand/supply zone
The indicator monitors the MACD trend in multiple timeframes for a specific market. No more shifting in between charts to check the trend direction while trading. Key Features Indicator can be used for all markets Monitors every timeframe, from M1 to MN Able to move display label on chart by single click Indicator Usage The dashboard appears to the left and upper part of the chart when attached. The shell encapsulating a timeframe goes red on a down trend, green on an up trend. If the default
AuroraV5
Ron Fritzhugh Bryan
I could write a fantastic description with lots of quantitative testing parameters but we have a saying that "taste of a pudding is in the eating " so I will simple put a CHALLENGE :Test this EA on any of the major and minor pairs (AUD,USD,EUR,CHF,NZD )and I guarantee you  50% discount if you can prove in a test on any of the major pairs above  that you have incurred  more than 3 error runs. *NOW HAPPY TESTING* Then you get to write the description unhindered!!!!!!!!!!!!!!!!!!!!!!!!!!!!!!!
Gann Kare Göstergesi, W.D. Gann tarafından yazılan "Piyasa Tahminleri için Matematiksel Formül" makalesine dayalı güçlü bir piyasa analizi aracıdır. Bu araç, piyasa analizi için matematiksel ve Gann teorilerini kullanarak hassas analizler gerçekleştirir. 144, 90, 52 karelerini ve ayrıca 9 karesini kullanır. Ayrıca, 'ın 9 karesi ve bu kareyle ilişkili kanallar ve yıldız modelleri için yöntemini içerir. Kullanıcı Kılavuzu ve Uygulama: Bu göstergeleri kullanmadan önce, kullanıcı kılavuzunu okumanız
Trend surfer is indicator based on volume calculation in combination with algorithm that recognize trend changes . For aditional filtering, user can choose from 3 different oscillators, or can use their combination. Basic idea of indicator is to give signal when current volume is above value defined as Volume MA period*Volume MA multiplier, and trend change algorithm detects start of new trend wave. When all conditions are met and new trend wave is detected, indicator plot arrow on chart. Arrows
**Binary Smart System: En İyi İşlem Yardımcınız** Binary Smart System sadece bir gösterge değil, piyasaların çeşitli alanlarında hassaslıkla işaretler üreten sofistike bir işlem aracıdır. Keskin algoritmaların ve geniş bir teknik gösterge koleksiyonunun birleşiminden oluşan bu sistem, işlem başarınızı en üst düzeye çıkarmak için tasarlanmıştır. **Gösterge Bileşenleri:** 1. **Hareketli Ortalama Yüzdesi (HAY):** Bu bileşen, birden fazla hareketli ortalamanın ağırlıklı ortalamasını hesaplar ve
Super Ichi İndikatörü Nedir? Super Ichi, Ichimoku Kinko Hyo ve SuperTrend indikatörlerinin gelişmiş bir kombinasyonudur. Bu güçlü teknik analiz aracı, piyasa trendlerini belirlemek ve alım-satım sinyalleri üretmek için tasarlanmıştır. Ne Yapar? Çift Seviyeli Trend Analizi : Tenkan-sen ve Kijun-sen çizgilerinin özelleştirilmiş versiyonlarını kullanır Otomatik Sinyal Üretimi : Kesim noktalarında görsel işaretler (oklar) gösterir Anlık Alarm Sistemi : Yeni sinyaller oluştuğunda sesli ve görsel uyar
FREE
Scalp88
Andrey Kozak
Scalp88 — MTF Scalp Indicator for XAUUSD (M1) Scalp88 is a professional scalping indicator for MetaTrader 4 , designed for fast market reading on the M1 timeframe and trading in the direction of the prevailing impulse. The indicator combines dynamic trend logic , volatility normalization (ATR) , and multi-timeframe confirmation (MTF) , presenting everything as clear arrows and an easy-to-read strength percentage. To learn how to purchase the indicator, follow this link:  https://www.mql5.com/en/
" Valiant Strong Trend " - Your Ultimate MT4 Signal Indicator Are you ready to elevate your trading game to new heights? Look no further than the "Valiant Strong Trend" MT4 signal indicator, your indispensable tool for navigating the complex world of financial markets. Key Features: Precise Trend Identification : "Valiant Strong Trend" employs advanced algorithms to accurately identify market trends, whether they are bullish or bearish. Say goodbye to guesswork and hello to informed trading deci
"Binary Smart Eye" MT4 göstergesi, M1'den W1'e kadar geniş bir zaman diliminde çalışan, hem ikili opsiyon hem de forex piyasaları için ticaret sinyalleri sağlamak üzere tasarlanmıştır. Potansiyel giriş noktalarını belirlemek için trend seviyelerini, akıllı bir hareketli ortalamayı ve optimize edilmiş ticaret dönemlerini birleştiren özel bir strateji kullanır. İşte temel özelliklerinin bir dökümü: Çoklu Zaman Dilimi Analizi: Göstergenin çok yönlülüğü, yatırımcıların M1'de scalping'den W1'de uzun
introduction: Hello, I present to you the advanced and final version of the "Binary Hedger FV" Expert Advisor. I won't delve into extensive details about the EA's concept, as I've covered all the information in the initial version or what can be referred to as the EA's trial version, accessible through the following link: https://www.mql5.com/en/market/product/93688?source=Site +Market+My+Products+Page In this presented version, you have a comprehensive and complete release that incorporates all
SYSTEM INTRODUCTION:   The Binary Options Channels System Is Specifically Designed For Binary Options Trading. Unlike Other Systems And Indicators That Were Adopted From Other Trading Environments For Binary Options. Little Wonder Why Many Of Such Systems Fail To Make Money . Many End Up Loosing Money For Their Users.  A Very Important Fact That Must Be Noted Is The Fact That Application Of Martingale Is not Required. Thus Making It Safer For Traders Usage And Profitability. A Trader Can Use Fi
Trend Line Finder
Stephen Reynolds
5 (1)
Trend Line Finder will project forward a support and resistance lines using 2 previous highs for resistance and 2 previous lows for support.  It will then signal to the trader by alert making the trader more aware that a possible good move is about to happen.     This is not a stand-alone trading system but is very useful in finding key areas of support resistance levels where price will usually either rebound from or breakthrough. Its down to the trader to decide what to do with use of other s
The 10PIPS Dynamite
Stephen Kehinde Kuku
The 10PIPS Dynamite is a semi-automated  cutting-edge Forex indicator designed to    automatically revolutionize your trading skills from a being a losing trader to becoming a profitable trader simply by Scalping   10 pips per Trade setup generated by the software. 10PIPS Dynamite Indicator once attached on the main chart it starts an in-depth market analysis based on its unique in-built advanced algorithm which seamlessly combines powerful indicators, statistical analysis, and trend recognition
Global Trend
Vitalii Zakharuk
Global Trend Indicator, shows the signals for entry. Displays both entry points and the trend itself. Shows statistically calculated moments for entering the market with arrows. When using the indicator, the risk factor can be optimally distributed. Settings: Uses all one parameter for settings. Choosing a parameter, it is necessary to visually resemble it so that the appropriate graph has a projection of extremes. Parameters: Length - the number of bars for calculating the indicator. Use
ManualTradingTrend
Mukhriddin Ibragimov
Трендовый индикатор МТ4, дающий точные сигналы для входа в сделки. Работает без перерисовки и запаздываний! Только покупателем данного индикатора прилагается основной фильтр,обращайтесь в личку.   Идеальные точки входа в сделки для     валют, крипты, металлов, акций, индексов . Наилучшие результаты на таймфрейме M30 и выше! Наш канал в Telegram  |   Версия индикатора для MT5 Скоро   видео  for indicator Большинство трейдеров улучшают торговые результаты в первую неделю торговли с инд
Ultimate Dynamic Levels
Hispraise Chinedum Abraham
4.7 (10)
Şu anda tatil indiriminde $399! Fiyatlar gelecekte artabilir. Aşağıdaki açıklamayı okuyun!  Ultimate Sniper Dashboard için EN İYİ Giriş Göstergesi olan Ultimate Dynamic Levels ile tanışın! Son derece Düşük Riskli zamanında girişler ve yüksek RR!!! Ultimate Sniper Dashboard'u BURADA bulabilirsiniz. Hem yeni başlayanlar hem de profesyonel tüccarlar için en önemli yetenek, bir piyasanın tam olarak nereye ve ne zaman dönme olasılığının en yüksek olduğunu ve güvenli bir şekilde nasıl girileceğini v
Grafikleri yapılandıran ve döngüsel fiyat hareketlerini belirleyen teknik bir gösterge. Herhangi bir grafik üzerinde çalışabilirim. Birkaç çeşit bildirim var. Grafiğin kendisinde ek oklar var. Tarihe yeniden bakmadan, mumun kapanışına dair çalışmalar. M5 ve üzeri TF önerilir. Kullanımı ve yapılandırması kolay parametreler. Farklı parametrelere sahip 2 indikatörü kullanırken, bunları diğer indikatörler olmadan da kullanabilirsiniz. 2 giriş parametresi vardır Döngüsellik ve Sinyal Süresi Bu 2 pa
Introduction to Fractal Pattern Scanner Fractal Indicator refers to the technical indicator that makes use of the fractal geometry found in the financial market. Fractal Pattern Scanner is the advanced Fractal Indicator that brings the latest trading technology after the extensive research and development work in the fractal geometry in the financial market. The most important feature in Fractal Pattern Scanner is the ability to measure the turning point probability as well as the trend probabi
Overview Happy Croc is a trend-following and momentum-based technical indicator, it is built upon the classic Bill Williams Alligator logic and significantly enhanced by adding two critical filters: 200 SMA and Stochastic Oscillator for momentum confirmation. The indicator is designed to identify "crossover" events specifically in the direction of the dominant market trend.   Key Functions Trend Filtering (SMA 200) Acts as a primary gatekeeper for signals: Buy arrows are only permitted when the
Reversal Overlap Bot is an automated trading strategy. No technical indicators are used in the work. At the beginning of trading, the first order is placed in a certain direction (at your option). When you open a new candle, this order is closed if it is in profit. Otherwise, the next order opens in the opposite direction. Orders are closed when profit is reached. If there are unprofitable orders on the chart, the robot will close one of them. When closing loss-making orders, the profit covers t
Bu ürünün alıcıları ayrıca şunları da satın alıyor
Pulse Scalping Line - an indicator for identifying potential pivot points. Based on this indicator, you can build an effective Martingale system. According to our statistics, the indicator gives a maximum of 4 erroneous pivot points in a series. On average, these are 2 pivot points. That is, the indicator shows a reversal, it is erroneous. This means that the second signal of the indicator will be highly accurate. Based on this information, you can build a trading system based on the Martingale
Miraculous Göstergesi – Gann Dokuz Kareye Dayalı %100 Tekrarlamayan Forex ve İkili Araç Bu video, Forex ve İkili Opsiyon traderları için özel olarak geliştirilmiş son derece doğru ve güçlü bir ticaret aracı olan Miraculous Göstergesi 'ni tanıtıyor. Bu göstergeyi benzersiz kılan, efsanevi Gann Dokuz Karesi ve Gann Titreşim Yasası 'na dayanmasıdır; bu da onu modern ticarette mevcut en hassas tahmin araçlarından biri yapmaktadır. Miraculous Göstergesi tamamen tekrarlamaz ; yani mum kapandıktan son
F-16 Uçak Göstergesini tanıtıyoruz, ticaret deneyiminizi devrimleştirmek için tasarlanmış son teknoloji bir MT4 aracı. F-16 savaş uçağının eşsiz hızı ve hassasiyetinden ilham alan bu gösterge, finansal piyasalarda eşi benzeri olmayan performans sunmak için ileri algoritmalar ve son teknoloji teknolojileri bir araya getirir. F-16 Uçak Göstergesi ile gerçek zamanlı analiz sunarak yüksek doğruluklu ticaret sinyalleri üretirken rekabetin üzerine çıkacaksınız. Dinamik özellikleri, farklı varlık sınıf
Meravith
Ivan Stefanov
5 (1)
Gösterge, her noktadan hacmi analiz eder ve bu hacim için piyasa tükenme seviyelerini hesaplar. Üç çizgiden oluşur: Boğa hacmi tükenme çizgisi Ayı hacmi tükenme çizgisi Piyasa trendini gösteren bir çizgi. Bu çizgi, piyasanın boğa mı yoksa ayı mı olduğunu yansıtacak şekilde rengini değiştirir. Piyasayı istediğiniz herhangi bir başlangıç noktasından analiz edebilirsiniz. Bir hacim tükenme çizgisine ulaşıldığında, bir sonraki analize başlamak için yeni bir nokta belirleyin. Herhangi bir şeyi analiz
" Dynamic Scalper System " göstergesi, trend dalgaları içinde işlem yapmak için scalping yöntemi için tasarlanmıştır. Başlıca döviz çiftleri ve altın üzerinde test edilmiştir, diğer işlem araçlarıyla uyumluluğu mümkündür. Ek fiyat hareketi desteğiyle trend boyunca pozisyonların kısa vadeli açılması için sinyaller sağlar. Göstergenin prensibi. Büyük oklar trend yönünü belirler. Küçük oklar şeklinde scalping için sinyaller üreten bir algoritma trend dalgaları içinde çalışır. Kırmızı oklar yüksel
Gold Channel is a volatility-based indicator, developed with a specific timing algorithm for the XAUUSD pair, which consists of finding possible corrections in the market. This indicator shows two outer lines, an inner line (retracement line) and an arrow sign, where the theory of the channel is to help identify overbought and oversold conditions in the market. The market price will generally fall between the boundaries of the channel. If prices touch or move outside the channel it is a tradi
OrderFlow Absorption – MT4 için Profesyonel Delta ve Absorpsiyon Sinyal Göstergesi OrderFlow Absorption ile gerçek emir akışı analizinin gücünü keşfedin – MetaTrader 4 için nihai delta histogramı ve absorpsiyon sinyal göstergesi. Fiyat hareketlerinin arkasında gerçekte neler olduğunu görmek isteyen traderlar için tasarlanan bu araç, piyasayı hareket ettiren gizli alım/satım baskısını ve absorpsiyon olaylarını ortaya çıkarır. Özellikler Delta Histogramı Görselleştirme:   Alım ve satım baskısını a
The Hurricane Indicator
Paul Nicholas Clevett
5 (1)
Currently switched to the 4 hour chart - but use other time frames for confirmation. :-)  I change my main time frame based on the market movement at the time. The Hurricane Forex Indicator is a multi time frame indicator that includes such things as Trade Notifications, Trade Calculator, Momentum Indicator, risk reward and much more. We have a free Trade room for our users as well. Please check out the video for full details of how this indicator works as it has over 15 years worth of developme
Everyone who purchases the Scalping signals M1 indicator receives a FREE BONUS — a fully automated Expert Advisor that trades based on the indicator’s signals. The indicator shows the arrows — the robot can execute the trades for you, following all signals and risk-management rules. Scalping signals M1 – a ready-made trend-following entry system for M1 Scalping signals M1 is an indicator that turns your chart into a clear action map: a colored trend channel shows the direction of the market, and
BinaryIndicator is a highly accurate indicator for trading binary options. It shows excellent results in scalping. This indicator is based in multifactor analysis of trend indicators, as well as confirmation oscillators, which in the end gives an increased accuracy of signals. Advantages of the indicator Increased accuracy of signals. Excellent results when trading binary options with a short expiration time from M30 to M1 . It works on any timeframes. Works with any trade symbols. Parameters
Shows price reversal points with arrows. Works on all timeframes and all currency pairs. Suitable for both scalping and long-term trading. When the blue arrow appears, you need to open a buy order. When the red arrow appears, you need to open a sell order. Recommended timeframes M5, M15, H1, H4. The indicator shows the best results on GBPUSD, XAUUSD, EURUSD, USDJPY, AUDUSD, USDCHF, EURGBP, EURJPY, EURCHF and other major pairs. This indicator is well suited for intraday scalping because it show
Scalpetronix Indicator — the signal core of the Scalpetronix robot. This indicator implements the algorithms and signals on which the Scalpetronix Expert Advisor operates. All entries of the robot are generated based on these calculations: a combination of exponential moving averages, trend filtering via ADX, volatility normalization through ATR, and bar structure analysis. Advantages of the indicator works on a multi-level EMA system (fast and slow) with a dynamic threshold; eliminates weak si
This indicator is a multifunctional technical analysis tool based on the combination of an adaptive exponential moving average and volatility filters calculated through the Average True Range (ATR). It is designed to accurately identify the current price direction, highlight key trend reversal areas, and visualize potential turning zones. The algorithm is built upon the dynamic construction of a trend ribbon using two levels of volatility — outer and inner ranges. The outer boundaries serve as i
Rtc ML Ai | Predictor CORE MACHINE LEARNING ENGINE Adaptive ML Market Predictor – Multi-Bar Trend & Candle Forecast What This Indicator Does This indicator is a  real-time market prediction engine  designed to analyze price behavior and estimate  future market tendencies . Unlike conventional indicators, this system  does not rely on static parameters or historical curve-fitting , but adapts its internal state dynamically during live market operation. Instead of using static rules, the indic
FFx Engulfing Setup Alerter gives trade suggestions with Entry, Target 1, Target 2 and StopLoss. Below are the different options available: Entry suggestion - pips to be added over the break for the entry 3 different options to calculate the SL - by pips, by ATR multiplier or at the pattern High/Low 3 different options to calculate the 2 TPs - by pips, by ATR multiplier or at Risk/Reward Offset the dashboard - any place on the chart Remove the suggestion once the price reached the SL line Lines
FFx InsideBar Setup Alerter gives trade suggestions with Entry, Target 1, Target 2 and StopLoss. Below are the different options available: Entry suggestion - pips to be added over the break for the entry Minimum candle size - to avoid too close buy/sell entry suggestions 3 different options to calculate the SL - by pips, by ATR multiplier or at the pattern High/Low 3 different options to calculate the 2 TPs - by pips, by ATR multiplier or at Risk/Reward Offset the dashboard - any place on the c
FFx OutsideBar Setup Alerter gives trade suggestions with Entry, Target 1, Target 2 and StopLoss. Below are the different options available: Entry suggestion - pips to be added over the break for the entry. 3 different options to calculate the SL - by pips, by ATR multiplier or at the pattern High/Low. 3 different options to calculate the 2 TPs - by pips, by ATR multiplier or at Risk/Reward. Offset the dashboard - any place on the chart. Remove the suggestion once the price reached the SL line.
FFx PinBar Setup Alerter gives trade suggestions with Entry, Target 1, Target 2 and StopLoss. Below are the different options available: Entry suggestion - pips to be added over the break for the entry Minimum candle size - to avoid too small candles 3 different options to calculate the SL - by pips, by ATR multiplier or at the pattern High/Low 3 different options to calculate the 2 TPs - by pips, by ATR multiplier or at Risk/Reward Offset the dashboard - any place on the chart Remove the sugges
Automatic, live & interactive picture of all trendlines. Assign push, email and sound alerts to the lines of your choice and be informed about price rollback, breakout, rollback after breakout, number of rollbacks, line expiration by double breakout. Correct, drag or delete the lines and interactively tune the line system. https://youtu.be/EJUo9pYiHFA . Chart examples https: //www.mql5.com/en/users/efficientforex Price Interaction Events All events are effective immediately and only after one
The purpose of this new version of the MT4 standard indicator provided in your platform is to display in a sub-window multiple timeframes of the same indicator with its divergences. See the example shown in the picture below. But the display isn't like a simple MTF indicator. This is the real display of the indicator on its timeframe. Here's the options available in the FFx divergences indicator: Select the timeframes to be displayed (M1 to Monthly) Define the width (number of bars) for each tim
The purpose of this new version of the MT4 standard indicator provided in your platform is to display in a sub-window multiple timeframes of the same indicator with its divergences. See the example shown in the picture below. But the display isn't like a simple MTF indicator. This is the real display of the indicator on its timeframe. Here's the options available in the FFx divergences indicator: Select the timeframes to be displayed (M1 to Monthly). Define the width (number of bars) for each ti
The FFx Dashboard MTF alerter will show you on a single chart all the timeframes (M1 to Monthly) with their own status for the indicator. 2 Alert Options: Single timeframe: each selected timeframe alert separately when a signal occurs Multi timeframes: all selected timeframes must agree for an alert to be triggered Both options have an input to select the timeframes to be used for the alert(s). How to Understand the Status: Green/Red square: histogram above/below 0 line Green square + Red bord
The FFx Dashboard MTF alerter will show you on a single chart all the timeframes (M1 to Monthly) with their own status for the indicator. 2 Alert Options: Single timeframe: each selected timeframe alert separately when a signal occurs Multi timeframes: all selected timeframes must agree for an alert to be triggered Both options have an input to select the timeframes to be used for the alert(s). How to understand the status: Green/Red square: RSI above/below 50 line Green square + Red border: R
The FFx Dashboard MTF alerter will show you on a single chart all the timeframes (M1 to Monthly) with their own status for the indicator. 2 Alert Options: Single timeframe: each selected timeframe alert separately when a signal occurs Multi timeframes: all selected timeframes must agree for an alert to be triggered Both options have an input to select the timeframes to be used for the alert(s). How to understand the status: Green/Red square: Stoch above/below 50 line Green square + Red border:
The FFx Dashboard MTF alerter will show you on a single chart all the timeframes (M1 to Monthly) with their own status for the indicator. 2 Alert Options: Single timeframe: each selected timeframe alert separately when a signal occurs Multi timeframes: all selected timeframes must agree for an alert to be triggered Both options have an input to select the timeframes to be used for the alert(s). How to understand the status: Green/Red square: Price above/below Cloud (Kumo) Green square + Red bo
The FFx Dashboard MTF alerter will show you on a single chart all the timeframes (M1 to Monthly) with their own status for the indicator. 2 Alert Options: Single timeframe: each selected timeframe alert separately when a signal occurs Multi timeframes: all selected timeframes must agree for an alert to be triggered Both options have an input to select the timeframes to be used for the alert(s). How to understand the status: Green/Red square: MA pointing Up/Down Green square + Red border: MA po
The FFx Dashboard MTF alerter will show you on a single chart all the timeframes (M1 to Monthly) with their own status for the indicator. 2 Alert Options: Single timeframe: each selected timeframe alert separately when a signal occurs. Multi timeframes: all selected timeframes must agree for an alert to be triggered. Both options have an input to select the timeframes to be used for the alert(s). How to understand the status: Green square: Price above PSAR Red square: Price below PSAR Options
Yazarın diğer ürünleri
Super Zone indicator
Dmitriy Sotnikov
5 (1)
Super Zone   For several years of observing the principles of the market, Super Zone worked, both then and now, because the indicator  allows you to see the trading range of the  week and even the month that major market participants use. It’s very easy to use, we work on H4 in the weekly range (  in the tester it doesn’t work in the demo mode  ) - we sell from the upper zones, we buy from the lower ones. It marks the zones from the beginning of the week (month) that are  not redrawn  , works on
Filtrele:
Natasha.s
26
Natasha.s 2019.03.31 14:10 
 

Kullanıcı incelemeye herhangi bir yorum bırakmadı

İncelemeye yanıt