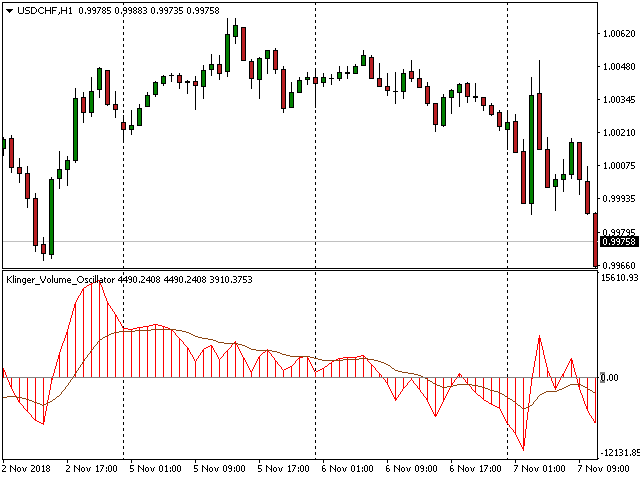
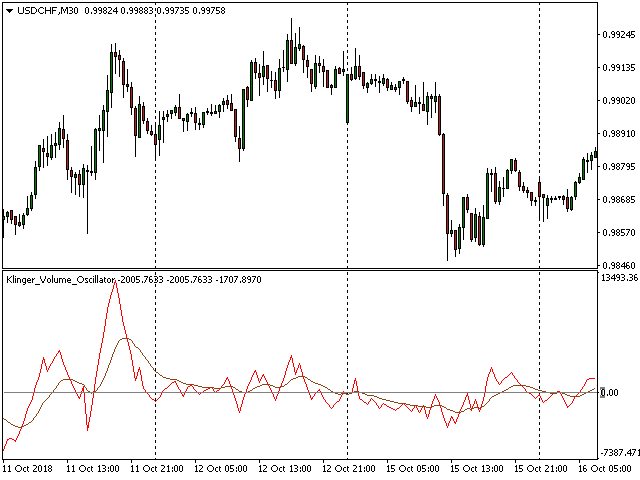
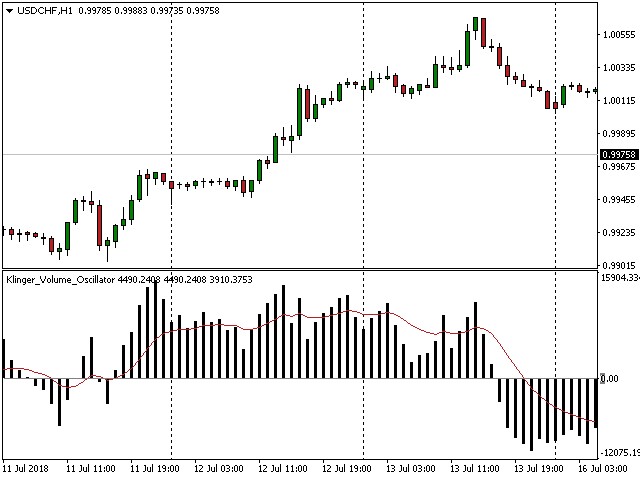
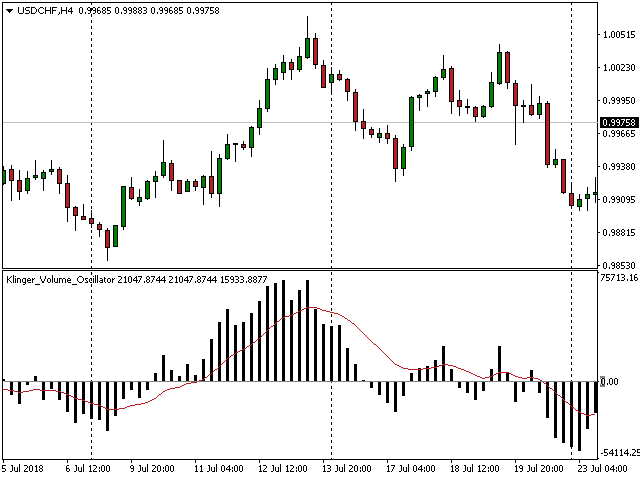
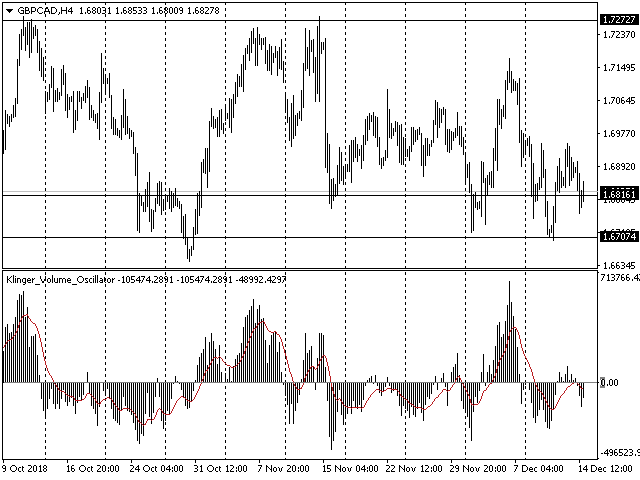
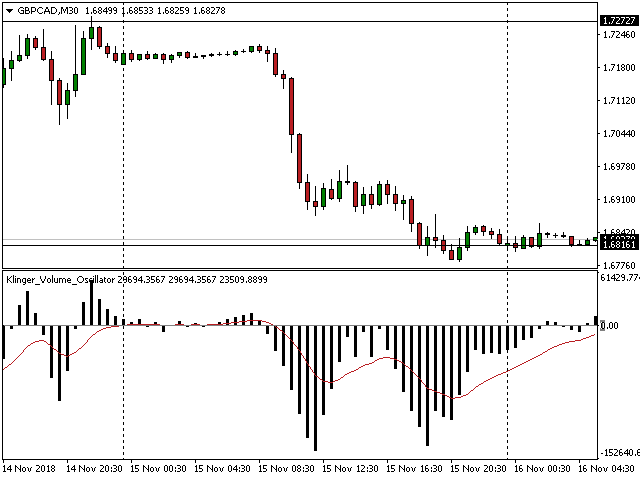
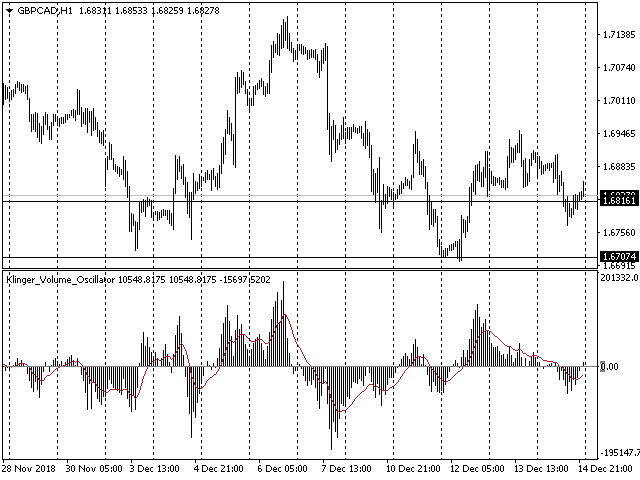
Klinger Volume Oscillator
- Göstergeler
- Sürüm: 1.0
- Etkinleştirmeler: 5
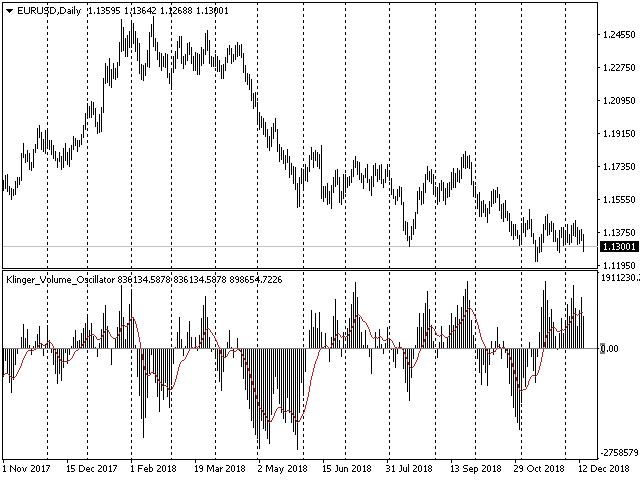
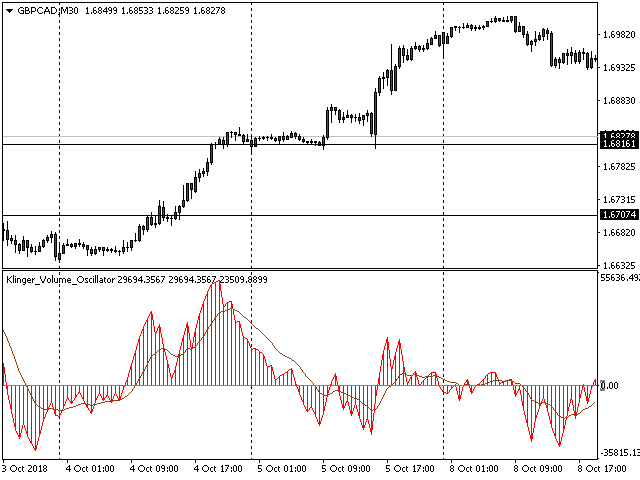
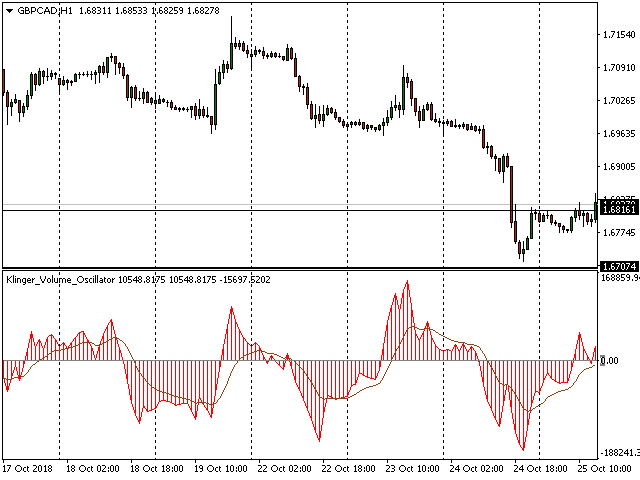
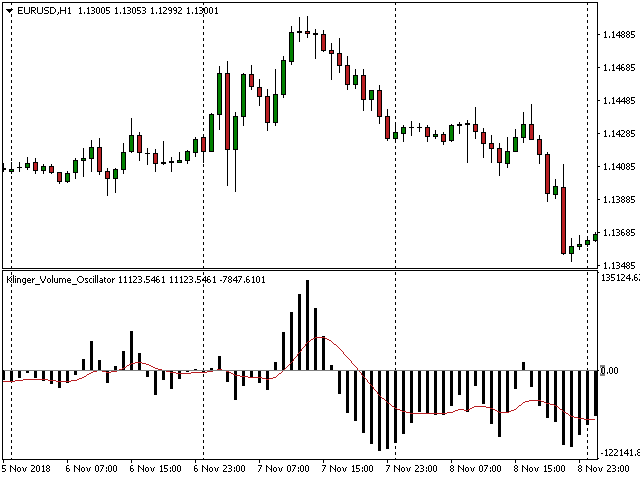
Or (KVO) determines the long-term trend of money flow while remaining sensitive enough to detect short-term fluctuations.It uses the key price compared to the prior bar's key price to assign volume as positive or negative value. Volume is a measure of how many units of a pair are trading per unit of time.You can choose between a KVO line, histogram, or both combined with this Klinger Volme Oscillator.The Klinger Volume Oscillator is a trend reversal indicator. It relies on the concept of a volume force against the signal line.
Calculation of the Klinger Volume Oscillator
Volume Force = volume * trend * temp * 100
Trading Tips
- KVO uses a signal line (13-period exponential moving average) is used to trigger buy or sell signals.
- KVO is when the peak or trough of the KVO line or KVO histogram is inside the signal line.
- KVO uses divergence to identify when price and volume are not confirming the direction of the move. It's a bullish sign when the value of the indicator is heading upward while the price of the security continues to fall and vice versa for a bearish sign.
- A crossover of the Klinger line or histogram above or below the signal line creates a timely buy or sell signal.
Inputs
- Signal Period: 13 Period exponential moving average (default) calculates the signal line.
- Short Cycle: 34 Period exponential moving averages (default) is used to calculate the the volume of the trend
- Long Cycle: 55 Period exponential moving averages (default) is subtracted from the short cycle to give the final value.
Colors and Settings
- Signal Line: Saddle Brown (default)
- KVO Line: Red(Default)
- KVO Histogram: Red (default)
Happy trading.
Regards:
Demetrios Kostopoulos