Flat SMC Structure Map MT4

  • Göstergeler
  • Keijinro Mizutani
    Keijinro Mizutani
    Hello, I’m kotoha, a system designer focused on research-driven, rule-based trading tools for the MT5 platform.
    My work centers on market structure analysis, swing dynamics, and Fibonacci-based logic.
  • Sürüm: 1.1
  • Etkinleştirmeler: 5

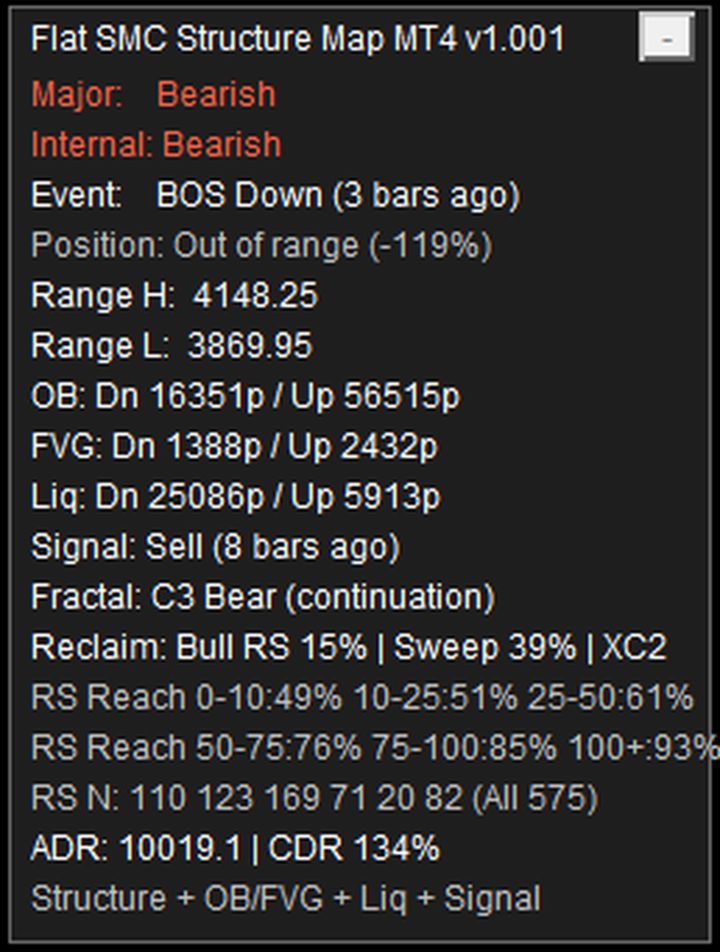
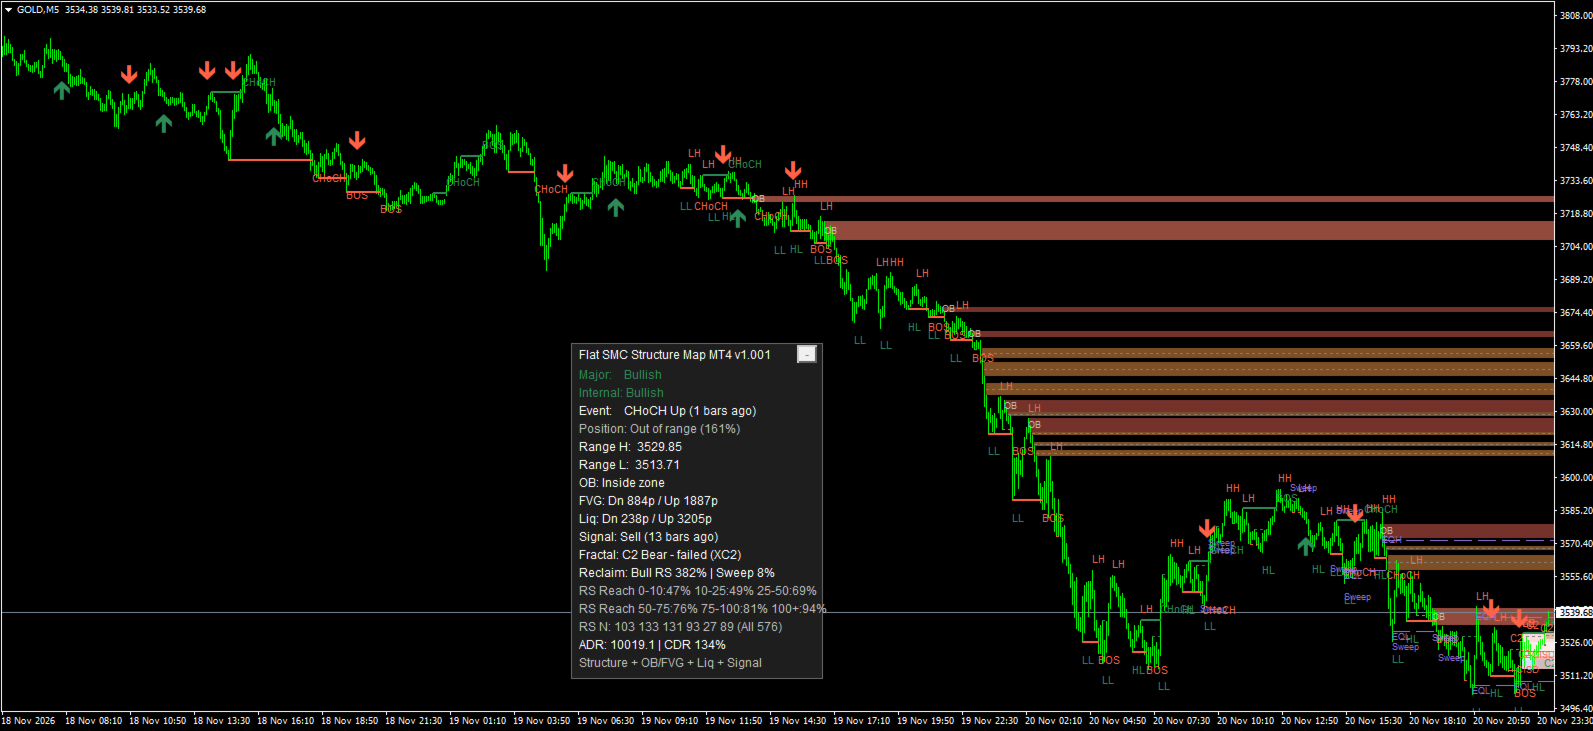
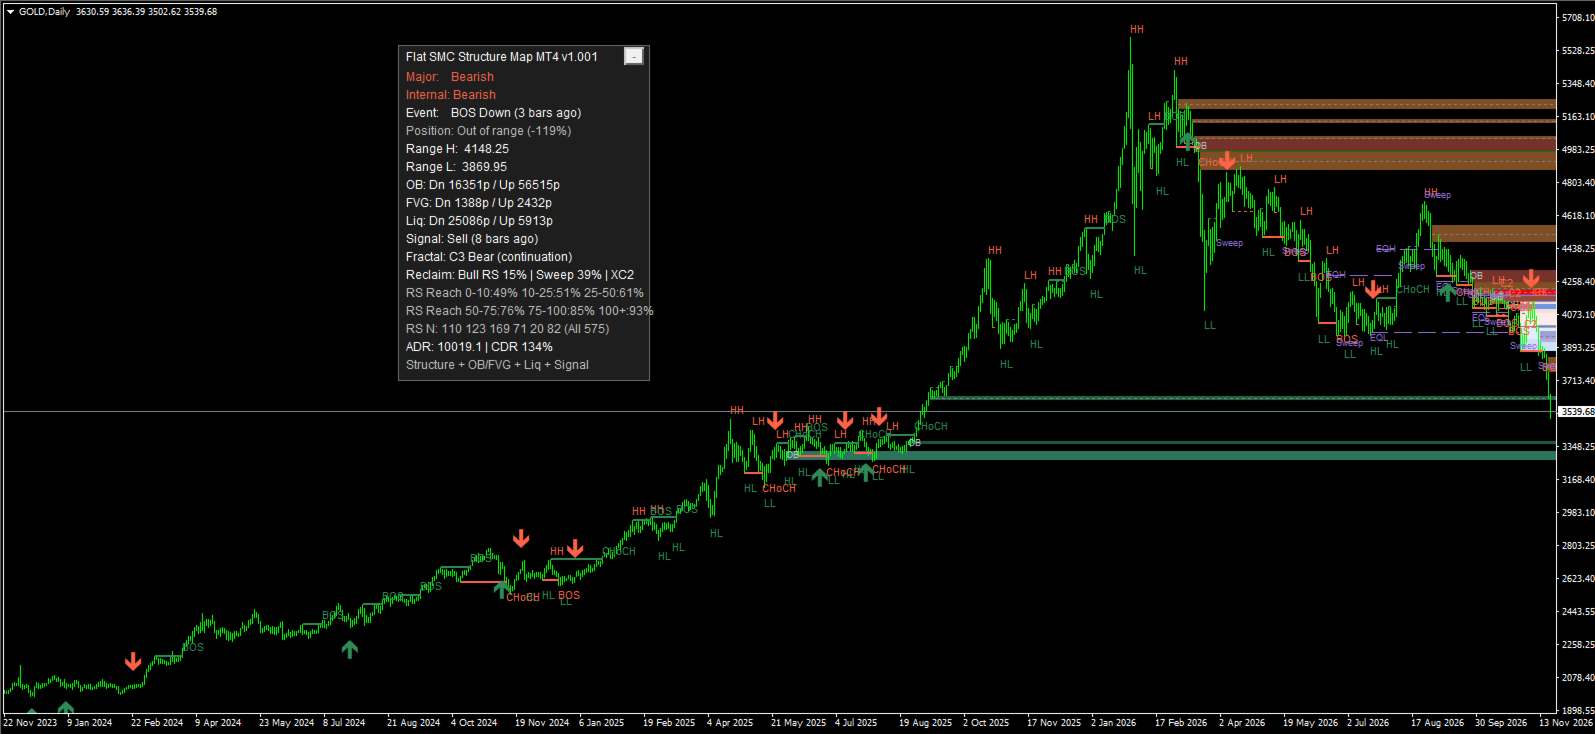
Flat SMC Structure Map is a Smart Money Concepts structure indicator for MetaTrader 4. It draws the market structure on one chart: BOS / CHoCH, order blocks, FVGs, liquidity lines (EQH / EQL) and sweeps, and premium / discount positioning — all judged on closed bars only, so confirmed drawings never repaint.

Structure: two layers — major swings (default left/right 5) for the main flow and internal swings (default 2) for the short-term flow, each labelled HH / HL / LH / LL. A close break in the trend direction is a BOS; the first close break against it is a CHoCH.

Order blocks: the last opposite candle before a major break, kept only when the break bar's body is at least ATR(14) x 0.5 (displacement). Zones are mitigated on touch and invalidated on a close through the far side. FVGs: three-bar gaps of at least ATR x 0.1, with an optional CE (50%) line, removed when fully filled. Drawn zones have a configurable age limit (default 400 bars) so old zones do not clutter the chart; detection itself always uses the full lookback.

Liquidity: swing highs/lows that line up within ATR x 0.15 form EQH / EQL dashed lines. A wick through the line with a close back inside is recorded as a sweep; a close through it ends the line as a break.

Premium / discount: the latest major swing range is split into four bands plus the 50% equilibrium — no Fibonacci ratios, just relative position. The dashboard panel shows both trend layers, the latest event, range high/low and position %, the distance in pips to the nearest order block / FVG / liquidity line, the latest signal, and the state of the additional modules below. The panel can be dragged anywhere; its position is stored per symbol and timeframe.

Confluence signals: a Buy requires discount positioning (below 50%), a recent bullish CHoCH (or a BOS preceded by an internal CHoCH), and a touch of a bullish order block or FVG — the Sell is the mirror image. One signal per event, with a same-direction cooldown. Buffer 0 = Buy, buffer 1 = Sell, edge type: 1.0 on the signal bar only, EMPTY_VALUE otherwise; the buffers can be read at shift 1 via iCustom by other tools and EAs. Please note: this MT4 version has no Flat Manual Trader linkage — the MT4 build of Flat Manual Trader cannot take in external signals, so the FMT combination is available only between the MT5 versions. Optional alerts for BOS/CHoCH, sweeps, signals, CISD confirmations and reclaim setups (all OFF by default).

Additional modules (each can be switched on/off individually; none of them changes the confluence signal definition): a fractal model — C2 (sweep + reclaim bar), CISD (reversal confirmation level), protected swings and C3 (continuation), with a bias filter based on the major structure direction; reclaim strength (RS) — how far a C2 bar recovered relative to the previous bar's range, shown in % with per-band follow-through statistics aggregated on the panel (a summary of past data, not an indication of future results); killzones — the five ICT session boxes (Asia / London / New York AM / London Close / New York PM), off by default; pivots — previous day / week / month high, low, open and midpoint lines, off by default; and ADR / CDR — average daily range and today's consumed portion of it on the panel, with optional ADR level lines.

Works on any symbol and any timeframe. MetaTrader 4 only — it does not run on MetaTrader 5 (the MT5 version is a separate product). This indicator does not place orders.

Disclaimer: This product displays market structure and records confluence signals based on historical and current price data. It is not investment advice, not a prediction, and does not guarantee any future result or profit. Trading involves risk; decisions are your own responsibility.
Önerilen ürünler
YK-Fibo Pivot Indicator: Trade Smarter with Fibonacci Pivot Points The YK-Fibo Pivot Indicator is a powerful technical analysis tool that combines the precision of Fibonacci retracements with the insights of Pivot Points. Whether you're a novice or seasoned trader, this indicator empowers you to spot profitable opportunities in the market with ease. Why Choose YK-Fibo Pivot? Pinpoint Support & Resistance: By calculating Fibonacci levels based on the previous day's high, low, and close prices, y
ForexAurum Fibonacci indicator is a useful tool for traders who are using Fibonacci combined with the ZigZag indicators. It uses the real-time calculation of the levels for all the timeframes and displays the results for you. In addition, you can setup RSI, ADX and Stochastic indicators to confirm entries. How to use it Just drag and drop the indicator on an 1 minute chart of any symbol. Then you can switch to a higher timeframe at anytime after the initialization. Recommendation Always drag a
Fibonacci Trend Marker —  mevcut mumun önceki mumların Yüksek-Düşük (High-Low, HL) aralığına göre davranışını Fibonacci geri çekilme seviyelerini kullanarak analiz eden bir trend göstergesidir. Trendin gücünü görsel olarak takip eder ve mum renginin değişimiyle olası zayıflama veya tersine dönüş sinyalleri verir. Özellikler: Trend odaklı traderlar için tasarlanmıştır ve Fibonacci seviyelerine dayanarak trend değişikliklerini hızlıca tespit etmeye yardımcı olur. Piyasada yeterli volatilite olduğ
Fibonacci strategies EA trades Fibonacci levels. You can choose whether the EA should trade a manually plotted fibonacci or whether it should automatically plot a fibonacci. In automatic fibonacci drawing mode, the EA automatically plots a fibonacci retracement based on the number of bars you select on the BarsToScan setting in the indicator. The fibonacci is automatically updated in real time as new highest and lowest values appears amongst the selected bars. You can select which level values
Master Dot for MetaTrader 4 Detect Volatility Exhaustion Before the Market Returns to Balance Master Dot is a professional non-repainting indicator designed to detect moments when price moves beyond its statistically expected volatility range. These situations often occur during sharp market impulses, liquidity grabs or temporary emotional moves, when price departs from its normal trading conditions. Instead of following trends, Master Dot highlights volatility exhaustion — moments where the mar
This product is a part of  ON Trade Waves Patterns Harmonic Elliot Wolfe you can test free version on EURJPY from this link  Wolf Waves Indicator Kurt Dalgalarını Keşfedin - En İyi Ticaret Aracınız! Herhangi bir zaman diliminde Kurt Dalgalarını kolayca tespit etmek için güçlü bir araç mı arıyorsunuz? Daha fazla aramayın! Kurt Dalgaları göstergemiz bu işi zahmetsizce halleder. İşte neden sizin için mükemmel olduğunu anlatıyoruz: Ana Özellikler: Otomatik Algılama:   Kurt Dalgaları göstergemiz a
Classic Fractals indicator for MT4, with additional Trendlines connecting the latest couples of fractals ( fractals are showing highest high, and lowest low on each period) Rules for trendlines: -if new top fractal is below the last one = new resistance line -if new bot fractal is above the last one = new support line -Trendlines can be hidden -Fractals can be hidden Fractal Period = can be both even or uneven number, as it is setting for half (one side) of the bars sequence for findin
NO REPAINT ADVANCED CHART PATTERN INDICATOR By definition, a price ( chart)  pattern is a recognizable configuration of price movement that is identified using a series of  trendlines  and/or curves. When a price pattern signals a change in trend direction, it is known as a reversal pattern; a continuation pattern occurs when the trend continues in its existing direction following a brief pause. Advanced Chart Pattern Tracker is designed to find the MOST ACCURATE patterns. A special script is a
Free automatic Fibonacci is an indicator that automatically plots a Fibonacci retracement based on the number of bars you select on the BarsToScan setting in the indicator. The Fibonacci is automatically updated in real time as new highest and lowest values appears amongst the selected bars. You can select which level values to be displayed in the indicator settings. You can also select the color of the levels thus enabling the trader to be able to attach the indicator several times with differe
FREE
This is a new strategy for SUPPLY DEMAND areas It is based on a calculation using the tick volume to detect the big price action in market for both bear /bull actions this smart volume action candles are used to determine the supply and demand areas prices in between main supply and demand lines indicate sideway market  up arrows will be shown when prices moves above the main supply and the secondary supply lines Down arrows will be shown when prices moves below the main demand and the secondary
EARLY REMINDER: The Starting price is 65 price will rise soon up to 365$ and then 750$ after first 10 copies of sales. Grab this offer now! Introduction Hello, traders! Welcome to the demonstration of the Forex Beast Indicator , a comprehensive tool designed to assist aspiring traders in navigating the complexities of the forex market. This indicator incorporates seven essential components to provide a well-rounded trading experience: Moving Averages Colored Zones Support and Resistance Levels
TriSync MT4
Gabriel Balbino De Oliveira
TriSync User Manual Market Structure Indicator for MetaTrader 4 · Version 0.40 1. What It Is TriSync shows market structure in layers on a single chart: four nested swing levels, VWAP anchored to swing highs and lows, Daily VWAP, higher-timeframe support and resistance, three-timeframe bias, and confirmed entry arrows on closed bars. The core idea is a reading order: Location first. Context second. Timing last. The arrow is step 3, never step 1. What it is not: it is not a robot, not a blind sig
Apex Break PRO, MetaTrader 4 için yeniden çizim yapmayan bir pivot trend çizgisi kırılım göstergesidir. Pivot yükseklerini ve pivot düşüklerini tespit eder, ardışık pivotlar arasında dinamik eğimli trend çizgileri çizer ve fiyat onaylanmış bir bar kapanışında bu trend çizgilerini kırdığında alım ve satım sinyalleri üretir. Her sinyal en fazla dört bağımsız konfluans katmanından geçirilerek filtrelenir — EMA trendi, RSI sınırları, hacim ani artış tespiti ve ADX trend gücü — ve yıldız derecelendir
Awesome Oscillator by Bill Williams with the ability to fine-tune and replace the averaging algorithms of the indicator, which significantly expands the possibilities of using this oscillator in algorithmic trading and brings it closer in its properties to such an indicator as the MACD. To reduce price noise, the final indicator is processed with an additional Smooth averaging. The indicator has the ability to give alerts, send mail messages and push signals when the direction of movement of th
The correlation coefficient reflects the relationship between two values. It shows the dependence of changes in one value on changes in another. For example, from changes in the price of EURUSD and EURNZD. The correlation coefficient in trade, currency relations is constantly changing. Special indicators of correlation help to define it, trace changes, draw correct conclusions. One of them is the Hubbles Correlator indicator. The indicator allows you to simultaneously display several other char
Fibonacci SR Indicator This indicator creates support and resistance lines. This indicator is based on Fibonacci Retracement and Extension levels. It will consider many combinations of the Fibonacci levels and draw support/resistance lines based on these. This indicator uses tops and bottoms drawn by the ZigZag indicator in its calculations. The ZigZag can also be drawn on the chart, if necessary. The indicator considers many combinations of past reversal points and Fibonacci ratio levels, and w
FREE
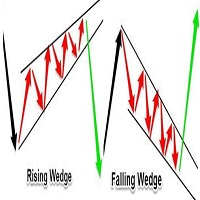
Automatic redrawing of Trend Supports and resistances levels and Possible Wedge pattern formation to indicate price breaking of Rising Wedge (signal SELL) or price breaking of falling Wedge (signal BUY) Very simple and smart indicator  ALERTS AND MOBILE NOTIFICATIONS availavle !!! you can edit the calculation bars of the bars count for formation of the trend lines and the initial shift from current price  Smaller values for bars /shift inputs when using Higher Time frames (D1-H4) and the reverse
Bu gösterge, pratik ticaret için mükemmel olan otomatik dalga analizine yönelik bir göstergedir! Dava... Not:   Dalga sınıflandırması için Batılı isimleri kullanmaya alışkın değilim. Tang Lun'un (Tang Zhong Shuo Zen) adlandırma kuralının etkisiyle, temel dalgayı   kalem   , ikincil dalga bandını ise   segment   olarak adlandırdım. aynı zamanda segmentin trend yönü vardır. Adlandırma   esas olarak trend segmentidir   (bu adlandırma yöntemi gelecekteki notlarda kullanılacaktır, öncelikle söyleyey
Standart Sapma Kanalının çoklu para birimi ve çoklu zaman çerçevesi göstergesi. Piyasanın mevcut yönünü görüntüler. Panelde, doğrusal regresyon kanalının seviyelerindeki kırılmaları ve dokunuşları (fiyata göre) görebilirsiniz. Parametrelerde istediğiniz para birimini ve zaman dilimini belirtebilirsiniz. Ayrıca gösterge, seviyelere dokunulduğunda bildirim gönderebilir. Bir hücreye tıkladığınızda bu simge ve nokta açılacaktır. Bu MTF Tarayıcıdır. Kontrol panelini grafikten gizlemenin anahtarı va
Fibo Bands
Igor Semyonov
5 (1)
Fibo Bands is an innovative indicator and an analyzer for trading in the current trend direction. The indicator builds a Fibonacci channel (bands), and consists of a trend line (middle line), channel bands, colored bars and reference information. After completion of the current bar, the trend line, the channel and the color of the bar are not redrawn. However, the channel width can be changed after a reset or restart of the indicator depending on volatility. The channel is built in accordance wi
The Baseline Balance tool shows multiple pivot lines for short, mid and long time market cycles. Thus trader can easy identify local or global S/R (support/resistance) levels for better timing of investments and entries to the market. Due to the multifunctional menu directly on chart the settings is fast and accurate. Pivot lines are generated for H1, H4, Daily, Weekly, Monthly, Yearly timeshares. Menu on chart shows following settings: Line Display Settings Middle_Lines – shows middle calculati
Bu, bir mumun kapanış fiyatını tahmin eden bir göstergedir. Gösterge öncelikle D1 çizelgelerinde kullanılmak üzere tasarlanmıştır. Bu gösterge hem geleneksel forex ticareti hem de ikili opsiyon ticareti için uygundur. Gösterge, bağımsız bir ticaret sistemi olarak kullanılabilir veya mevcut ticaret sisteminize ek olarak hareket edebilir. Bu gösterge, mevcut mumu analiz ederek mumun gövdesi içindeki belirli güç faktörlerini ve önceki mumun parametrelerini hesaplar. Böylece gösterge, piyasa hareket
Royal Dutch Skunk
Sayan Vandenhout
ROYAL DUTCH SKUNK USES THE TREND WAVE INDICATOR AND IT CAN IDENTIFY THE BEGINNING AND THE END OF A NEW WAVE TREND MOVEMENT. AS AN OSCILLATOR, THE INDICATOR IDENTIFIES THE OVERBOUGHT AND OVERSOLD ZONES. IT WORKS GREAT TO CATCH THE SHORT TERM PRICE REVERSALS AND USES A MARTINGALE STRATEGY TO CLOSE ALL TRADES IN PROFIT. USE DEFAULT SETTINGS ON H1 OR HIGHER TIME FRAME ON ANY PAIR FOR MORE ACCURATE TRADES WHY THIS EA : Smart entries calculated by 6 great strategies The EA can be run on even a $20000
FIBOChannels
Hafis Mohamed Yacine
Fibonacci Channel What is a Fibonacci Channel? The Fibonacci channel is a technical analysis tool that is used to estimate support and resistance levels based on the Fibonacci numbers. It is a variation of the Fibonacci retracement tool, except with the channel the lines run diagonally rather than horizontally. It can be applied to both short-term and long-term trends, as well as to uptrend and downtrends. Lines are drawn at 23.6, 38.2, 50, 61.8, 78.6, 100, 161.8, 200, 261.8, 361.8 and 423.6 p
The Transition Trend indicator shows the points of potential market reversal. The indicator's smart algorithm detects the trend, filters out market noise and generates entry signals and exit levels. Simple, visual and efficient trend detection. Uses just one parameter for settings. The indicator does not redraw and does not lag. You can set up message alerts as sound or email. Works on all currency pairs and all timeframes. Ready-made trading system.
Voenix
Lorentzos Roussos
4.58 (12)
Harmonik desen tarayıcı ve tüccar. Bazı Grafik desenleri de Dahil edilen desenler: ABCD deseni Gartley deseni yarasa deseni şifre deseni 3Sürücü deseni Siyah Kuğu deseni Beyaz Kuğu deseni Quasimodo deseni veya Üzeri Alt deseni Alternatif Yarasa deseni kelebek deseni Derin Yengeç deseni Yengeç deseni Köpekbalığı deseni FiveO deseni baş ve omuzlar desen Artan Üçgen deseni bir iki üç desen Ve 8 özel desen Voenix, 25 çizelge ve fibonacci modelini destekleyen çok zaman dilimli ve çok çiftli bir harm
SWING DETECTOR WITH RSI AND FIBONACCI Structural Swing Points + Fibonacci Retracement + RSI Overlay -------------------------------------------------- FREE INDICATOR Identify swings. See Fibonacci levels. Check RSI. All in one free indicator. -------------------------------------------------- WHAT THIS INDICATOR DOES This indicator automatically detects structural swing highs and lows using configurable depth and deviation filtering. It connects swings with trend lines, overlays standard
FREE
Power Flow Binary
Ganesh Tanaji Lohar
POWER FLOW PRO — Binary Options Edition For the first time ever, the POWER FLOW PRO cumulative dominance logic is specially optimized for Binary Options trading. POWER FLOW PRO is a smart real-time pressure-flow indicator designed to detect aggressive market momentum and short-term directional dominance for fast Binary Options entries. The system analyzes: Real-time buying pressure Real-time selling pressure Momentum candle strength Cumulative dominance flow Continuation pressure to generate hig
-- Basit ama etkili. Tersine Dönüş Göstergesi - Nedir? SuperTrend mantığını üstel eğri teknolojisiyle birleştiren, trendi takip eden bir üst katman göstergesidir. Trend yönünü algılar, grafikte dinamik bir kanal çizer ve trend tersine döndüğünde gerçek zamanlı uyarılar gönderir. Nasıl çalışır? Gösterge, ATR ve SuperTrend faktörünü kullanarak üstel bir temel çizgi hesaplar. Fiyat bu temel çizginin üzerinde veya altında kapandığında, trendin tersine döndüğü teyit edilir. Yeşil ok, AL trendinin
FREE
Ultimate Supply Demand
Ramon Sobrevals Arce
5 (3)
After working during many months, with the help of Neural Networks, we have perfected the ultimate tool you are going to need for identifying key price levels (Supports and Resistances) and Supply and Demand zones. Perfectly suitable to trigger your trades, set up your future actions, decide your Take Profit and Stop Loss levels, and confirm the market direction. Price will always move between those levels, bouncing or breaking; from one zone to another, all the remaining movements are just mark
Bu ürünün alıcıları ayrıca şunları da satın alıyor
Currency Strength Wizard , başarılı ticaret için size hepsi bir arada çözüm sağlayan çok güçlü bir göstergedir. Gösterge, birden çok zaman dilimindeki tüm para birimlerinin verilerini kullanarak şu veya bu forex çiftinin gücünü hesaplar. Bu veriler, şu veya bu para biriminin gücünü görmek için kullanabileceğiniz, kullanımı kolay para birimi endeksi ve para birimi güç hatları biçiminde temsil edilir. İhtiyacınız olan tek şey, işlem yapmak istediğiniz tabloya göstergeyi eklemektir ve gösterge size
Trend SniperX MT4
Sarvarbek Abduvoxobov
5 (6)
Trend Sniper X , işlemcilerin trend yönünü ve olası dönüş noktalarını netlik ve hassasiyetle belirlemelerine yardımcı olan MetaTrader 5 için çoklu zaman dilimli bir trend takip göstergesidir. MT5 İçin: https://www.mql5.com/en/market/product/181101 Fiyat Bilgisi: Mevcut fiyat tanıtım amaçlıdır ve gelecek güncellemeler ile yeni özellikler eklendikçe değişebilir. Code2Profit Kanalı Çoklu Zaman Dilimi Analizi ile Piyasaya Hakim Olun! Trend Sniper X ile Kazanma Oranınızı Nasıl En Üst Düzeye Çıkarırsı
M1 Sniper
Oleg Rodin
4.97 (30)
M1 SNIPER kullanımı kolay bir işlem göstergesi sistemidir. M1 zaman dilimi için tasarlanmış bir ok göstergesidir. Gösterge, M1 zaman diliminde scalping için bağımsız bir sistem olarak kullanılabilir ve mevcut işlem sisteminizin bir parçası olarak kullanılabilir. Bu işlem sistemi özellikle M1'de işlem yapmak için tasarlanmış olsa da, diğer zaman dilimleriyle de kullanılabilir. Başlangıçta bu yöntemi XAUUSD ve BTCUSD ticareti için tasarladım. Ancak bu yöntemi diğer piyasalarda işlem yaparken de ya
Smart Trend Trading System, trend bilgilerini, giriş ve çıkış sinyallerini ve fiyat seviyelerini tek bir grafikte birleştiren bir MetaTrader 4 göstergesidir. Trend tespiti, dönüş bölgeleri, Smart Cloud, trailing stop mantığı, destek ve direnç, mum renklendirme, uyarılar ve çoklu zaman dilimi analizi dahil olmak üzere 10’dan fazla trading aracını tek bir sistemde birleştirir. Sistem, farklı piyasa koşullarında işlem yapmanıza yardımcı olmak için tasarlanmıştır: Trend piyasaları: Ana trendi belir
SIO Oscillator: Kendi Kendini Optimize Eden Yarı Varyans Dengesizlik Osilatörü İndikatörü satın alın, ona dayalı Uzman Danışmanı (EA) ÜCRETSİZ edinin. Çoğu osilatör, tüm fiyat hareketlerini aynı şekilde değerlendirir. SIO ise yükseliş ve düşüş baskısını birbirinden ayırır ve aralarındaki dengesizliği ölçerek piyasayı gerçekte kimin kontrol ettiğini gösterir: alıcılar mı, satıcılar mı. Dengesizlik bir uç noktaya ulaştığında SIO, giriş, Stop Loss ve Take Profit seviyeleriyle birlikte net bir sinya
Liquidity Scalper System: gösterge formatında likiditeye dayalı bir işlem sistemi. Çoğu gösterge yalnızca bir ok gösterir; sonrasında stopun nereye konacağına, hedefin nerede olduğuna ve sinyale güvenilip güvenilmeyeceğine trader kendisi karar verir. Liquidity Scalper System işlemin tüm döngüsünü kapsar: likidite havuzlarını bulur, kırılımlarında sinyal verir, Entry, Stop Loss ve üç hedefi anında hesaplar, panelde ise istatistikleri ve yeni veriler üzerindeki doğrulama sonuçlarını gösterir. Sis
Gann Made Easy
Oleg Rodin
4.84 (174)
Gann Made Easy , bay teorisini kullanarak ticaretin en iyi ilkelerine dayanan, profesyonel ve kullanımı kolay bir Forex ticaret sistemidir. WD Gann. Gösterge, Zararı Durdur ve Kâr Al Seviyeleri dahil olmak üzere doğru SATIN AL ve SAT sinyalleri sağlar. PUSH bildirimlerini kullanarak hareket halindeyken bile işlem yapabilirsiniz. Satın alma işleminden sonra, alım satım talimatlarını ve harika ek göstergeleri ücretsiz olarak almak için lütfen benimle iletişime geçin! Muhtemelen Gann ticaret yöntem
Advanced Supply Demand
Bernhard Schweigert
4.91 (302)
Özel Ticaret –%30 İndirim Yeni Başlayanlar veya Uzman Yatırımcılar İçin En İyi Çözüm! Bu gösterge, bir dizi özel özellik ve yeni bir formül içerdiği için benzersiz, yüksek kaliteli ve uygun fiyatlı bir işlem aracıdır. Bu güncelleme ile çift zaman dilimi bölgeleri gösterebileceksiniz. Sadece daha yüksek bir zaman dilimini değil, hem grafik zaman dilimini hem de daha yüksek zaman dilimini gösterebileceksiniz: İÇ İÇE GEÇMİŞ BÖLGELER GÖSTERİYOR. Tüm Arz Talep yatırımcıları buna bayılacak. :) Önem
Şu anda %30 İNDİRİMLİ! Herhangi bir Acemi veya Uzman Tüccar için En İyi Çözüm! Bu gösterge paneli yazılımı 28 döviz çifti üzerinde çalışıyor. Ana göstergelerimizden 2'sine (Gelişmiş Para Birimi Gücü 28 ve Gelişmiş Para Birimi Dürtüsü) dayanmaktadır. Tüm Forex piyasasına harika bir genel bakış sağlar. Gelişmiş Para Birimi Gücü değerlerini, para birimi hareket hızını ve tüm (9) zaman dilimlerinde 28 Forex çifti için sinyalleri gösterir. Trendleri ve / veya scalping fırsatlarını belirlemek için
This is a professional chart indicator designed for traders focused on stability and clear price action. It helps filter market noise and provides clear visual entry and exit zones for your trading decisions. Price Information: The current price is promotional and is subject to change as upcoming updates and new features are released. MQL5 public channel:  CLICK HERE for MT5:  Non-repainting MT5 version Core Features: Strictly Non-Repainting: The system is built with strict non-repaint logic. W
Scalper Vault
Oleg Rodin
4.9 (41)
Scalper Vault, gün içi işlemlerde istikrar yakalamak isteyen yatırımcılar için tasarlanmış, güçlü ve tam donanımlı bir alım satım sistemidir. Bu yüksek hassasiyetli gösterge; hem Forex hem de İkili Opsiyon yatırımcıları için kurumsal düzeyde analizler sunan, bağımsız ve eksiksiz bir alım satım sistemi işlevi görür. SATIN ALIM İŞLEMİNDEN SONRA BENİMLE İLETİŞİME GEÇİN; ALIM SATIM İPUÇLARIMI VE HARİKA BİR BONUSU ALIN! Tahmin yürütme zorunluluğunu ve karmaşık manuel analiz süreçlerini ortadan kaldır
Sizlere ON Trade Waves Patterns Harmonic Elliot Wolfe'u tanıtmaktan mutluluk duyarız. Bu, manuel ve otomatik yöntemleri kullanarak piyasada çeşitli desenleri tespit etmek için tasarlanmış gelişmiş bir göstergedir. İşte nasıl çalıştığı: Harmonik Desenler: Bu gösterge, grafiğinizde görünen harmonik desenleri tanımlayabilir. Bu desenler, Scott Carney'in "Harmonic Trading vol 1 & 2" adlı kitabında açıklandığı gibi harmonik ticaret teorisini uygulayan tüccarlar için önemlidir. Onları manuel olarak ç
RFI levels PRO
Roman Podpora
5 (2)
Bu gösterge, fiyat dönüş noktalarını ve fiyat geri dönüş bölgelerini doğru bir şekilde gösterir.       Başlıca oyuncular   . Yeni trendlerin nerede oluştuğunu görüyorsunuz ve her işlem üzerinde kontrolü elinizde tutarak, azami hassasiyetle kararlar alıyorsunuz. TREND LINES PRO   göstergesiyle birlikte kullanıldığında maksimum potansiyelini ortaya koyar.  VERSION MT5 Göstergenin gösterdiği şey: Yeni bir trendin başlangıcında aktivasyonla birlikte tersine dönüş yapıları ve tersine dönüş seviyeler
Zoryk Gold mt4
Reda El Koutbane
5 (4)
ZORYK — MetaTrader 4 için gelişmiş XAUUSD sinyal ve işlem planlama sistemi Bu durumu muhtemelen daha önce yaşadınız. Altını analiz edersiniz, giriş için beklersiniz ve sonunda işlemi açarsınız. Fiyat hemen ters yönde hareket eder. Çok erken kapatırsınız, Stop Loss seviyesini değiştirirsiniz veya birkaç saniye tereddüt edersiniz. Kısa süre sonra piyasa, siz işlemde değilken başlangıçta beklediğiniz yöne ve hedefe ulaşır. Sorun her zaman yön değildi. Asıl sorun belirsizlikti. Tam olarak nere
ShapeRadar - klasik grafik formasyonu göstergesi ShapeRadar, teknik analizin klasik formasyonlarını grafik üzerinde otomatik olarak bulur: çift ve üçlü tepe ve dipler, Omuz-Baş-Omuz ve ters versiyonu, yükselen ve alçalan kamalar, dikdörtgenler, üçgenler, bayraklar ve flamalar. Fiyat bir formasyonun sınırının ötesinde kapandığında gösterge formasyonu, giriş noktasını, zarar durdur seviyesini ve hedefi çizer; bilgi paneli de tespit edilen tüm formasyonları özetler. MetaTrader 5 sürümü:  https://ww
PRO Renko Sistemi, RENKO grafikleri ticareti için özel olarak tasarlanmış son derece hassas bir ticaret sistemidir. Bu, çeşitli ticaret araçlarına uygulanabilen evrensel bir sistemdir. Sistemi etkin piyasa sana doğru ters sinyallerine erişim hakkı denilen ses nötralize eder. Göstergenin kullanımı çok kolaydır ve sinyal üretiminden sorumlu tek bir parametreye sahiptir. Aracı, seçtiğiniz herhangi bir ticaret aracına ve renko çubuğunun boyutuna kolayca uyarlayabilirsiniz. Yazılımımla karlı bir
SR Liquidity
Oleg Rodin
5 (3)
SR Liquidity , piyasa likiditesinin yoğunlaştığı ve fiyatın en güçlü tepkiyi verdiği gizli bölgeleri ortaya çıkarmak için tasarlanmış bir alım-satım göstergesidir. Bu özel likidite alanları güçlü destek ve direnç seviyeleri işlevi görerek, piyasanın yön değiştirme ihtimalinin en yüksek olduğu yerlere dair size net bir harita sunar. SR Liquidity, sıradan Destek/Direnç çizgileri çizmek yerine, alım ve satım baskısının yoğunlaştığı bölgeleri tespit etmek için gerçek fiyat hareketlerini analiz eder.
Auto Optimized SpeedAngle , sürekli İleriye Dönük Optimizasyon (Walk-Forward Optimization, WFO) yoluyla eğri uydurmayı (curve-fitting) ortadan kaldıran kurumsal düzeyde bir momentum vektörleme sistemidir. Piyasa rejimleri değiştiğinde etkinliğini yitiren statik girdilere güvenmek yerine, gösterge, örneklem dışı (Out-of-Sample, OOS) doğrulama kullanarak parametrelerini dinamik olarak yeniden kalibre eder ve böylece gösterilen sinyallerin geçmişteki rastgele anomalileri değil, gerçek bir istatisti
Professional Volume Profile An indicator for MetaTrader 4 that builds a horizontal Volume Profile directly on the price chart. It shows the levels where traders executed the most trades, helping to identify support/resistance zones and assess the balance of power in the market. What the Indicator Displays POC (Point of Control) — the level with the maximum trading volume (red line). VAH / VAL (Value Area High / Low) — the upper and lower boundaries of the value area, where 70% of the volume was
Italo Volume Indicator
Italo Santana Gomes
4.92 (79)
BUY INDICATOR AND GET EA FOR FREE AS A BONUS + SOME OTHER GIFTS! ITALO VOLUME INDICATOR  is the best volume indicator ever created, and why is that? The Indicator works on all time-frames and assets, indicator built after 7 years of experience on forex and many other markets. You know many volume indicators around the internet are not complete, does not help, and it's difficult to trade, but the Italo Volume Indicator is different , the Italo Volume Indicator shows the wave volume, when market
Gelişmiş matematiksel hesaplamalara dayanarak en olası kısa vadeli fiyat hareketini tahmin eder. Özellikler Grafiğin zaman diliminde ve tüm üst zaman dilimlerinde yakın fiyat hareketinin tahmini; Piyasanın gerçek trendinin hesaplanması; En önemli destek ve direnç seviyelerinin hesaplanması; Sıkışma bölgeleri, seviye kesişimleri ve trend değişimleri için uyarılar; Sistem kaynaklarını az kullanır: çizgiler ve panel yalnızca bir değer değiştiğinde güncellenir; Kendi kendini ayarlar: her sembolde v
Atomic Analyst
Issam Kassas
5 (14)
Atomic Analyst — MetaTrader 4 Ürün soruları, kurulum rehberliği veya teknik destek için bana doğrudan MQL5 üzerinden mesaj gönderin. İndikatör, karmaşık piyasa hesaplamalarını basit görsel sinyallere, renk kodlu mumlara, trend okumalarına, stop-loss seviyelerine ve traderların hızlıca anlayıp gerçek piyasa koşullarında kullanabileceği çoklu take-profit bölgelerine dönüştürür. Ana trading kullanım alanları: Scalping ve gün içi işlem: Hızlı karar alma, net oklar, uyarılar, mum renkleri ve yapılan
Scalping Entry Points - fiyat hareketlerine uyum sağlayabilen ve yeniden çizmeden alım satımları açmak için sinyaller verebilen manuel bir alım satım sistemidir. Gösterge, merkezi destek ve direnç seviyesine göre trendin yönünü belirler. Nokta göstergesi, girişler ve çıkışlar için sinyaller sağlar. Manuel gün içi ticaret, ölçeklendirme ve ikili opsiyonlar için uygundur. Tüm zaman dilimlerinde ve ticaret enstrümanlarında çalışır. Gösterge birkaç türde uyarı verir. ürün nasıl kullanılır Mavi çiz
All in One package includes the  Oscillator Predictor ,  MACD Predictor ,  Thrust Scanner  and  Advanced Fibonacci  indicators which are mandatory for applying  Dinapoli  trade plans.  Please visit below links for detailed explanations of indicators. Advanced Fibonacci Indicator =>  https://www.mql5.com/en/market/product/52834 Thrust Scanner Indicator => https://www.mql5.com/en/market/product/52830 Overbought /Oversold Predictor indicator => https://www.mql5.com/en/market/product/52621 Macd P
True Direction Oscillator
Muhammad Elbermawi
4.85 (364)
Veya "Saf Momentum " ilkesini kullanarak fiyat değişim oranını ölçen bir endeks olan (TDO). Bir menkul kıymet fiyatı 10'dan 15'e yükseldiğinde, fiyat değişim oranı %150'dir, ancak 15'ten 10'a düştüğünde, fiyat değişim oranı sadece %33.3'tür. Bu nedenle, "Fiyat Değişim Oranı" (ROC) veya "Momentum" gibi teknik analiz göstergeleri, artan fiyat hareketleri için azalan hareketlere göre daha yüksek değerler verir. TDO, yatırımcıların momentumu doğru okumalarına yardımcı olmak için bu sorunu düzeltir.
Quantum Imbalance Profiles , denge ve dengesizlik evrelerini gösteren bir göstergedir. Piyasanın hangi fiyatlarda hacim işlem gördüğünü, bu bölgede hangi tarafın baskın olduğunu ve fiyatın ardından hangi seviyeler üzerinden impulsla genişlediğini gösterir. Klasik hacim profili tek bir soruyu yanıtlar: işlemler nerede gerçekleşti. Her fiyatta hangi tarafın baskın olduğunu, yatay seyrin nasıl sonuçlandığını ve piyasanın hangi yöne çıktığını göstermez. Quantum Imbalance Profiles profili Volume Bid/
Forex için manuel ticaret ve teknik analiz göstergesi. İşlem gününün açılış seviyesini gösteren bir trend göstergesi ve giriş noktalarını belirlemek için bir ok göstergesinden oluşur. Gösterge yeniden renklenmez; mum kapandığında çalışır. Sinyal okları için çeşitli uyarı türleri içerir. Herhangi bir grafikte, alım satım aracında veya zaman diliminde çalışacak şekilde yapılandırılabilir. Çalışma stratejisi trend boyunca fiyat hareketlerini aramaya dayanmaktadır.  " Buy " işlemleri yapabilmek
Currency Strength Matrix
Raymond Gilmour
4.5 (26)
THE ONLY CURRENCY STRENGTH INDICATOR BUILT ON PRICE ACTION Most currency strength meters average an oscillator, or measure how far price has travelled. But these are not accurate measures of trend, Currency Strength Matrix measures trend strength, not just if a currency price has gone up or down. Currency Strength Matrix reads market structure . For each of the 28 major pairs it finds the confirmed cycle highs and lows, and decides whether that pair is in an uptrend, a downtrend, or neither. A
Dark Support Resistance  is an Indicator for intraday trading. This Indicator is programmed to identify  Support and Resistance Lines , providing a high level of accuracy and reliability. Key benefits Easily visible lines Only the most important levels will be displayed Automated adjustment for each timeframe and instrument Easy to use even for beginners Never repaints, never backpaints, Not Lag 100% compatible with Expert Advisor development All types of alerts available: Pop-up, Email, Push
ŞU ANDA %40 INDIRIMLI !!! Yeni Başlayanlar veya Uzman Tüccarlar için En İyi Çözüm! Bu gösterge benzersiz, yüksek kaliteli ve uygun fiyatlı bir ticaret aracıdır çünkü bir dizi tescilli özellik ve gizli bir formül ekledik. Yalnızca BİR grafikle 28 döviz çiftinin tümü için Uyarılar verir. Yeni bir trendin veya scalping fırsatının tam tetik noktasını belirleyebildiğiniz için ticaretinizin nasıl gelişeceğini hayal edin! Yeni temel algoritmalar üzerine inşa edilen bu sistem, potansiyel işlemlerin
Yazarın diğer ürünleri
Flat Session Statistics is a statistics panel for MetaTrader 4. It does not generate buy or sell signals. It aggregates the past bars of the symbol it is attached to and shows how often a defined event was followed by a defined outcome — as a conditional frequency with its sample size (N) and a Wilson 95% confidence interval on every line. Statistics (14 items, closed sessions only): - Baseline green rate (sessions closing above their open) - Gap fill rate (all / up / down) and gap-and-go hold r
Flat Flag Patterns automatically detects and draws flag and pennant continuation patterns on your MT4 chart. It looks for a strong one-way move (the pole) followed by a small consolidation (the flag), and draws the pole line, the flag zone, a label and arrows directly on the chart. Detection is normalised by volatility (ATR), so the same yardstick applies across symbols and timeframes. For the pole it also checks that the move was clean and one-directional — choppy two-way action does not count
Horizon Quad-Compass MT4 — 4 indicators x 3 timeframes x up to 12 symbols on one dashboard Horizon Quad-Compass is a multi-timeframe, multi-symbol monitoring indicator for MetaTrader 4. It reads four widely used indicators — MA, Stochastic, MACD and ADX — on three timeframes for up to 12 symbols at once, and shows each symbol's direction as dots on a single dashboard, so you can see which symbols are aligned and which timeframe is breaking down without switching between charts. Direction at a gl
Overview FlatStochasticCycle is a signal indicator for MetaTrader 4 that reads three Stochastics with different periods as overlapping "cycles". A cross of the short Stochastic is the trigger, and the mid and long Stochastics (position against level 50) filter the situation. OsMA checks momentum and ADX checks trend strength; each filter can be switched ON/OFF individually. All judgements are made on closed bars, so signals do not repaint. This indicator does not place orders by itself. Main fea
Overview Flat10-Trend Bias Panel is a multi-symbol bias monitor for MetaTrader 5. It watches 9 symbols (EURUSD, GBPUSD, USDJPY, AUDUSD, NZDUSD, USDCAD, USDCHF, EURJPY and GOLD) and judges the trend bias of each symbol from four technical votes: moving average alignment, ADX, MACD and RSI. When all four votes agree, the symbol is treated as having a strong bias. The panel also draws entry-timing arrows for the chart symbol. This indicator does not place orders by itself. Main features Each watche
Overview FlatAutoFibonacci is an automatic Fibonacci indicator for MetaTrader 5. It detects swing highs and lows and draws Fibonacci retracement levels automatically, and in addition it watches for reversal bars near the levels and draws counter-trend entry signals. A second Fibonacci projection provides take-profit and stop-loss reference lines, and a statistics panel shows a win-rate simulation of the signals. This indicator does not place orders by itself. Main features Fibonacci retracement
Overview FlatFibonacciWave is a two-stage Fibonacci indicator for MetaTrader 5. It detects the latest swing and draws two-stage Fibonacci levels automatically, with a price table and a movable dashboard. In addition to the level display, it provides linkage event buffers and alerts when price reaches a level. This indicator does not place orders by itself. Main features Two-stage Fibonacci levels are drawn automatically from the detected swing Linkage event buffers for external tools (buffer 2 =
Overview FlatFibonacciCluster is a multi-timeframe Fibonacci overlap map for MetaTrader 5. It draws Fibonacci retracement levels from six timeframes (M15, M30, H1, H4, D1 and W1) on one chart, and highlights the price bands where levels from different timeframes overlap within a tolerance. The more levels overlap in a band, the more timeframes share a level near that price. This indicator does not place orders by itself. Main features Levels are drawn as bands, and each band's end label shows it
Overview FlatStochasticCycle is a signal indicator for MetaTrader 5 that reads three Stochastics with different periods as overlapping "cycles". A cross of the short Stochastic is the trigger, and the mid and long Stochastics (position against level 50) filter the situation. OsMA checks momentum and ADX checks trend strength; each filter can be switched ON/OFF individually. All judgements are made on closed bars, so signals do not repaint. This indicator does not place orders by itself. Main fea
Horizon Trend Matrix is a matrix-style dashboard indicator for MetaTrader 5. It judges the trend of one symbol across three timeframes (H1, M15, M5) using a single selectable moving average method, and shows the result as a compact matrix together with signal arrows on the chart. Main features 12 moving average types to choose from, including SMA, EMA, RMA and ALMA Each dashboard cell shows the deviation rate (%) of the price from the moving average, color-coded by direction Signal arrows appear
Overview Horizon MACD Radar is a radar-style dashboard indicator for MetaTrader 5. It monitors MACD-based signals across multiple symbols and timeframes at a glance, and shows signal arrows on the chart so you can spot where momentum is turning without opening many charts. Main features Signal mode can be switched from the parameters: MACD cross mode or OsMA mode The selected mode is saved per chart and shown on the dashboard All signals are evaluated on closed bars only, so displayed signals do
Overview Horizon Quad-Compass is a compass-style dashboard indicator for MetaTrader 5. For each symbol, it lays out four oscillators (moving average, stochastic, MACD and ADX) against three timeframes (H1, M15 and M5) as a grid of dots in a subwindow, so trend and momentum conditions can be compared at a glance. Main features Dashboard in a subwindow: rows are the four oscillators (MA, Stochastic, MACD, ADX) and columns are the timeframes (H1, M15, M5) Clicking a timeframe header button opens th
Overview Horizon Pulse is a multi-symbol matrix dashboard indicator for MetaTrader 5. It watches up to 40 symbols across 4 timeframes in a single matrix, and also ranks the strength of the 8 major currencies numerically, so you can grasp the whole market's direction from one panel. Main features Matrix view of up to 40 symbols x 4 timeframes Currency strength ranking for the 8 major currencies, shown as numeric values Signal Mode can be selected from the parameters: MA Order or MACD Cross All ev
Overview Horizon Prime Consensus is a consensus-style dashboard indicator for MetaTrader 5. It combines the judgments of multiple technical indicators into one consensus view for each symbol across three timeframes (M5, M15 and H1), and draws signal arrows on the main price chart when the consensus points to an entry direction. Main features Consensus view across three timeframes: M5, M15 and H1 Signal arrows are drawn on the main price chart, not only inside the panel Signal mode can be selecte
Overview Horizon Expanded Signal is an entry signal indicator for MetaTrader 5. It checks whether five technical indicators (SMA, ADX, CCI, Parabolic SAR and Momentum) are aligned in the same direction, and only when the completed higher-timeframe trend agrees, it draws an entry signal together with suggested stop-loss and take-profit levels on the chart. It is designed and verified primarily for GOLD on the 15-minute timeframe. This indicator does not place orders by itself. Main features Align
Overview Horizon Combo Signal is an entry signal indicator for MetaTrader 5. It watches whether multiple technical conditions are aligned in the same direction, and when a new alignment is completed it draws an entry signal on the chart together with stop-loss and take-profit reference lines. The recommended setting is GOLD on the 1-hour timeframe. This indicator does not place orders by itself. Main features Entry arrows appear only when the alignment is newly completed, evaluated on closed bar
Four indicators. One agreement. One signal. Horizon Trend Combo Signal is a trend signal indicator built exclusively for GOLD (XAUUSD) on the H3 (180-minute) chart. It fires an entry signal only when all four of its components point in the same direction: Supertrend (factor 3.0, ATR 10) - trend direction Ichimoku Kinko Hyo (9, 26, 52) - price vs. cloud plus Tenkan/Kijun OsMA - MACD (12, 26, 9) histogram sign Aroon (14) - strength of the most recent high/low When the last component joins the othe
Horizon Agent Brief MT5 is a standalone indicator that briefs AI agents about the chart - and shows the same briefing to you on a movable panel. On every closed bar it writes a structured JSON packet to files (MQL5\Files\Horizon_Agent_Brief by default): the candle anatomy (body, wicks, close position, pattern), the last 5 candles, regime, momentum, volume, swing structure, previous-day levels and VWAP, the score breakdown and the tracked trade state. AI agents and external tools can read the pac
Flat Session Statistics is a statistics panel for MetaTrader 5. It does not generate buy or sell signals. It aggregates the past bars of the symbol it is attached to and shows how often a defined event was followed by a defined outcome — as a conditional frequency with its sample size (N) and a Wilson 95% confidence interval on every line. Statistics (14 items, closed sessions only): Baseline green rate (sessions closing above their open) Gap fill rate (all / up / down) and gap-and-go hold rate
Version 1.102 update: Added a fractal model (C2 / CISD / protected swings), Reclaim Strength (RS) with RS-band survival statistics in the panel, ICT killzones (5 sessions) with previous day/week/month pivots, and ADR/CDR. Each module can be switched on or off individually. The confluence signal (buffer 0 = Buy, 1 = Sell) and its readability from external tools such as Flat Manual Trader are unchanged. Flat SMC Structure Map is a Smart Money Concepts structure indicator for MetaTrader 5. It draws
Flat Volume Profile draws a volume profile on your MT5 chart from tick volume. For each period it builds a price-by-price volume histogram and shows: POC (Point of Control): the price with the highest volume Value Area (VAH / VAL): the range containing 70% of the period volume (adjustable) VWAP for the period, with optional +/-1SD and +/-2SD bands (latest profile) Period modes: Daily, Weekly, Rolling (last N bars) and Anchored (from any start time). Past profiles can be shown as well (default: 5
The signal, the sizing and the exit — in one EA. Horizon Trend Combo EA is a standalone expert advisor for MetaTrader 5, built exclusively for GOLD (XAUUSD) on the H3 (180-minute) chart. The Horizon Trend Combo signal is built into the EA itself: no separate indicator and no other product is required. How it trades The EA watches for the moment when four trend components agree in the same direction: - Supertrend (factor 3.0, ATR 10) — trend direction - Ichimoku Kinko Hyo (9, 26, 52) — price vs.
A standalone MT5 expert advisor for GOLD (XAUUSD) on M5. A regression-slope trend signal filtered by the higher-timeframe trend, long-only, with a 24-hour maximum hold and risk-% lot sizing. Verified on 100% real ticks over 2024-2026. One trend signal, one higher-timeframe check — nothing else. Horizon Gold Trend EA is a standalone expert advisor for MetaTrader 5, built exclusively for GOLD (XAUUSD) on the M5 chart. The signal, the filter, the exits and the lot sizing are all built into the EA i
Flat Reversion Radar is a mean-reversion screener for MetaTrader 5. For up to 12 watch symbols it measures how far each price has stretched away from its own mean, using a least-squares regression centre, residual standard-deviation bands and a z-score, and lists the symbols in a panel sorted by the size of the deviation. For the chart symbol it draws the regression channel: the centre line, the +/-1 sigma bands and the +/-2 sigma bands. The z-score puts every symbol on the same scale, so a curr
Flat Flag Patterns automatically detects and draws flag and pennant continuation patterns on your MT5 chart. It looks for a strong one-way move (the pole) followed by a small consolidation (the flag), and draws the pole line, the flag zone, a label and arrows directly on the chart. Detection is normalised by volatility (ATR), so the same yardstick applies across symbols and timeframes. For the pole it also checks that the move was clean and one-directional — choppy two-way action does not count
Overview Horizon Combo EA is a fully automated Expert Advisor for MetaTrader 5. It watches whether multiple technical conditions are aligned in the same direction, and when a new alignment is completed it opens a position with a stop loss derived from the ATR at that moment and a take profit placed by a risk-reward ratio (default 3.0). The recommended setting is GOLD on the 1-hour timeframe, using the built-in "GOLD 1H Recommended" preset. Position size is calculated from the risk percentage of
Horizon Confluence EA is a fully automated trend-following Expert Advisor for MetaTrader 5. It watches swing direction across several timeframes at once and enters only when the directions come together (confluence). It does not use grid, martingale or averaging-down techniques: every position is opened with a stop loss, and the exit is handled by an ATR-based trailing stop, with an optional partial close. The default settings are tuned for XAUUSD (GOLD) on the M15 chart. The EA trades the symbo
Horizon SMC Suite MT5 — the all-in-one SMC / ICT dashboard One indicator that draws the full Smart Money Concepts map on a single chart: market structure, order blocks, fair value gaps, liquidity, a full volume profile, sessions and killzones — and grades every zone by how many profile elements overlap it. Modules - Market structure: major / internal BOS and CHoCH, HH / HL / LH / LL swing labels, premium / discount bands with equilibrium - Order blocks and fair value gaps (with CE line), includi
What it is Horizon Currency Strength MT5 is a currency strength meter for MetaTrader 5. It computes the relative strength of the 8 major currencies (USD, EUR, GBP, JPY, AUD, NZD, CAD, CHF) from all 28 related pairs and shows them as a 0-100 ranking on a panel in the chart window. It is a display-only indicator: it does not place trades. How the score is calculated For each of the 28 pairs, the indicator measures the price change over a lookback period, normalized by ATR so that pairs with differ
Filtrele:
Değerlendirme yok
Değerlendirmeye yanıt