Flat SMC Structure Map MT4

  • Indicadores
  • Keijinro Mizutani
    Keijinro Mizutani
    Hello, I’m kotoha, a system designer focused on research-driven, rule-based trading tools for the MT5 platform.
    My work centers on market structure analysis, swing dynamics, and Fibonacci-based logic.
  • Versão: 1.1
  • Ativações: 5

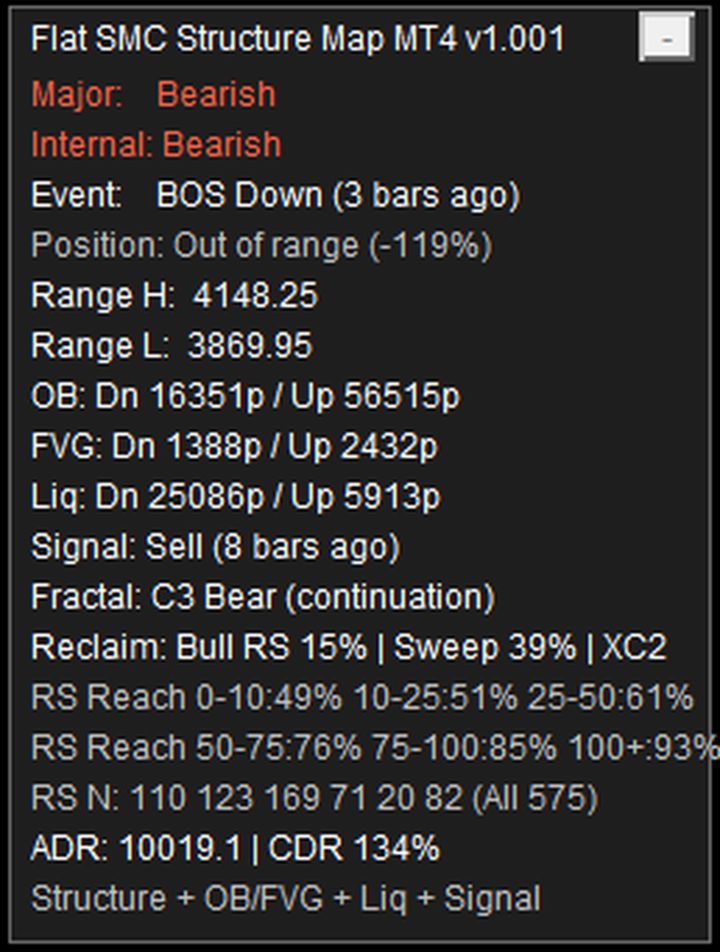
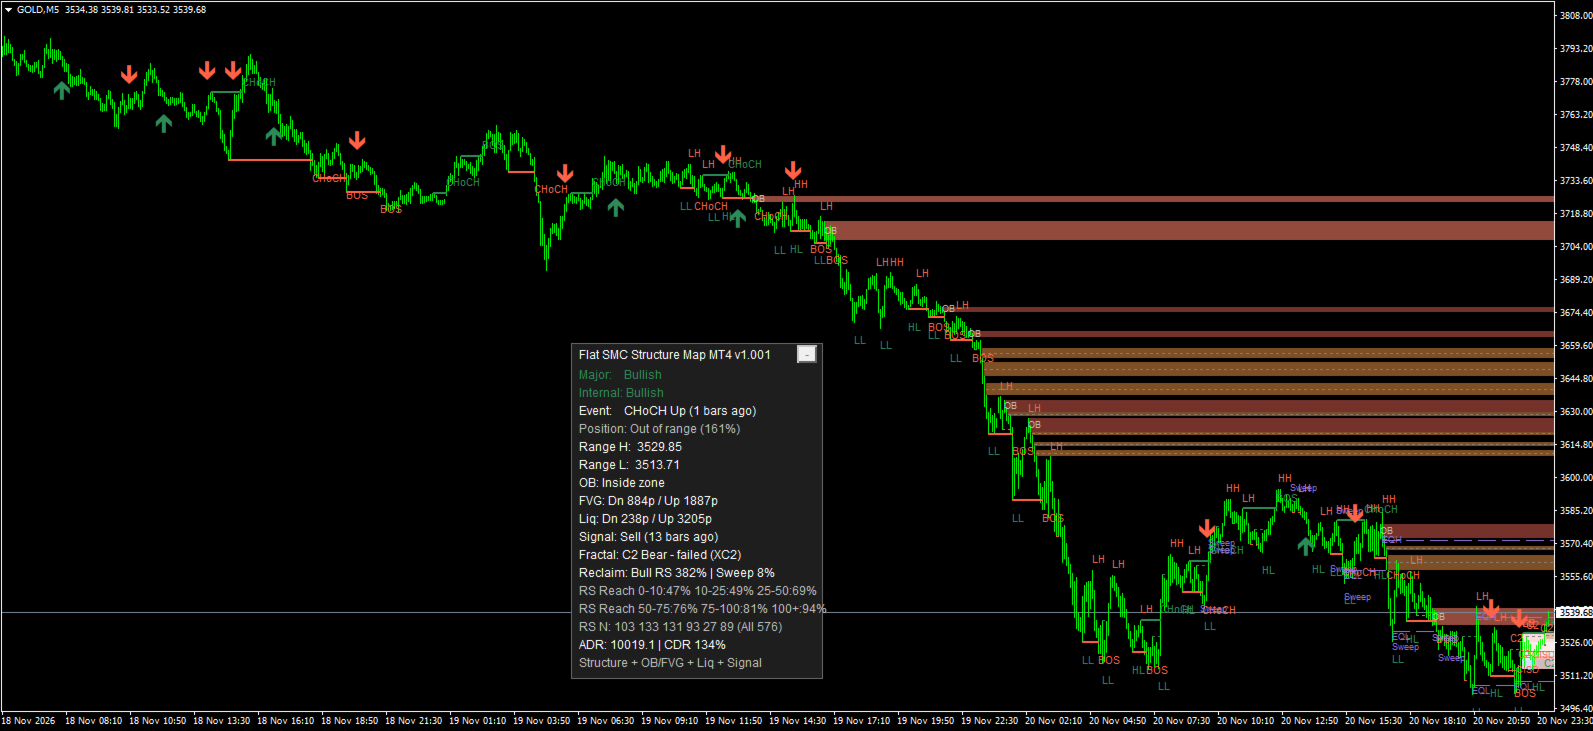
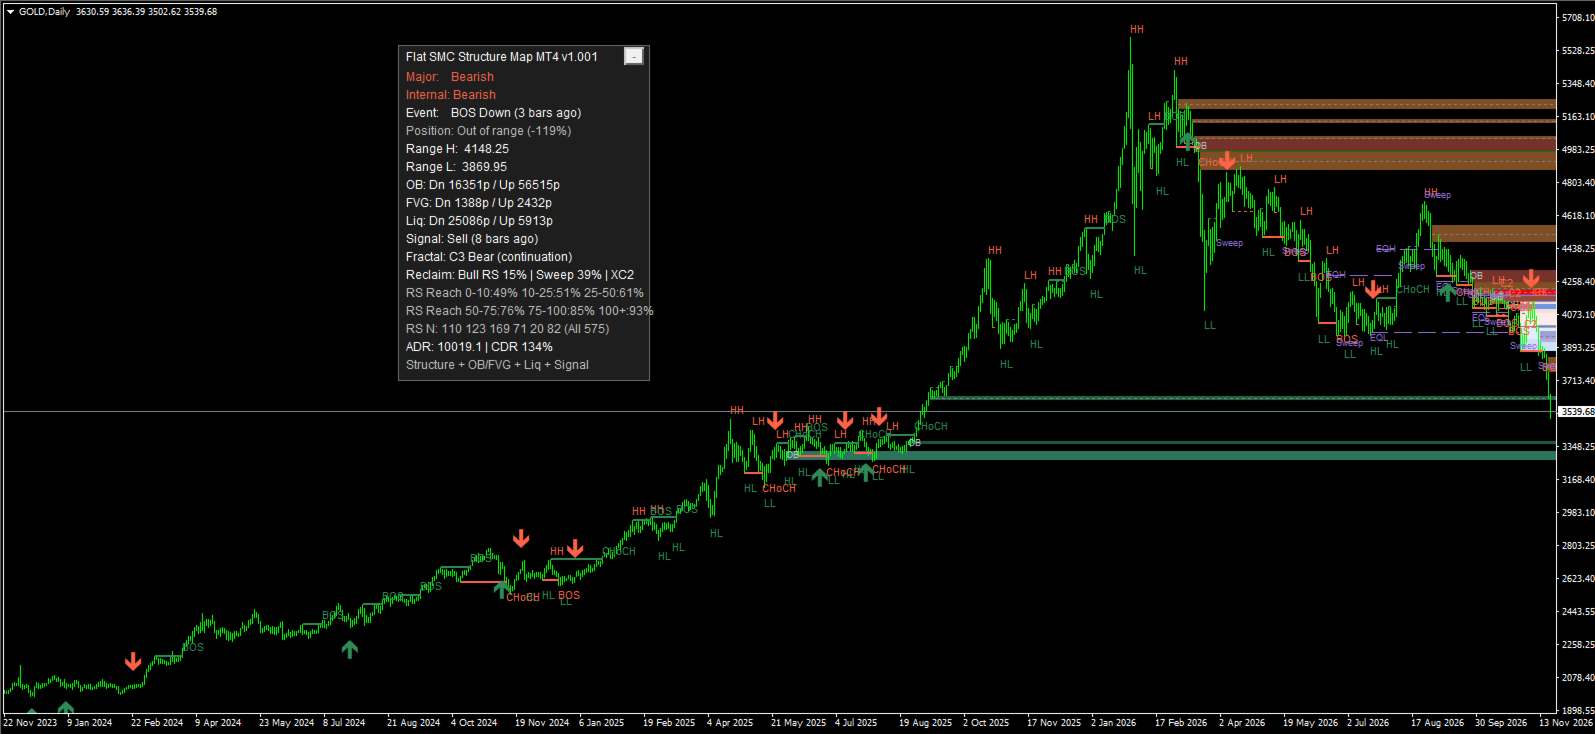
Flat SMC Structure Map is a Smart Money Concepts structure indicator for MetaTrader 4. It draws the market structure on one chart: BOS / CHoCH, order blocks, FVGs, liquidity lines (EQH / EQL) and sweeps, and premium / discount positioning — all judged on closed bars only, so confirmed drawings never repaint.

Structure: two layers — major swings (default left/right 5) for the main flow and internal swings (default 2) for the short-term flow, each labelled HH / HL / LH / LL. A close break in the trend direction is a BOS; the first close break against it is a CHoCH.

Order blocks: the last opposite candle before a major break, kept only when the break bar's body is at least ATR(14) x 0.5 (displacement). Zones are mitigated on touch and invalidated on a close through the far side. FVGs: three-bar gaps of at least ATR x 0.1, with an optional CE (50%) line, removed when fully filled. Drawn zones have a configurable age limit (default 400 bars) so old zones do not clutter the chart; detection itself always uses the full lookback.

Liquidity: swing highs/lows that line up within ATR x 0.15 form EQH / EQL dashed lines. A wick through the line with a close back inside is recorded as a sweep; a close through it ends the line as a break.

Premium / discount: the latest major swing range is split into four bands plus the 50% equilibrium — no Fibonacci ratios, just relative position. The dashboard panel shows both trend layers, the latest event, range high/low and position %, the distance in pips to the nearest order block / FVG / liquidity line, the latest signal, and the state of the additional modules below. The panel can be dragged anywhere; its position is stored per symbol and timeframe.

Confluence signals: a Buy requires discount positioning (below 50%), a recent bullish CHoCH (or a BOS preceded by an internal CHoCH), and a touch of a bullish order block or FVG — the Sell is the mirror image. One signal per event, with a same-direction cooldown. Buffer 0 = Buy, buffer 1 = Sell, edge type: 1.0 on the signal bar only, EMPTY_VALUE otherwise; the buffers can be read at shift 1 via iCustom by other tools and EAs. Please note: this MT4 version has no Flat Manual Trader linkage — the MT4 build of Flat Manual Trader cannot take in external signals, so the FMT combination is available only between the MT5 versions. Optional alerts for BOS/CHoCH, sweeps, signals, CISD confirmations and reclaim setups (all OFF by default).

Additional modules (each can be switched on/off individually; none of them changes the confluence signal definition): a fractal model — C2 (sweep + reclaim bar), CISD (reversal confirmation level), protected swings and C3 (continuation), with a bias filter based on the major structure direction; reclaim strength (RS) — how far a C2 bar recovered relative to the previous bar's range, shown in % with per-band follow-through statistics aggregated on the panel (a summary of past data, not an indication of future results); killzones — the five ICT session boxes (Asia / London / New York AM / London Close / New York PM), off by default; pivots — previous day / week / month high, low, open and midpoint lines, off by default; and ADR / CDR — average daily range and today's consumed portion of it on the panel, with optional ADR level lines.

Works on any symbol and any timeframe. MetaTrader 4 only — it does not run on MetaTrader 5 (the MT5 version is a separate product). This indicator does not place orders.

Disclaimer: This product displays market structure and records confluence signals based on historical and current price data. It is not investment advice, not a prediction, and does not guarantee any future result or profit. Trading involves risk; decisions are your own responsibility.
Produtos recomendados
YK-Fibo Pivot Indicator: Trade Smarter with Fibonacci Pivot Points The YK-Fibo Pivot Indicator is a powerful technical analysis tool that combines the precision of Fibonacci retracements with the insights of Pivot Points. Whether you're a novice or seasoned trader, this indicator empowers you to spot profitable opportunities in the market with ease. Why Choose YK-Fibo Pivot? Pinpoint Support & Resistance: By calculating Fibonacci levels based on the previous day's high, low, and close prices, y
ForexAurum Fibonacci indicator is a useful tool for traders who are using Fibonacci combined with the ZigZag indicators. It uses the real-time calculation of the levels for all the timeframes and displays the results for you. In addition, you can setup RSI, ADX and Stochastic indicators to confirm entries. How to use it Just drag and drop the indicator on an 1 minute chart of any symbol. Then you can switch to a higher timeframe at anytime after the initialization. Recommendation Always drag a
Fibonacci Trend Marker   — is a trend indicator that analyzes the behavior of the current candle relative to the High-Low (HL) range of previous candles using Fibonacci retracement levels. It visually tracks trend strength, signaling potential weakening or reversal through a change in candle color. Features: Designed for trend-focused traders, it helps quickly identify trend changes based on Fibonacci levels. Effective on any timeframe with sufficient market volatility, when a sequence of 3–5 c
Fibonacci strategies EA trades Fibonacci levels. You can choose whether the EA should trade a manually plotted fibonacci or whether it should automatically plot a fibonacci. In automatic fibonacci drawing mode, the EA automatically plots a fibonacci retracement based on the number of bars you select on the BarsToScan setting in the indicator. The fibonacci is automatically updated in real time as new highest and lowest values appears amongst the selected bars. You can select which level values
Master Dot for MetaTrader 4 Detect Volatility Exhaustion Before the Market Returns to Balance Master Dot is a professional non-repainting indicator designed to detect moments when price moves beyond its statistically expected volatility range. These situations often occur during sharp market impulses, liquidity grabs or temporary emotional moves, when price departs from its normal trading conditions. Instead of following trends, Master Dot highlights volatility exhaustion — moments where the mar
This product is a part of  ON Trade Waves Patterns Harmonic Elliot Wolfe you can test free version on EURJPY from this link  Wolf Waves Indicator Descubra as Wolf Waves - Sua Ferramenta de Negociação Definitiva! Você está em busca de uma ferramenta poderosa para identificar facilmente as Wolf Waves em qualquer período de tempo? Não procure mais! Nosso indicador de Wolf Waves faz esse trabalho com facilidade. Veja por que ele é perfeito para você: Recursos Principais: Detecção Automática: Nosso
Classic Fractals indicator for MT4, with additional Trendlines connecting the latest couples of fractals ( fractals are showing highest high, and lowest low on each period) Rules for trendlines: -if new top fractal is below the last one = new resistance line -if new bot fractal is above the last one = new support line -Trendlines can be hidden -Fractals can be hidden Fractal Period = can be both even or uneven number, as it is setting for half (one side) of the bars sequence for findin
NO REPAINT ADVANCED CHART PATTERN INDICATOR By definition, a price ( chart)  pattern is a recognizable configuration of price movement that is identified using a series of  trendlines  and/or curves. When a price pattern signals a change in trend direction, it is known as a reversal pattern; a continuation pattern occurs when the trend continues in its existing direction following a brief pause. Advanced Chart Pattern Tracker is designed to find the MOST ACCURATE patterns. A special script is a
Free automatic Fibonacci is an indicator that automatically plots a Fibonacci retracement based on the number of bars you select on the BarsToScan setting in the indicator. The Fibonacci is automatically updated in real time as new highest and lowest values appears amongst the selected bars. You can select which level values to be displayed in the indicator settings. You can also select the color of the levels thus enabling the trader to be able to attach the indicator several times with differe
FREE
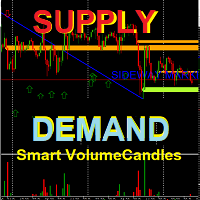
This is a new strategy for SUPPLY DEMAND areas It is based on a calculation using the tick volume to detect the big price action in market for both bear /bull actions this smart volume action candles are used to determine the supply and demand areas prices in between main supply and demand lines indicate sideway market  up arrows will be shown when prices moves above the main supply and the secondary supply lines Down arrows will be shown when prices moves below the main demand and the secondary
EARLY REMINDER: The Starting price is 65 price will rise soon up to 365$ and then 750$ after first 10 copies of sales. Grab this offer now! Introduction Hello, traders! Welcome to the demonstration of the Forex Beast Indicator , a comprehensive tool designed to assist aspiring traders in navigating the complexities of the forex market. This indicator incorporates seven essential components to provide a well-rounded trading experience: Moving Averages Colored Zones Support and Resistance Levels
TriSync MT4
Gabriel Balbino De Oliveira
TriSync — Guia do Usuário Indicador de estrutura de mercado para MetaTrader 4 · versão 0.40 1. O que é O TriSync mostra, em um único gráfico, a estrutura do mercado em camadas: quatro níveis de swing aninhados, VWAP ancorado em topos e fundos de swing, VWAP diário, suportes e resistências vindos de timeframes superiores, o viés (bias) de três timeframes e setas de entrada confirmadas em barra fechada. A ideia central é uma ordem de leitura: Localização primeiro. Contexto depois. Timing por últi
Apex Break PRO é um indicador de rompimento de linhas de tendência por pivôs sem repintura para MetaTrader 4. Ele detecta máximas de pivô e mínimas de pivô, desenha linhas de tendência dinâmicas inclinadas entre pivôs consecutivos e gera sinais de compra e venda quando o preço rompe essas linhas de tendência no fechamento confirmado de um candle. Cada sinal é filtrado por até quatro camadas de confluência independentes — tendência EMA, limites RSI, detecção de pico de volume e força de tendência
Awesome Oscillator by Bill Williams with the ability to fine-tune and replace the averaging algorithms of the indicator, which significantly expands the possibilities of using this oscillator in algorithmic trading and brings it closer in its properties to such an indicator as the MACD. To reduce price noise, the final indicator is processed with an additional Smooth averaging. The indicator has the ability to give alerts, send mail messages and push signals when the direction of movement of th
The correlation coefficient reflects the relationship between two values. It shows the dependence of changes in one value on changes in another. For example, from changes in the price of EURUSD and EURNZD. The correlation coefficient in trade, currency relations is constantly changing. Special indicators of correlation help to define it, trace changes, draw correct conclusions. One of them is the Hubbles Correlator indicator. The indicator allows you to simultaneously display several other char
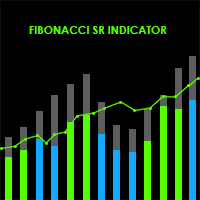
Indicator Fibonacci SR Este indicador cria linhas de suporte e resistência. É baseado nos níveis de Retração e Extensão Fibonacci. Baseado nos níveis Fibonacci, verifica as combinações possíveis e desenha linhas de suporte/resistência. Este indicador também utiliza topos e fundos desenhados pelo indicador ZigZag em seus cálculos. O ZigZag também pode ser desenhado no gráfico, se necessário. O indicador considera muitas combinações de pontos de reversão anteriores e a proporção dos níveis Fibonac
FREE
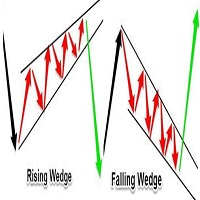
Automatic redrawing of Trend Supports and resistances levels and Possible Wedge pattern formation to indicate price breaking of Rising Wedge (signal SELL) or price breaking of falling Wedge (signal BUY) Very simple and smart indicator  ALERTS AND MOBILE NOTIFICATIONS availavle !!! you can edit the calculation bars of the bars count for formation of the trend lines and the initial shift from current price  Smaller values for bars /shift inputs when using Higher Time frames (D1-H4) and the reverse
Este indicador é um indicador para análise automática de ondas que é perfeito para negociações práticas! Caso... Nota:   Não estou acostumado a usar nomes ocidentais para classificação de ondas. Devido à influência da convenção de nomenclatura de Tang Lun (Tang Zhong Shuo Zen), nomeei a onda básica como   uma caneta   e a banda de onda secundária como   um segmento   . ao mesmo tempo, o segmento tem a direção da tendência.   O segmento de tendência principal   é nomeado (esse método de nomencl
Indicador multimoeda e multitimeframe do Canal de Desvio Padrão. Exibe a direção atual do mercado. No painel você pode ver rompimentos e toques (por preço) dos níveis do canal de regressão linear. Nos parâmetros, você pode especificar quaisquer moedas e prazos desejados. Além disso, o indicador pode enviar notificações quando os níveis são atingidos. Ao clicar em uma célula, este símbolo e ponto final serão abertos. Este é o scanner MTF. A chave para ocultar o painel do gráfico é “D” por padrã
Fibo Bands
Igor Semyonov
5 (1)
Fibo Bands is an innovative indicator and an analyzer for trading in the current trend direction. The indicator builds a Fibonacci channel (bands), and consists of a trend line (middle line), channel bands, colored bars and reference information. After completion of the current bar, the trend line, the channel and the color of the bar are not redrawn. However, the channel width can be changed after a reset or restart of the indicator depending on volatility. The channel is built in accordance wi
The Baseline Balance tool shows multiple pivot lines for short, mid and long time market cycles. Thus trader can easy identify local or global S/R (support/resistance) levels for better timing of investments and entries to the market. Due to the multifunctional menu directly on chart the settings is fast and accurate. Pivot lines are generated for H1, H4, Daily, Weekly, Monthly, Yearly timeshares. Menu on chart shows following settings: Line Display Settings Middle_Lines – shows middle calculati
Daily Candle Predictor é um indicador que prevê o preço de fechamento de uma vela. O indicador destina-se principalmente ao uso em gráficos D1. Este indicador é adequado tanto para negociação forex tradicional quanto para negociação de opções binárias. O indicador pode ser usado como um sistema de negociação autônomo ou pode atuar como um complemento ao seu sistema de negociação existente. Este indicador analisa a vela atual, calculando certos fatores de força dentro do próprio corpo da vela, be
Royal Dutch Skunk
Sayan Vandenhout
ROYAL DUTCH SKUNK USES THE TREND WAVE INDICATOR AND IT CAN IDENTIFY THE BEGINNING AND THE END OF A NEW WAVE TREND MOVEMENT. AS AN OSCILLATOR, THE INDICATOR IDENTIFIES THE OVERBOUGHT AND OVERSOLD ZONES. IT WORKS GREAT TO CATCH THE SHORT TERM PRICE REVERSALS AND USES A MARTINGALE STRATEGY TO CLOSE ALL TRADES IN PROFIT. USE DEFAULT SETTINGS ON H1 OR HIGHER TIME FRAME ON ANY PAIR FOR MORE ACCURATE TRADES WHY THIS EA : Smart entries calculated by 6 great strategies The EA can be run on even a $20000
FIBOChannels
Hafis Mohamed Yacine
Fibonacci Channel What is a Fibonacci Channel? The Fibonacci channel is a technical analysis tool that is used to estimate support and resistance levels based on the Fibonacci numbers. It is a variation of the Fibonacci retracement tool, except with the channel the lines run diagonally rather than horizontally. It can be applied to both short-term and long-term trends, as well as to uptrend and downtrends. Lines are drawn at 23.6, 38.2, 50, 61.8, 78.6, 100, 161.8, 200, 261.8, 361.8 and 423.6 p
The Transition Trend indicator shows the points of potential market reversal. The indicator's smart algorithm detects the trend, filters out market noise and generates entry signals and exit levels. Simple, visual and efficient trend detection. Uses just one parameter for settings. The indicator does not redraw and does not lag. You can set up message alerts as sound or email. Works on all currency pairs and all timeframes. Ready-made trading system.
Voenix
Lorentzos Roussos
4.58 (12)
Padrões harmônicos , Scanner e comerciante Padrões incluídos: Padrão ABCD Padrão Gartley Padrão de morcego Padrão de cifra 3Padrão de acionamentos Padrão Cisne Negro Padrão de cisne branco Padrão Quasimodo ou padrão Over Under Padrão de morcego alternativo Padrão de borboleta Padrão de caranguejo profundo Padrão de caranguejo Padrão de tubarão Padrão de cinco O Padrão de cabeça e ombros Padrão de triângulo ascendente Padrão Um Dois Três E 8 padrões personalizados Voenix é um scanner de padrões
SWING DETECTOR WITH RSI AND FIBONACCI Structural Swing Points + Fibonacci Retracement + RSI Overlay -------------------------------------------------- FREE INDICATOR Identify swings. See Fibonacci levels. Check RSI. All in one free indicator. -------------------------------------------------- WHAT THIS INDICATOR DOES This indicator automatically detects structural swing highs and lows using configurable depth and deviation filtering. It connects swings with trend lines, overlays standard
FREE
Power Flow Binary
Ganesh Tanaji Lohar
POWER FLOW PRO — Binary Options Edition For the first time ever, the POWER FLOW PRO cumulative dominance logic is specially optimized for Binary Options trading. POWER FLOW PRO is a smart real-time pressure-flow indicator designed to detect aggressive market momentum and short-term directional dominance for fast Binary Options entries. The system analyzes: Real-time buying pressure Real-time selling pressure Momentum candle strength Cumulative dominance flow Continuation pressure to generate hig
-- Simples, mas eficaz. Indicador de inversão - O que é? Um indicador de sobreposição que segue tendências e combina a lógica SuperTrend com a tecnologia de curva exponencial. Ele detecta a direção da tendência, desenha um canal dinâmico no gráfico e envia alertas em tempo real quando a tendência se inverte. Como funciona? O indicador calcula uma linha de base exponencial usando ATR e um fator SuperTrend. Quando o preço fecha acima ou abaixo dessa linha de base, uma inversão de tendência é co
FREE
Ultimate Supply Demand
Ramon Sobrevals Arce
5 (3)
After working during many months, with the help of Neural Networks, we have perfected the ultimate tool you are going to need for identifying key price levels (Supports and Resistances) and Supply and Demand zones. Perfectly suitable to trigger your trades, set up your future actions, decide your Take Profit and Stop Loss levels, and confirm the market direction. Price will always move between those levels, bouncing or breaking; from one zone to another, all the remaining movements are just mark
Os compradores deste produto também adquirem
Currency Strength Wizard é um indicador muito poderoso que fornece uma solução completa para uma negociação bem-sucedida. O indicador calcula o poder deste ou daquele par forex usando os dados de todas as moedas em vários intervalos de tempo. Esses dados são representados em uma forma de índice de moeda fácil de usar e linhas de energia de moeda que você pode usar para ver o poder desta ou daquela moeda. Tudo o que você precisa é anexar o indicador ao gráfico que deseja negociar e o indicador mo
Trend SniperX MT4
Sarvarbek Abduvoxobov
5 (6)
Trend Sniper X é um indicador de tendência multitemporal para MetaTrader 5 que ajuda os traders a identificar a direção da tendência e potenciais pontos de reversão com clareza e precisão. Para MT5: https://www.mql5.com/en/market/product/181101 Informação de preço: O preço atual é promocional e está sujeito a alterações à medida que novas atualizações e recursos forem lançados. Canal Code2Profit Domine o Mercado com Análise Multitemporal! Como Maximizar sua Taxa de Acerto com o Trend Sniper X: R
M1 Sniper
Oleg Rodin
4.97 (30)
O M1 SNIPER é um sistema indicador de negociação fácil de usar. É um indicador de seta projetado para o período M1. O indicador pode ser usado como um sistema independente para scalping no período M1 e pode ser usado como parte do seu sistema de negociação existente. Embora este sistema de negociação tenha sido projetado especificamente para negociação no M1, ele também pode ser usado em outros períodos. Originalmente, desenvolvi este método para negociar XAUUSD e BTCUSD. Mas considero-o útil ta
Smart Trend Trading System é um indicador para MetaTrader 4 que reúne informações de tendência, sinais de entrada e saída e níveis de preço em um único gráfico. Ele combina mais de 10 ferramentas de trading em um único sistema, incluindo detecção de tendência, zonas de reversão, Smart Cloud, lógica de trailing stop, suporte e resistência, coloração de candles, alertas e análise multi-timeframe. O sistema foi desenvolvido para ajudar você a operar diferentes condições de mercado: Mercados em tend
SIO Oscillator: oscilador auto-otimizável de desequilíbrio de semivariância Compre o indicador e receba GRÁTIS o Expert Advisor (EA) baseado nele. A maioria dos osciladores trata todo movimento de preço da mesma forma. O SIO separa a pressão de alta da pressão de baixa e mede o desequilíbrio entre elas, mostrando qual lado realmente controla o mercado: compradores ou vendedores. Quando o desequilíbrio atinge um extremo, o SIO gera um sinal claro com níveis de entrada, Stop Loss e Take Profit. O
Liquidity Scalper System: um sistema de trading baseado em liquidez no formato de indicador. A maioria dos indicadores mostra apenas uma seta, e depois o trader decide sozinho onde colocar o stop, onde está o alvo e se pode confiar no sinal. O Liquidity Scalper System cobre todo o ciclo da operação: encontra pools de liquidez, dá um sinal no seu rompimento, calcula imediatamente Entry, Stop Loss e três alvos, e mostra no painel as estatísticas e os resultados da validação em dados novos. O sist
Gann Made Easy
Oleg Rodin
4.84 (174)
Gann Made Easy é um sistema de negociação Forex profissional e fácil de usar, baseado nos melhores princípios de negociação usando a teoria do sr. W. D. Gann. O indicador fornece sinais precisos de COMPRA e VENDA, incluindo níveis de Stop Loss e Take Profit. Você pode negociar mesmo em movimento usando notificações PUSH. Entre em contato comigo após a compra para receber instruções de negociação e ótimos indicadores extras gratuitamente! Provavelmente você já ouviu muitas vezes sobre os métodos
Advanced Supply Demand
Bernhard Schweigert
4.91 (302)
Atualmente com 30% de desconto! A melhor solução para qualquer Trader Novato ou especialista! Este indicador é uma ferramenta de negociação exclusiva, de alta qualidade e acessível porque incorporamos uma série de recursos proprietários e uma nova fórmula. Com esta atualização, você poderá mostrar fusos horários duplos. Você não só será capaz de mostrar um TF mais alto, mas também mostrar ambos, o TF do gráfico, MAIS o TF mais alto: MOSTRANDO ZONAS ANINHADAS. Todos os traders de Oferta e Demanda
Actualmente 30% OFF ! A melhor solução para qualquer novato ou comerciante especializado! Este software de painel de instrumentos está a funcionar em 28 pares de moedas. É baseado em 2 dos nossos principais indicadores (Advanced Currency Strength 28 e Advanced Currency Impulse). Dá uma grande visão geral de todo o mercado Forex. Mostra valores avançados de força da moeda, velocidade de movimento da moeda e sinais para 28 pares de divisas em todos os (9) períodos de tempo. Imagine como a sua n
Non repaint MT4
Yan Zhen Du
5 (2)
This is a professional chart indicator designed for traders focused on stability and clear price action. It helps filter market noise and provides clear visual entry and exit zones for your trading decisions. Price Information: The current price is promotional and is subject to change as upcoming updates and new features are released. MQL5 public channel:  CLICK HERE for MT5:  Non-repainting MT5 version Core Features: Strictly Non-Repainting: The system is built with strict non-repaint logic. W
Scalper Vault
Oleg Rodin
4.9 (41)
O Scalper Vault é um sistema de negociação poderoso e completo, projetado para traders que buscam consistência em operações intraday. Este indicador de alta precisão funciona como um sistema de negociação autônomo, oferecendo análises de nível institucional tanto para o mercado Forex quanto para Opções Binárias. ENTRE EM CONTATO COMIGO APÓS A COMPRA PARA RECEBER DICAS DE NEGOCIAÇÃO E UM BÔNUS EXCLUSIVO! Ao eliminar suposições e análises manuais complexas, o Scalper Vault permite que você foque
Apresentamos o ON Trade Waves Patterns Harmonic Elliot Wolfe, um indicador avançado projetado para detectar diversos tipos de padrões no mercado, usando métodos manuais e automáticos. Aqui está como ele funciona: Padrões Harmônicos: Este indicador pode identificar padrões harmônicos que aparecem em seu gráfico. Esses padrões são essenciais para traders que praticam a teoria de negociação harmônica, conforme popularizada no livro de Scott Carney "Harmonic Trading vol 1 e 2". Seja desenhando-os m
RFI levels PRO
Roman Podpora
5 (2)
O indicador mostra com precisão os pontos de reversão e as zonas de retorno de preço onde o   Principais players . Você identifica onde novas tendências estão se formando e toma decisões com máxima precisão, mantendo o controle sobre cada negociação. VERSION MT5     -     Revela seu potencial máximo quando combinado com o indicador   TREND LINES PRO. O que o indicador mostra: Estruturas de reversão e níveis de reversão com ativação no início de uma nova tendência. Exibição dos níveis de   TAKE
Zoryk Gold mt4
Reda El Koutbane
5 (4)
O desconto termina em 24 horas — próximo preço $ 69 ZORYK — Sistema avançado de sinais e planejamento para XAUUSD no MetaTrader 4 Você conhece essa sensação. Você analisa o ouro, espera pela entrada e finalmente abre a operação. O preço começa a se mover contra você. Você fecha cedo demais, altera o Stop Loss ou hesita por alguns segundos. Logo depois, o mercado segue exatamente na direção que você esperava, mas sem você na operação. O problema nem sempre era a direção. O verdadeiro problem
ShapeRadar - indicador de padrões gráficos clássicos O ShapeRadar encontra automaticamente no gráfico os padrões clássicos da análise técnica: topos e fundos duplos e triplos, Ombro-Cabeça-Ombro e sua versão invertida, cunhas ascendentes e descendentes, retângulos, triângulos, bandeiras e flâmulas. Quando o preço fecha além do limite de uma figura, o indicador desenha o padrão, o ponto de entrada, o nível de stop loss e o alvo, e um painel informativo resume todos os padrões detectados. Versão p
O sistema PRO Renko é um sistema de negociação altamente preciso especialmente concebido para a negociação de gráficos RENKO. Trata-se de um sistema universal que pode ser aplicado a vários instrumentos de negociação. O sistema neutraliza eficazmente o chamado ruído de mercado, dando-lhe acesso a sinais de inversão precisos. O indicador é muito fácil de usar e tem apenas um parâmetro responsável pela geração de sinal. Você pode facilmente adaptar a ferramenta a qualquer instrumento de negocia
SR Liquidity
Oleg Rodin
5 (3)
O SR Liquidity é um indicador de trading projetado para revelar as zonas ocultas onde a liquidez do mercado se concentra e o preço reage com maior intensidade. Essas áreas específicas de liquidez funcionam como níveis poderosos de suporte e resistência, oferecendo um mapa claro de onde é mais provável que o mercado reverta. Em vez de traçar linhas comuns de Suporte e Resistência, o SR Liquidity analisa o comportamento real dos preços para detectar as zonas onde se acumulam pressões de compra e v
Auto Optimized SpeedAngle é um sistema de vetorização de momentum de nível institucional que elimina o sobreajuste ( curve-fitting ) por meio da otimização contínua de avanço ( Walk-Forward Optimization , WFO). Em vez de depender de entradas estáticas que se degradam quando os regimes de mercado mudam, o indicador recalibra dinamicamente seus parâmetros utilizando validação fora de amostra ( Out-of-Sample , OOS), garantindo que os sinais exibidos representem vantagens estatísticas genuínas e não
Professional Volume Profile An indicator for MetaTrader 4 that builds a horizontal Volume Profile directly on the price chart. It shows the levels where traders executed the most trades, helping to identify support/resistance zones and assess the balance of power in the market. What the Indicator Displays POC (Point of Control) — the level with the maximum trading volume (red line). VAH / VAL (Value Area High / Low) — the upper and lower boundaries of the value area, where 70% of the volume was
Italo Volume Indicator
Italo Santana Gomes
4.92 (79)
BUY INDICATOR AND GET EA FOR FREE AS A BONUS + SOME OTHER GIFTS! ITALO VOLUME INDICATOR  is the best volume indicator ever created, and why is that? The Indicator works on all time-frames and assets, indicator built after 7 years of experience on forex and many other markets. You know many volume indicators around the internet are not complete, does not help, and it's difficult to trade, but the Italo Volume Indicator is different , the Italo Volume Indicator shows the wave volume, when market
Estima o movimento de preço mais provável no curto prazo com base em cálculos matemáticos avançados. Características Estimativa do movimento imediato do preço no timeframe do gráfico e em todos os superiores; Cálculo da tendência real do mercado; Cálculo dos níveis de suporte e resistência mais importantes; Alertas de zonas de congestão, cruzamentos de níveis e mudanças de tendência; Leve nos recursos do sistema: as linhas e o painel só são atualizados quando um valor muda; Autoajustável: funci
Atomic Analyst
Issam Kassas
5 (14)
Atomic Analyst — MetaTrader 4 Para dúvidas sobre o produto, orientação de configuração ou suporte técnico, envie-me uma mensagem diretamente aqui no MQL5. O indicador transforma cálculos complexos do mercado em sinais visuais simples, candles coloridos, leituras de tendência, níveis de stop loss e várias zonas de take profit que os traders podem entender rapidamente e usar em condições reais de mercado. Principais usos de trading: Scalping e day trade: Desenvolvido para tomada de decisão rápida
Scalping Entry Points - é um sistema de negociação manual que pode se ajustar aos movimentos de preços e dar sinais para abrir negociações sem redesenhar. O indicador determina a direção da tendência pelo nível central de suporte e resistência. O indicador de ponto fornece sinais para entradas e saídas. Adequado para negociação intradiária manual, escalpelamento e opções binárias. Funciona em todos os prazos e instrumentos de negociação. O indicador dá vários tipos de alertas. Como usar o produ
All in One package includes the  Oscillator Predictor ,  MACD Predictor ,  Thrust Scanner  and  Advanced Fibonacci  indicators which are mandatory for applying  Dinapoli  trade plans.  Please visit below links for detailed explanations of indicators. Advanced Fibonacci Indicator =>  https://www.mql5.com/en/market/product/52834 Thrust Scanner Indicator => https://www.mql5.com/en/market/product/52830 Overbought /Oversold Predictor indicator => https://www.mql5.com/en/market/product/52621 Macd P
True Direction Oscillator
Muhammad Elbermawi
4.85 (364)
Ou (TDO) que é um índice que mede a taxa de variação do preço usando o princípio de " Pure Momentum ". Quando o preço de um título avança de 10 para 15, a taxa de variação do preço é 150%, mas quando diminui de 15 para 10, a taxa de variação do preço é apenas 33,3%. É por isso que os indicadores de análise técnica como "Taxa de variação do preço" (ROC) ou "Momentum" fornecem leituras mais altas para movimentos de preços ascendentes do que para os descendentes. O TDO corrige esse problema para aj
Quantum Imbalance Profiles   é um indicador das fases de equilíbrio e desequilíbrio. Ele mostra em quais preços o mercado negociou volume, qual lado dominou dentro dessa zona e por quais níveis o preço depois se expandiu com impulso. Um perfil de volume clássico responde a uma única pergunta: onde ocorreu a negociação. Ele não mostra qual lado dominou em cada preço, como terminou a consolidação nem em que direção o mercado saiu dela. Quantum Imbalance Profiles constrói o perfil no modo Volume Bi
Indicador para negociação manual e análise técnica para Forex. Consiste em um indicador de tendência com o nível de abertura do dia de negociação e um indicador de seta para determinar os pontos de entrada. O indicador não muda de cor; funciona quando a vela fecha. Contém vários tipos de alertas para setas de sinalização. Pode ser configurado para funcionar em qualquer gráfico, instrumento de negociação ou período de tempo. A estratégia de trabalho baseia-se na busca de movimentos de preços ao
Currency Strength Matrix
Raymond Gilmour
4.5 (26)
THE ONLY CURRENCY STRENGTH INDICATOR BUILT ON PRICE ACTION Most currency strength meters average an oscillator, or measure how far price has travelled. But these are not accurate measures of trend, Currency Strength Matrix measures trend strength, not just if a currency price has gone up or down. Currency Strength Matrix reads market structure . For each of the 28 major pairs it finds the confirmed cycle highs and lows, and decides whether that pair is in an uptrend, a downtrend, or neither. A
Dark Support Resistance  is an Indicator for intraday trading. This Indicator is programmed to identify  Support and Resistance Lines , providing a high level of accuracy and reliability. Key benefits Easily visible lines Only the most important levels will be displayed Automated adjustment for each timeframe and instrument Easy to use even for beginners Never repaints, never backpaints, Not Lag 100% compatible with Expert Advisor development All types of alerts available: Pop-up, Email, Push
ACTUALMENTE 40% DE DESCONTO!! A melhor solução para qualquer novato ou comerciante especializado! Este indicador é uma ferramenta comercial única, de alta qualidade e acessível, porque incorporámos uma série de características proprietárias e uma fórmula secreta. Com apenas UM gráfico, dá alertas para todos os 28 pares de moedas. Imagine como a sua negociação irá melhorar porque é capaz de identificar o ponto exacto de desencadeamento de uma nova tendência ou oportunidade de escalada! Constr
Mais do autor
Flat Session Statistics is a statistics panel for MetaTrader 4. It does not generate buy or sell signals. It aggregates the past bars of the symbol it is attached to and shows how often a defined event was followed by a defined outcome — as a conditional frequency with its sample size (N) and a Wilson 95% confidence interval on every line. Statistics (14 items, closed sessions only): - Baseline green rate (sessions closing above their open) - Gap fill rate (all / up / down) and gap-and-go hold r
Flat Flag Patterns automatically detects and draws flag and pennant continuation patterns on your MT4 chart. It looks for a strong one-way move (the pole) followed by a small consolidation (the flag), and draws the pole line, the flag zone, a label and arrows directly on the chart. Detection is normalised by volatility (ATR), so the same yardstick applies across symbols and timeframes. For the pole it also checks that the move was clean and one-directional — choppy two-way action does not count
Horizon Quad-Compass MT4 — 4 indicators x 3 timeframes x up to 12 symbols on one dashboard Horizon Quad-Compass is a multi-timeframe, multi-symbol monitoring indicator for MetaTrader 4. It reads four widely used indicators — MA, Stochastic, MACD and ADX — on three timeframes for up to 12 symbols at once, and shows each symbol's direction as dots on a single dashboard, so you can see which symbols are aligned and which timeframe is breaking down without switching between charts. Direction at a gl
Overview FlatStochasticCycle is a signal indicator for MetaTrader 4 that reads three Stochastics with different periods as overlapping "cycles". A cross of the short Stochastic is the trigger, and the mid and long Stochastics (position against level 50) filter the situation. OsMA checks momentum and ADX checks trend strength; each filter can be switched ON/OFF individually. All judgements are made on closed bars, so signals do not repaint. This indicator does not place orders by itself. Main fea
Overview Flat10-Trend Bias Panel is a multi-symbol bias monitor for MetaTrader 5. It watches 9 symbols (EURUSD, GBPUSD, USDJPY, AUDUSD, NZDUSD, USDCAD, USDCHF, EURJPY and GOLD) and judges the trend bias of each symbol from four technical votes: moving average alignment, ADX, MACD and RSI. When all four votes agree, the symbol is treated as having a strong bias. The panel also draws entry-timing arrows for the chart symbol. This indicator does not place orders by itself. Main features Each watche
Overview FlatAutoFibonacci is an automatic Fibonacci indicator for MetaTrader 5. It detects swing highs and lows and draws Fibonacci retracement levels automatically, and in addition it watches for reversal bars near the levels and draws counter-trend entry signals. A second Fibonacci projection provides take-profit and stop-loss reference lines, and a statistics panel shows a win-rate simulation of the signals. This indicator does not place orders by itself. Main features Fibonacci retracement
Overview FlatFibonacciWave is a two-stage Fibonacci indicator for MetaTrader 5. It detects the latest swing and draws two-stage Fibonacci levels automatically, with a price table and a movable dashboard. In addition to the level display, it provides linkage event buffers and alerts when price reaches a level. This indicator does not place orders by itself. Main features Two-stage Fibonacci levels are drawn automatically from the detected swing Linkage event buffers for external tools (buffer 2 =
Overview FlatFibonacciCluster is a multi-timeframe Fibonacci overlap map for MetaTrader 5. It draws Fibonacci retracement levels from six timeframes (M15, M30, H1, H4, D1 and W1) on one chart, and highlights the price bands where levels from different timeframes overlap within a tolerance. The more levels overlap in a band, the more timeframes share a level near that price. This indicator does not place orders by itself. Main features Levels are drawn as bands, and each band's end label shows it
Overview FlatStochasticCycle is a signal indicator for MetaTrader 5 that reads three Stochastics with different periods as overlapping "cycles". A cross of the short Stochastic is the trigger, and the mid and long Stochastics (position against level 50) filter the situation. OsMA checks momentum and ADX checks trend strength; each filter can be switched ON/OFF individually. All judgements are made on closed bars, so signals do not repaint. This indicator does not place orders by itself. Main fea
Horizon Trend Matrix is a matrix-style dashboard indicator for MetaTrader 5. It judges the trend of one symbol across three timeframes (H1, M15, M5) using a single selectable moving average method, and shows the result as a compact matrix together with signal arrows on the chart. Main features 12 moving average types to choose from, including SMA, EMA, RMA and ALMA Each dashboard cell shows the deviation rate (%) of the price from the moving average, color-coded by direction Signal arrows appear
Overview Horizon MACD Radar is a radar-style dashboard indicator for MetaTrader 5. It monitors MACD-based signals across multiple symbols and timeframes at a glance, and shows signal arrows on the chart so you can spot where momentum is turning without opening many charts. Main features Signal mode can be switched from the parameters: MACD cross mode or OsMA mode The selected mode is saved per chart and shown on the dashboard All signals are evaluated on closed bars only, so displayed signals do
Overview Horizon Quad-Compass is a compass-style dashboard indicator for MetaTrader 5. For each symbol, it lays out four oscillators (moving average, stochastic, MACD and ADX) against three timeframes (H1, M15 and M5) as a grid of dots in a subwindow, so trend and momentum conditions can be compared at a glance. Main features Dashboard in a subwindow: rows are the four oscillators (MA, Stochastic, MACD, ADX) and columns are the timeframes (H1, M15, M5) Clicking a timeframe header button opens th
Overview Horizon Pulse is a multi-symbol matrix dashboard indicator for MetaTrader 5. It watches up to 40 symbols across 4 timeframes in a single matrix, and also ranks the strength of the 8 major currencies numerically, so you can grasp the whole market's direction from one panel. Main features Matrix view of up to 40 symbols x 4 timeframes Currency strength ranking for the 8 major currencies, shown as numeric values Signal Mode can be selected from the parameters: MA Order or MACD Cross All ev
Overview Horizon Prime Consensus is a consensus-style dashboard indicator for MetaTrader 5. It combines the judgments of multiple technical indicators into one consensus view for each symbol across three timeframes (M5, M15 and H1), and draws signal arrows on the main price chart when the consensus points to an entry direction. Main features Consensus view across three timeframes: M5, M15 and H1 Signal arrows are drawn on the main price chart, not only inside the panel Signal mode can be selecte
Overview Horizon Expanded Signal is an entry signal indicator for MetaTrader 5. It checks whether five technical indicators (SMA, ADX, CCI, Parabolic SAR and Momentum) are aligned in the same direction, and only when the completed higher-timeframe trend agrees, it draws an entry signal together with suggested stop-loss and take-profit levels on the chart. It is designed and verified primarily for GOLD on the 15-minute timeframe. This indicator does not place orders by itself. Main features Align
Overview Horizon Combo Signal is an entry signal indicator for MetaTrader 5. It watches whether multiple technical conditions are aligned in the same direction, and when a new alignment is completed it draws an entry signal on the chart together with stop-loss and take-profit reference lines. The recommended setting is GOLD on the 1-hour timeframe. This indicator does not place orders by itself. Main features Entry arrows appear only when the alignment is newly completed, evaluated on closed bar
Four indicators. One agreement. One signal. Horizon Trend Combo Signal is a trend signal indicator built exclusively for GOLD (XAUUSD) on the H3 (180-minute) chart. It fires an entry signal only when all four of its components point in the same direction: Supertrend (factor 3.0, ATR 10) - trend direction Ichimoku Kinko Hyo (9, 26, 52) - price vs. cloud plus Tenkan/Kijun OsMA - MACD (12, 26, 9) histogram sign Aroon (14) - strength of the most recent high/low When the last component joins the othe
Horizon Agent Brief MT5 is a standalone indicator that briefs AI agents about the chart - and shows the same briefing to you on a movable panel. On every closed bar it writes a structured JSON packet to files (MQL5\Files\Horizon_Agent_Brief by default): the candle anatomy (body, wicks, close position, pattern), the last 5 candles, regime, momentum, volume, swing structure, previous-day levels and VWAP, the score breakdown and the tracked trade state. AI agents and external tools can read the pac
Flat Session Statistics is a statistics panel for MetaTrader 5. It does not generate buy or sell signals. It aggregates the past bars of the symbol it is attached to and shows how often a defined event was followed by a defined outcome — as a conditional frequency with its sample size (N) and a Wilson 95% confidence interval on every line. Statistics (14 items, closed sessions only): Baseline green rate (sessions closing above their open) Gap fill rate (all / up / down) and gap-and-go hold rate
Version 1.102 update: Added a fractal model (C2 / CISD / protected swings), Reclaim Strength (RS) with RS-band survival statistics in the panel, ICT killzones (5 sessions) with previous day/week/month pivots, and ADR/CDR. Each module can be switched on or off individually. The confluence signal (buffer 0 = Buy, 1 = Sell) and its readability from external tools such as Flat Manual Trader are unchanged. Flat SMC Structure Map is a Smart Money Concepts structure indicator for MetaTrader 5. It draws
Flat Volume Profile draws a volume profile on your MT5 chart from tick volume. For each period it builds a price-by-price volume histogram and shows: POC (Point of Control): the price with the highest volume Value Area (VAH / VAL): the range containing 70% of the period volume (adjustable) VWAP for the period, with optional +/-1SD and +/-2SD bands (latest profile) Period modes: Daily, Weekly, Rolling (last N bars) and Anchored (from any start time). Past profiles can be shown as well (default: 5
The signal, the sizing and the exit — in one EA. Horizon Trend Combo EA is a standalone expert advisor for MetaTrader 5, built exclusively for GOLD (XAUUSD) on the H3 (180-minute) chart. The Horizon Trend Combo signal is built into the EA itself: no separate indicator and no other product is required. How it trades The EA watches for the moment when four trend components agree in the same direction: - Supertrend (factor 3.0, ATR 10) — trend direction - Ichimoku Kinko Hyo (9, 26, 52) — price vs.
A standalone MT5 expert advisor for GOLD (XAUUSD) on M5. A regression-slope trend signal filtered by the higher-timeframe trend, long-only, with a 24-hour maximum hold and risk-% lot sizing. Verified on 100% real ticks over 2024-2026. One trend signal, one higher-timeframe check — nothing else. Horizon Gold Trend EA is a standalone expert advisor for MetaTrader 5, built exclusively for GOLD (XAUUSD) on the M5 chart. The signal, the filter, the exits and the lot sizing are all built into the EA i
Flat Reversion Radar is a mean-reversion screener for MetaTrader 5. For up to 12 watch symbols it measures how far each price has stretched away from its own mean, using a least-squares regression centre, residual standard-deviation bands and a z-score, and lists the symbols in a panel sorted by the size of the deviation. For the chart symbol it draws the regression channel: the centre line, the +/-1 sigma bands and the +/-2 sigma bands. The z-score puts every symbol on the same scale, so a curr
Flat Flag Patterns automatically detects and draws flag and pennant continuation patterns on your MT5 chart. It looks for a strong one-way move (the pole) followed by a small consolidation (the flag), and draws the pole line, the flag zone, a label and arrows directly on the chart. Detection is normalised by volatility (ATR), so the same yardstick applies across symbols and timeframes. For the pole it also checks that the move was clean and one-directional — choppy two-way action does not count
Overview Horizon Combo EA is a fully automated Expert Advisor for MetaTrader 5. It watches whether multiple technical conditions are aligned in the same direction, and when a new alignment is completed it opens a position with a stop loss derived from the ATR at that moment and a take profit placed by a risk-reward ratio (default 3.0). The recommended setting is GOLD on the 1-hour timeframe, using the built-in "GOLD 1H Recommended" preset. Position size is calculated from the risk percentage of
Horizon Confluence EA is a fully automated trend-following Expert Advisor for MetaTrader 5. It watches swing direction across several timeframes at once and enters only when the directions come together (confluence). It does not use grid, martingale or averaging-down techniques: every position is opened with a stop loss, and the exit is handled by an ATR-based trailing stop, with an optional partial close. The default settings are tuned for XAUUSD (GOLD) on the M15 chart. The EA trades the symbo
Horizon SMC Suite MT5 — the all-in-one SMC / ICT dashboard One indicator that draws the full Smart Money Concepts map on a single chart: market structure, order blocks, fair value gaps, liquidity, a full volume profile, sessions and killzones — and grades every zone by how many profile elements overlap it. Modules - Market structure: major / internal BOS and CHoCH, HH / HL / LH / LL swing labels, premium / discount bands with equilibrium - Order blocks and fair value gaps (with CE line), includi
What it is Horizon Currency Strength MT5 is a currency strength meter for MetaTrader 5. It computes the relative strength of the 8 major currencies (USD, EUR, GBP, JPY, AUD, NZD, CAD, CHF) from all 28 related pairs and shows them as a 0-100 ranking on a panel in the chart window. It is a display-only indicator: it does not place trades. How the score is calculated For each of the 28 pairs, the indicator measures the price change over a lookback period, normalized by ATR so that pairs with differ
Filtro:
Sem comentários
Responder ao comentário