Linear Regressions Convergence Divergence

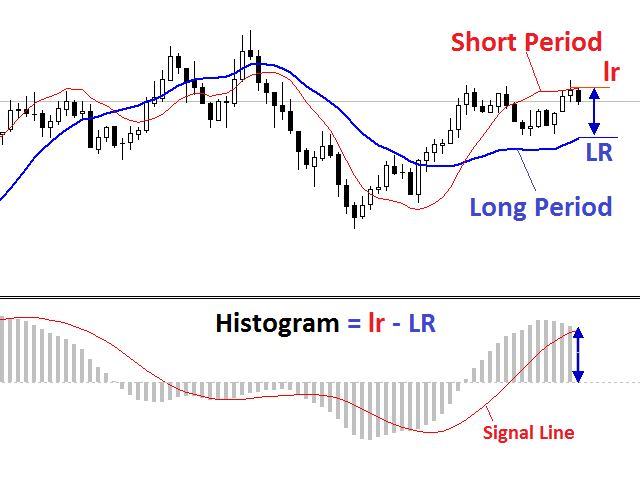
Linear Regressions Convergence Divergence is an oscillator indicator of a directional movement plotted as a difference of two linear regressions with lesser and greater periods. This is a further development of the ideas implemented in the standard MACD oscillator. It has a number of advantages due to the use of linear regressions instead of moving averages. The indicator is displayed in a separate window as a histogram. The signal line is a simple average of the histogram.

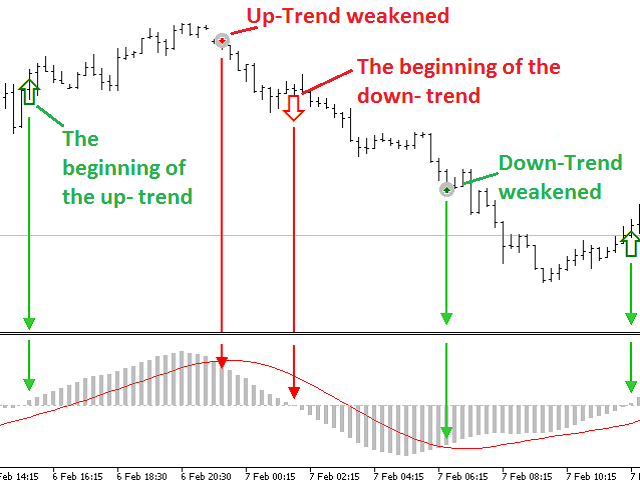
The histogram value above zero specifies an uptrend. The higher the value, the stronger the trend. A value below 0 indicates a downtrend. The lower the value, the stronger the downtrend.

The histogram and signal line crossing indicates a current trend weakening or a reversal.


Equation

LRCD=Lr(n) - Lr(N), where Lr(n) is a linear regression with n period, Lr(N) is a linear regression with N period, N > n.


Advantages

  • Linear regression smooths accidental fluctuations and allows the indicator to accurately define trend reversals.
  • The signals are lagging in a lesser degree as compared to the standard MACD oscillator.
  • Defining areas where the trend is weakening and areas where the directional movement is resumed.
  • Any instruments.
  • All timeframes.
  • No repaints, no recalculation.


Parameters

  • Fast Regression period - fast linear regression calculation period.
  • Slow Regression period - slow linear regression calculation period.
  • Signal Line period - smoothing period when plotting a signal line.


How to use

The indicator can be used in several ways.

  1. As a trend indication: if the histogram is positive, the trend is growing, a negative value is a sign of a downtrend.
  2. To assess the trend strength: when the histogram is positive and above its signal line value, the uptrend is gaining momentum. If the histogram is below the signal line, but is greater than zero, the uptrend is weakening. When the histogram is negative and its value is below the signal line, the downtrend is gaining momentum. If the histogram is above the signal line, but is below zero, the downward trend is weakening.
  3. For signal generation: buy/selling by trend when the histogram crosses the zero level; buying against the downtrend when the signal line crosses upwards in the negative zone. In this case, a signal to close a short position appears; selling against the uptrend at the signal line crossing from top to bottom in case of an uptrend. In this case, a signal to close a long position appears.
  4. Price and indicator divergence shows the upcoming end of an uptrend. Price and indicator convergence shows the upcoming end of a downtrend.

The following signals are displayed on the chart window:

  • up/down arrows mark the histogram sign change hinting at a trend reversal
  • Buy/Sell arrows mark the histogram and the signal line crossing


Features

Calculations are performed at a Close price.

The smaller the Fast Regression period and Slow Regression period values, the more often the indicator will produce trend change signals.

The smaller the smoothing period Signal Line period, the more often the indicator will generate trend weakening signals.

A trend change signal (up/down arrow) is usually preceded by a weakening one (Buy/Sell arrows).

Standard settings 30/60/15.

When changing the settings, it is recommended to remove arrows from the chart window.

Önerilen ürünler
This indicator can be considered as a trading system. It offers a different view to see the currency pair: full timeless indicator, can be used for manual trading or for automatized trading with some expert advisor. When the price reaches a threshold a new block is created according to the set mode. The indicator beside the Renko bars, shows also 3 moving averages. Features renko mode median renko custom median renko 3 moving averages wicks datetime indicator for each block custom notification
TrendDetect
Pavel Gotkevitch
The Trend Detect indicator combines the features of both trend indicators and oscillators. This indicator is a convenient tool for detecting short-term market cycles and identifying overbought and oversold levels. A long position can be opened when the indicator starts leaving the oversold area and breaks the zero level from below. A short position can be opened when the indicator starts leaving the overbought area and breaks the zero level from above. An opposite signal of the indicator can b
Donchian Channel DC is the indicator of Donchian Channels, that plots maximum and minimum values of a specific period, besides mean value line. It´s possible to configure simple period for analysis and the indicator will plot all three values. You can trade with this indicator as trend or reversal, according to each strategy. Do not let to test others indicators as soon as others expert advisors.
Gekko MACD Plus
Rodrigo Galeote
3 (3)
Type: Oscillator This is Gekko's Cutomized Moving Average Convergence/Divergence (MACD), a customized version of the famous MACD indicator. Use the regular MACD and take advantage of several entry signals calculations and different ways of being alerted whenever there is potential entry point. Inputs Fast MA Period: Period for the MACD's Fast Moving Average (default 12); Slow MA Period: Period for the MACD's Slow Moving Average (default 26); Signal Average Offset Period: Period for the Signal A
Renko Plus
Eadvisors Software Inc.
With Renko Plus you can use the features in the Indicator functionality, just add it to the Metatrader5 chart.             The Renko chart is a type of chart, developed by the Japanese, that is constructed using price movement rather than standardized prices and time intervals like most charts. It is believed to be named after the Japanese word for bricks, "renga", as the graphic looks like a series of bricks.             A new brick is created when the price moves a specified pri
This is Gekko's Cutomized Cutomized Average Directional Index (ADX), a customized version of the famous ADX indicator. Use the regular ADX and take advantage two entry signals calculations and different ways of being alerted whenever there is potential entry or exit point. Inputs Period: Period for the ADX calculation; PlotSignalType: How will the indicator calculate entry (swing) signals: 1- ShowSwingsOnTrendLevel : Show Signals for Trend Confirmation Swings; 2- ShowSwingsOnTrendLevelDirection
Owl Smart Levels MT5
Sergey Ermolov
4.03 (32)
MT4 versiyonu  |  FAQ Owl Smart Levels Indicator , Bill Williams'ın gelişmiş fraktalları , piyasanın doğru dalga yapısını oluşturan Valable ZigZag ve kesin giriş seviyelerini gösteren Fibonacci seviyeleri gibi popüler piyasa analiz araçlarını içeren tek gösterge içinde eksiksiz bir ticaret sistemidir. pazara ve kar elde edilecek yerlere. Stratejinin ayrıntılı açıklaması Gösterge ile çalışma talimatı Baykuş Yardımcısı ticaretinde Danışman Yardımcısı Kullanıcıların özel sohbeti -> Satın aldıktan
Terra Infinity is a flat indicator. This improved version of the CalcFlat indicator has three additional lines that significantly increase its effectiveness. Unlike its predecessor with two static levels, Terra Infinity adds three dynamic lines above the main histogram, which are interpreted as follows: base signal line, minimum signal line, maximum signal line. These lines are formed using the additional parameter Avg, which is the average value of the histogram. Averaging produces a line cl
Weis Wave Scouter
Jean Carlos Martins Roso
MetaTrader 5 için geliştirilen Weis Wave Scouter ile gelişmiş hacim analizinin gücünü keşfedin! Bu devrim niteliğindeki gösterge, Wyckoff yönteminin ve Hacim Yayılımı Analizinin (VSA) kanıtlanmış ilkelerini birleştiriyor. Operasyonlarında doğruluk ve derinlik arayan yatırımcılar için tasarlanmıştır ve kümülatif hacim dalgası analizi yoluyla piyasanın taktiksel bir okumasını sunar. Weis Wave Scouter, Classic, NightVision ve OceanBreeze gibi özelleştirilebilir renk temaları ile renkli histogramlar
MT5 için Crypto_Forex Göstergesi "Çekiç ve Kayan Yıldız paterni", Yeniden boyama yok, gecikme yok. - "Çekiç ve Kayan Yıldız paterni" göstergesi, Fiyat Hareketi işlemleri için çok güçlü bir göstergedir. - Gösterge, grafikte boğa Çekiç ve ayı Kayan Yıldız formasyonlarını tespit eder: - Boğa Çekiç - Grafikte mavi ok sinyali (resimlere bakın). - Ayı Kayan Yıldız - Grafikte kırmızı ok sinyali (resimlere bakın). - Bilgisayar, Mobil ve E-posta uyarılarıyla. - "Çekiç ve Kayan Yıldız paterni" gösterges
ZigZag Wave Entry Alert MT5
Azad Amanuel Gorgis Gorgis
The ZigZag Wave Entry Alert** indicator, created by Azad Gorgis in 2024, is designed for MetaTrader 5 and aims to provide traders with entry signals based on ZigZag patterns. Here's a brief overview of its functionality and key features: Functionality: - Detection of ZigZag Patterns: The indicator identifies significant price movements and outlines potential ZigZag patterns on the chart. It detects new highs and lows based on user-defined parameters such as Depth, Deviation, and Backstep. - A
STRICTLY FOR BOOM INDEX ONLY!!!!! Here I bring the Maximum Trend Arrows OT1.0 MT5 indicator. This indicator is made up of a combination of different trend indicators for entries and exits, for entries an orange arrow will paint on the chart below the current market and a red flag for closing of trades and it produces buy arrows only. When the orange arrow appears, it will appear along with it's sound to notify you. The 1H timeframe is recommended, don't use it anywhere else than on the 1H timefr
Auto Optimized RSI , doğru alım ve satım sinyalleri vermek için tasarlanmış, kullanımı kolay ve akıllı bir ok göstergesidir. Geçmiş verilere dayalı işlem simülasyonları kullanarak, her enstrüman ve zaman dilimi için en etkili RSI seviyelerini otomatik olarak belirler. Bu gösterge, bağımsız bir işlem sistemi olarak veya mevcut stratejinize entegre edilerek kullanılabilir ve özellikle kısa vadeli işlem yapanlar için faydalıdır. Geleneksel RSI’nin sabit seviyeleri (örneğin 70/30) yerine,   Auto Opt
This is Gekko's Cutomized Relative Strength Index (RSI), a customized version of the famous RSI indicator. Use the regular RSI and take advantage two entry signals calculations and different ways of being alerted whenever there is potential entry or exit point. Inputs Period: Period for the RSI calculation; How will the indicator calculate entry (swing) signals: 1- Produces Exit Signals for Swings based on RSI entering and leaving Upper and Lower Levels Zones; 2- Produces Entry/Exit Signals for
KDJ Index 4   交易实用必备工具指标 波浪自动计算指标,通道趋势交易 完美的趋势-波浪自动计算通道计算 , MT4版本 完美的趋势-波浪自动计算通道计算 , MT5版本 本地跟单复制交易 Easy And Fast Copy , MT4版本 Easy And Fast Copy , MT5版本 本地跟单复制交易 模拟试用 Easy And Fast Copy , MT4 模拟账号运行 Easy And Fast Copy , MT5 模拟账号运行 "Cooperative QQ:556024  "  "Cooperation wechat:556024"  "Cooperative email:556024@qq.com" 强烈推荐趋势指标, 波浪的标准自动计算   和   波浪的标准自动计算MT5版本     KDJ指标又叫 随机指标 ,是一种相当新颖、实用的技术分析指标,它起先用于期货市场的分析,后被广泛用于股市的中短期趋势分析,是期货和股票市场上最常用的技术分析工具。 随机指标KDJ一般是用于股票分析的统计体系,根据统计学原理,通过一个特定的周期(常为9日、9周等)
# DRAWDOWN INDICATOR V4.0 - The Essential Tool to Master Your Trading ## Transform Your Trading with a Complete Real-Time Performance Overview In the demanding world of Forex and CFD trading, **knowing your real-time performance** isn't a luxury—it's an **absolute necessity**. The **Drawdown Indicator V4.0** is much more than a simple indicator: it's your **professional dashboard** that gives you a clear, precise, and instant view of your trading account status. --- ## Why This Indicator
The Optimized MACD Divergence indicator is a powerful tool designed to identify potential trading opportunities by detecting divergences between price action and the MACD indicator. It combines classic divergence analysis with candlestick pattern recognition and volume filtering to provide more accurate and reliable signals. How it Works The indicator operates on the following principles: MACD Calculation:   It calculates the MACD indicator using user-defined parameters for fast EMA, slow EMA,
Cvd Divergence
Thalles Nascimento De Carvalho
CVD Divergence – Profesyonel Emir Akışı ve Diverjans Analizi CVD Divergence, fiyat ile Kümülatif Delta Hacmi (CVD) arasındaki güvenilir uyumsuzlukları tespit etmek için tasarlanmış teknik bir göstergedir. Gerçek emir akışının fiyat hareketini doğrulamadığı anları yüksek hassasiyetle belirleyerek olası dönüşleri, momentum zayıflamasını ve kurumsal manipülasyonları ortaya çıkarır. Gösterge, agresif hacim analizini fiyat yapısıyla birleştirerek net, objektif ve erken sinyaller sağlar. Göstergenin Ö
The TrendChangeZone indicator displays global and local price highs and lows on the chart.   The indicator also shows the global trend on the chart and corrective waves.   This indicator is designed to determine the direction and change the trend.   Most importantly, the indicator shows trend continuation or reversal zones.   An indispensable assistant in trading.   The indicator does not redraw.   The indicator can work on all trading instruments. Important !!! Top trend if 2 (two) or more bl
SMMA Bands Indicator
Elie Baptiste Granger
The SMMA Bands indicator is an advanced volatility-based trading tool that creates 6 dynamic support and resistance levels around an envelope formed by two Smoothed Moving Averages (SMMA).  This indicator combines the reliability of SMMA trend identification with the precision of standard deviation-based volatility bands, making it suitable for both trend-following and mean-reversion strategies. Every band has its own buffer for use in EA. feel free to make suggestions and add reviews , i will
FREE
Unlock key market insights with automated support and resistance lines Tired of plotting support and resistance lines? This is a multi-timeframe indicator that detects and plots supports and resistance lines in the chart with the same precision as a human eye would. As price levels are tested over time and its importance increases, the lines become thicker and darker, making price leves easy to glance and evaluate. [ Installation Guide | Update Guide | Troubleshooting | FAQ | All Products ] Boos
The indicator detects divergence signals - the divergences between the price peaks and the MACD oscillator values. The signals are displayed as arrows in the additional window and are maintained by the messages in a pop-up window, e-mails and push-notifications. The conditions which formed the signal are displayed by lines on the chart and in the indicator window. The indicator parameters MacdFast - fast MACD line period MacdSlow - slow MACD line period MacdSignal - MACD signal line period Macd
Naturu
Ivan Stefanov
5 (1)
“Naturu”, doğanın simetrisini algoritması olarak kullanan bir manuel indikatördür. Basit bir strateji ve gizli bilgelikle piyasayı fethedin! İndikatörü yüklediğinizde iki çizgi görürsünüz: Üst (Top) ve Alt (Bottom). Bir çizgiye tıklayarak aktifleştirin. Taşımak için, yerleştirmek istediğiniz mumun üzerine tıklayın. Bir tepe noktası ve bir dip noktası belirlersiniz, indikatör otomatik olarak hesaplar: Boğalar ve ayıların çıkarlarının en yakınlaştığı, destek veya direnç rolü oynaması en muhtemel b
The   Trendlines Oscillator   helps traders identify trends and momentum based on the normalized distances between the current price and the most recently detected bullish and bearish trend lines. The indicator features bullish and bearish momentum, a signal line with crossings, and multiple smoothing options. USAGE The   Trendlines Oscillator   works by systematically: Identifying pivot highs and lows. Connecting pivots to form bullish (support) and bearish (resistance) trendlines. Measuring
##   ONLY GOLD ##   Тiльки Золото ## **Mercaria Professional Trading Zones - Complete Guide** ## **Mercaria Professional Trading Zones - Повний посібник** ### **How Mercaria Zones Work / Як працюють зони Mercaria** **English:** Mercaria Zones is an advanced trading indicator that identifies high-probability support and resistance areas using ZigZag extremes combined with mathematical zone calculations. The indicator works on multiple timeframes simultaneously, providing a comprehensive view
PipFinite Trend PRO MT5
Karlo Wilson Vendiola
4.84 (558)
Breakthrough Solution For Trend Trading And Filtering With All Important Features Built Inside One Tool! Trend PRO's smart algorithm detects the trend, filters out market noise and gives entry signals with exit levels. The new features with enhanced rules for statistical calculation improved the overall performance of this indicator. Important Information Revealed Maximize the potential of Trend Pro, please visit www.mql5.com/en/blogs/post/713938 The Powerful Expert Advisor Version Automatin
Double HMA MTF for MT5
Pavel Zamoshnikov
4 (4)
This is an advanced multi-timeframe version of the popular Hull Moving Average (HMA) Features Two lines of the Hull indicator of different timeframes on the same chart. The HMA line of the higher timeframe defines the trend, and the HMA line of the current timeframe defines the short-term price movements. A graphical panel with HMA indicator data from all timeframes at the same time . If the HMA switched its direction on any timeframe, the panel displays a question or exclamation mark with a tex
Fit line supports to extrapolation next movement of market, support for buy/sell decision. Indicator using spline algorithm to extrapolation.  You can change number of spline with parameter "PointsNumber" and number of extrapolation point with "ExtrapolateBars". Eextrapolation points will be save into csv format, with prefix in parameter "PointsPrefix", and store in folder File of Data Folder.
Order Book, known also as Market Book, market depth, Level 2, - is a dynamically updated table with current volumes of orders to buy and to sell specific financial instument at price levels near Bid and Ask. MetaTrader 5 provides the means for receiving market book from your broker, but in real time only, without access to its history. The indicator OrderBook Cumulative Indicator accumulates market book data online and visualizes them on the chart. In addition, the indicator can show the market
Индикатор iVeles_Perfect_Oscilator является опережающим и одним из самых лучших осциляторов на сегодняшний день,  использует специализированный расчет текущих цен графика.  Очень качественно и своевременно показывает смену направления, очень точный подход к уровням перекупленности и перепроданности, что позволяет своевременно принять решение по сделке.  Работает качественно на любом ТФ и с любым инструментом. Параметры: Period - период расчетов Average  - усреднение  МА Method - применяемый мето
Bu ürünün alıcıları ayrıca şunları da satın alıyor
Bu indikatörü satın alırsanız, Profesyonel Trade Manager’ımı  + EA ÜCRETSİZ olarak alacaksınız. Öncelikle, bu Ticaret Sistemi'nin Non-Repainting, Non-Redrawing ve Non-Lagging Göstergesi olduğunu vurgulamak önemlidir, bu da hem manuel hem de robot ticareti için ideal hale getirir. Online kurs, kılavuz ve ön ayarları indir. "Smart Trend Trading System MT5", yeni ve deneyimli tüccarlar için özelleştirilmiş kapsamlı bir ticaret çözümüdür. 10'dan fazla premium göstergeyi birleştiriyor ve 7'den fazla
Divergence Bomber
Ihor Otkydach
4.9 (80)
Bu göstergeyi satın alan herkese aşağıdaki ekstra içerikler ücretsiz olarak sunulmaktadır: Her işlemi otomatik olarak yöneten, Stop Loss ve Take Profit seviyelerini ayarlayan ve işlemleri strateji kurallarına göre kapatan özel yardımcı araç: "Bomber Utility" Göstergenin farklı varlıklar üzerinde kullanılmasına yönelik ayar dosyaları (set dosyaları) Bomber Utility için 3 farklı modda kullanım sunan ayar dosyaları: "Minimum Risk", "Dengeli Risk" ve "Bekle-Gör Stratejisi" Bu ticaret stratejisini hı
*** Entry In The Zone ve SMC Multi Timeframe, Smart Money Concepts (SMC) çerçevesine dayalı olarak geliştirilmiş gerçek zamanlı bir piyasa analiz aracıdır. Entry In The Zone ve SMC Multi Timeframe, yatırımcıların piyasa yapısını daha sistematik ve net bir şekilde analiz etmelerine yardımcı olmak, işlem verimliliğini artırmak ve stratejiniz için uzun vadeli sürdürülebilirlik yaratmak amacıyla geliştirilmiştir. Bu araç, Smart Money Concepts (SMC) çerçevesine dayanmaktadır. Birden fazla zaman dilim
Atomic Analyst MT5
Issam Kassas
4.19 (27)
Öncelikle belirtmek gerekir ki bu Ticaret Göstergesi Yeniden Çizim Yapmaz, Gecikmez ve Gecikme Göstermez, bu da hem manuel hem de robot ticareti için ideal hale getirir. Kullanıcı kılavuzu: ayarlar, girişler ve strateji. Atom Analisti, Piyasada Daha İyi Bir Avantaj Bulmak İçin Fiyatın Gücünü ve Momentumunu Kullanan PA Fiyat Hareketi Göstergesidir. Gürültüleri ve Yanlış Sinyalleri Kaldırmaya ve Ticaret Potansiyelini Artırmaya Yardımcı Olan Gelişmiş Filtrelerle Donatılmıştır. Birden fazla katmanl
SuperScalp Pro
Van Minh Nguyen
5 (1)
SuperScalp Pro – Gelişmiş Çoklu Filtreli Scalping Gösterge Sistemi SuperScalp Pro, klasik Supertrend ile çok sayıda akıllı onay filtresini birleştiren gelişmiş bir scalping gösterge sistemidir. Gösterge M1’den H4’e kadar tüm zaman dilimlerinde verimli çalışır ve özellikle XAUUSD, BTCUSD ve ana Forex pariteleri için uygundur. Bağımsız bir sistem olarak kullanılabilir veya mevcut ticaret stratejilerine esnek şekilde entegre edilebilir. Gösterge, hız ve yavaş EMA’lar, trend belirleyen üç EMA, EMA e
FX Power MT5 NG
Daniel Stein
5 (29)
FX Power: Daha Akıllı Ticaret Kararları için Para Birimlerinin Gücünü Analiz Edin Genel Bakış FX Power , her piyasa koşulunda başlıca para birimlerinin ve altının gerçek gücünü anlamak için vazgeçilmez bir araçtır. Güçlü para birimlerini alıp zayıf olanları satarak, FX Power ticaret kararlarınızı basitleştirir ve yüksek olasılıklı fırsatları ortaya çıkarır. İster trendlere sadık kalın ister Delta'nın aşırı değerlerini kullanarak tersine dönüşleri öngörün, bu araç ticaret tarzınıza mükemmel bir
Azimuth Pro
Ottaviano De Cicco
5 (1)
LAUNCH PROMO Azimuth Pro price is initially set at 299$ for the first 100 buyers. Final price will be 499$ . THE DIFFERENCE BETWEEN RETAIL AND INSTITUTIONAL ENTRIES ISN'T THE INDICATOR — IT'S THE LOCATION. Most traders enter at arbitrary price levels, chasing momentum or reacting to lagging signals. Institutions wait for price to reach structured levels where supply and demand actually shift. Azimuth Pro maps these levels automatically: swing-anchored VWAP, multi-timeframe structure lines, an
Quantum Trend Sniper
Bogdan Ion Puscasu
4.74 (53)
Tanıtım       Kuantum Trend Keskin Nişancı Göstergesi   , trend tersine dönmeleri belirleme ve ticaret yapma şeklinizi değiştiren çığır açan MQL5 Göstergesi! 13 yılı aşkın ticaret tecrübesine sahip deneyimli tüccarlardan oluşan bir ekip tarafından geliştirilmiştir.       Kuantum Trend Keskin Nişancı Göstergesi       trend dönüşlerini son derece yüksek doğrulukla belirlemenin yenilikçi yolu ile ticaret yolculuğunuzu yeni zirvelere taşımak için tasarlanmıştır. ***Kuantum Trend Keskin Nişancı Göst
Super Signal – Skyblade Edition Profesyonel No-Repaint / Gecikmesiz Trend Sinyal Sistemi, Olağanüstü Kazanma Oranı ile | MT4 / MT5 için 1 dakika, 5 dakika ve 15 dakika gibi daha düşük zaman dilimlerinde en iyi şekilde çalışır. Temel Özellikler: Super Signal – Skyblade Edition, özellikle trend bazlı işlemler için geliştirilmiş akıllı bir sinyal sistemidir. Yalnızca güçlü, yönlü ve gerçek momentum destekli piyasa hareketlerini tespit etmek amacıyla çok katmanlı bir filtreleme yapısı kullanır.
Protect against whipsaws: revolutionize your swing trading approach Swing Trading is the first indicator designed to detect swings in the direction of the trend and possible reversal swings. It uses the baseline swing trading approach, widely described in trading literature. The indicator studies several price and time vectors to track the aggregate trend direction and detects situations in which the market is oversold or overbought and ready to correct. [ Installation Guide | Update Guide | Tro
ÜCRETSİZ AUX Göstergesi ve EA Desteğini Alın  Doğrudan indirme — Buraya tıklayın [ D.I.C.E ] The DICE Indicator  Divergence in Chaos Environment, Elliott Dalga Teorisi’ni Trading Chaos teknikleriyle birleştiren trader’lar için geliştirilmiş özel bir MT5 aracıdır. Bill Williams’ın tanımladığı kaotik piyasa ortamıyla senkronize olarak fiyat hareketlerindeki gizli ve normal uyumsuzlukları tespit eder. Ana Özellikler Elliott Dalgası Uyumlu Uyumsuzluk: Dalga yapılarıyla uyumlu boğa ve ayı uyumsuzluk
ARICoins
Temirlan Kdyrkhan
ARICoin is a powerful trading companion designed to generate high-probability entry signals with dynamic TP/SL/DP levels based on volatility. Built-in performance tracking shows win/loss stats, PP1/PP2 hits, and success rates all updated live. Key Features: Buy/Sell signals with adaptive volatility bands Real-time TP/SL/DP levels based on ATR Built-in MA Filter with optional ATR/StdDev volatility Performance stats panel (Success, Profit/Loss, PP1/PP2) Alerts via popup, sound, push, or email Cust
Trend Forecaster
Alexey Minkov
5 (7)
The Trend Forecaster indicator utilizes a unique proprietary algorithm to determine entry points for a breakout trading strategy. The indicator identifies price clusters, analyzes price movement near levels, and provides a signal when the price breaks through a level. The Trend Forecaster indicator is suitable for all financial assets, including currencies (Forex), metals, stocks, indices, and cryptocurrencies. You can also adjust the indicator to work on any time frames, although it is recommen
ARIScalping
Temirlan Kdyrkhan
ARIScalp is a powerful trading companion designed to generate high-probability entry signals with dynamic TP/SL/DP levels based on volatility. Built-in performance tracking shows win/loss stats, PP1/PP2 hits, and success rates all updated live. Key Features: Buy/Sell signals with adaptive volatility bands Real-time TP/SL/DP levels based on ATR Built-in MA Filter with optional ATR/StdDev volatility Performance stats panel (Success, Profit/Loss, PP1/PP2) Alerts via popup, sound, push, or email Cus
Trend indicator AI mt5
Ramil Minniakhmetov
5 (13)
Trend Ai göstergesi, trend tanımlamasını işlem yapılabilir giriş noktaları ve geri dönüş uyarılarıyla birleştirerek bir yatırımcının piyasa analizini geliştirecek harika bir araçtır. Bu gösterge, kullanıcıların forex piyasasının karmaşıklıklarında güvenle ve hassasiyetle yol almalarını sağlar. Birincil sinyallerin ötesinde, Trend Ai göstergesi geri çekilmeler veya düzeltmeler sırasında ortaya çıkan ikincil giriş noktalarını belirleyerek, yatırımcıların belirlenen trend içindeki fiyat düzeltmele
Quantum TrendPulse
Bogdan Ion Puscasu
5 (20)
SuperTrend   ,   RSI   ve   Stochastic'in   gücünü tek bir kapsamlı göstergede birleştirerek işlem potansiyelinizi en üst düzeye çıkaran nihai işlem aracı olan   Quantum TrendPulse'u   tanıtıyoruz. Hassasiyet ve verimlilik arayan yatırımcılar için tasarlanan bu gösterge, piyasa trendlerini, momentum değişimlerini ve en uygun giriş ve çıkış noktalarını güvenle belirlemenize yardımcı olur. Temel Özellikler: SuperTrend Entegrasyonu:   Güncel piyasa trendlerini kolayca takip edin ve karlılık dalgası
MetaForecast M5
Vahidreza Heidar Gholami
5 (3)
MetaForecast, fiyat verilerindeki harmonileri kullanarak herhangi bir piyasanın geleceğini tahmin eder ve görselleştirir. Piyasa her zaman tahmin edilemezken, fiyatlarda bir desen varsa, MetaForecast geleceği mümkün olduğunca doğru bir şekilde tahmin edebilir. Benzer ürünlere göre, MetaForecast piyasa eğilimlerini analiz ederek daha kesin sonuçlar üretebilir. Giriş Parametreleri Past size (Geçmiş boyut) MetaForecast'ın gelecekteki tahminler oluşturmak için kullandığı çubuk sayısını belirtir. Mo
MT4 / MT5 için Astronomi Göstergesini Tanıtıyoruz: En İleri Göksel Ticaret Arkadaşınız Ticaret deneyiminizi göksel seviyelere yükseltmeye hazır mısınız? MT4 için devrim niteliğindeki Astronomi Göstergemizi arayın. Bu yenilikçi araç karmaşık algoritmaları kullanarak eşsiz astronomik içgörüler ve hassas hesaplamalar sunmak için geleneksel ticaret göstergelerini aşmaktadır. Bilgi Evreni Parmaklarınızın Ucunda:   Göksel verilerin hazinelerini açığa çıkaran kapsamlı bir paneli gözlemleyin. Gezegenl
Gold Sniper Scalper Pro
Ich Khiem Nguyen
3.5 (8)
Gold Sniper Scalper Pro, trader'ların giriş noktalarını belirlemesine ve riski etkili bir şekilde yönetmesine destek olmak için tasarlanmış MetaTrader 5 için profesyonel bir göstergedir. Gösterge, sinyal tespit sistemi, otomatik Entry/SL/TP yönetimi, hacim analizi ve gerçek zamanlı performans istatistikleri içeren kapsamlı bir analiz araçları seti sunar. Sistemi anlamak için kullanım kılavuzu   |   Diğer diller için kullanım kılavuzu ANA ÖZELLİKLER Sinyal tespit sistemi Gösterge, price action a
TPSproTREND PrO MT5
Roman Podpora
4.74 (19)
TPSproTrend PRO, piyasanın yön değiştirdiği anı belirler ve hareketin başlangıcında bir giriş noktası oluşturur. Piyasaya, fiyat hareketi henüz yeni başladığı anda girersiniz, hareket gerçekleştikten sonra değil.   Gösterge       Sinyalleri yeniden çizmez ve giriş noktalarını, Zarar Durdurma ve Kar Al seviyelerini otomatik olarak göstererek alım satımı net, görsel ve yapılandırılmış hale getirir. RUSÇA TALİMATLAR   -   MT4 SÜRÜMÜ Başlıca avantajlar Yeniden çizim yapılmadan sinyaller.   Tüm sinya
Advanced Supply Demand MT5
Bernhard Schweigert
4.5 (14)
Herhangi bir Acemi veya Uzman Tüccar için En İyi Çözüm! Bu gösterge benzersiz, yüksek kaliteli ve uygun fiyatlı bir ticaret aracıdır çünkü bir dizi tescilli özelliği ve yeni bir formülü bir araya getirdik. Bu güncelleme ile çift zaman dilimi dilimlerini gösterebileceksiniz. Yalnızca daha yüksek bir TF gösteremeyeceksiniz, aynı zamanda TF grafiğini ve ARTIK daha yüksek TF'yi de gösterebileceksiniz: YUVARLAK BÖLGELERİ GÖSTERMEK. Tüm Arz Talebi tüccarları buna bayılacak. :) Önemli Bilgiler Açıkland
Trade smarter, not harder: Empower your trading with Harmonacci Patterns This is arguably the most complete harmonic price formation auto-recognition indicator you can find for the MetaTrader Platform. It detects 19 different patterns, takes fibonacci projections as seriously as you do, displays the Potential Reversal Zone (PRZ) and finds suitable stop-loss and take-profit levels. [ Installation Guide | Update Guide | Troubleshooting | FAQ | All Products ] It detects 19 different harmonic pri
Grabber System MT5
Ihor Otkydach
4.81 (21)
Size mükemmel bir teknik gösterge olan Grabber’ı tanıtıyorum. Bu araç, kullanıma hazır bir “her şey dahil” işlem stratejisi olarak çalışır. Tek bir yazılım kodu içinde güçlü piyasa teknik analiz araçları, işlem sinyalleri (oklar), uyarı işlevleri ve push bildirimleri entegre edilmiştir. Bu göstergeyi satın alan herkes aşağıdaki hediyeleri ücretsiz olarak alır: Açık emirleri otomatik yönetmek için Grabber Yardımcı Aracı Kurulum, yapılandırma ve nasıl işlem yapılacağını adım adım anlatan video kıl
Golden Spike Premium
Kwaku Bondzie Ghartey
5 (1)
Golden Spikes Indicator Technical indicator for synthetic indices trading on M1 timeframe. Compatible with Boom/Crash indices on Deriv platform and Gain/Pain indices on Weltrade platform. send me A private  message to receive trade ASISTANT EA.. booklet guide:  https://drive.google.com/file/d/1knQJqGHZSP5eQN24ndRz2ayZVCst6XhN/view?usp=sharing Also check my premium spikes bot: https://www.mql5.com/en/market/product/142350 Features Uses Parabolic SAR, RSI, and Bollinger Bands analysis Three risk
ARIPoint
Temirlan Kdyrkhan
1 (1)
ARIPoint is a powerful trading companion designed to generate high-probability entry signals with dynamic TP/SL/DP levels based on volatility. Built-in performance tracking shows win/loss stats, PP1/PP2 hits, and success rates all updated live. Key Features: Buy/Sell signals with adaptive volatility bands Real-time TP/SL/DP levels based on ATR Built-in MA Filter with optional ATR/StdDev volatility Performance stats panel (Success, Profit/Loss, PP1/PP2) Alerts via popup, sound, push, or email Cu
Shock Pullback
Suleiman Alhawamdah
5 (1)
Basitçe söylemek gerekirse, mevcut mum çubuğunun yanında “pip” olarak bilinen beyaz sayıların hareketi görünmeye başladığında işlem yapmaya başlayabilirsiniz. Beyaz “pip”ler, bir alım veya satım işleminin şu anda aktif olduğunu ve beyaz renkleriyle belirtildiği gibi doğru yönde ilerlediğini gösterir. Beyaz pip hareketi durduğunda ve sabit yeşil renge dönüştüğünde, bu mevcut ivmenin sona erdiğini gösterir. Sayıların yeşil rengi, alım veya satım işlemiyle elde edilen toplam kârı “pip” cinsinden t
Market Structure Patterns
Samuel Manoel De Souza
4.47 (19)
Uygun sürümler:   MT4   ve   MT5 . Market Structure Patterns kanalına katılın – çalışma materyallerini indirin ve ek bilgiler edinin. İlgili gönderiler: Market Structure Patterns – Giriş Şimdi %50 indirimle edinin | Önceki fiyat 90 $ | Kampanya 31 Aralık tarihine kadar geçerlidir | Büyük bir güncelleme yakında geliyor ve orijinal fiyat güncellenecektir. Market Structure Patterns , smart money concepts (akıllı para kavramları) temelinde geliştirilen ve SMC/ICT öğelerini grafik üzerinde gösteren
Öncelikle, bu Ticaret Aracının Non-Repainting, Non-Redrawing ve Non-Lagging Gösterge olduğunu vurgulamakta fayda var, bu da onu profesyonel ticaret için ideal hale getiriyor. Çevrimiçi kurs, kullanıcı kılavuzu ve demo. Akıllı Fiyat Hareketi Kavramları Göstergesi, hem yeni hem de deneyimli tüccarlar için çok güçlü bir araçtır. İleri ticaret fikirlerini, Inner Circle Trader Analizi ve Smart Money Concepts Ticaret Stratejileri gibi 20'den fazla kullanışlı göstergeyi bir araya getirerek bir araya
Blahtech Supply Demand MT5
Blahtech Limited
4.54 (13)
Was: $299  Now: $99  Supply Demand uses previous price action to identify potential imbalances between buyers and sellers. The key is to identify the better odds zones, not just the untouched ones. Blahtech Supply Demand indicator delivers functionality previously unavailable on any trading platform. This 4-in-1 indicator not only highlights the higher probability zones using a multi-criteria strength engine, but also combines it with multi-timeframe trend analysis, previously confirmed swings a
Gartley Hunter Multi
Siarhei Vashchylka
5 (11)
Gartley Hunter Multi - An indicator for searching for harmonic patterns simultaneously on dozens of trading instruments and on all possible timeframes. Manual (Be sure to read before purchasing) | Version for MT4 Advantages 1. Patterns: Gartley, Butterfly, Shark, Crab. Bat, Alternate Bat, Deep Crab, Cypher 2. Simultaneous search for patterns on dozens of trading instruments and on all possible timeframes 3. Search for patterns of all possible sizes. From the smallest to the largest 4. All fou
Yazarın diğer ürünleri
Linear Regression Angle is a directional movement indicator which defines a trend at the moment of its birth, and additionally defines trend weakening. The indicator calculates the angle of the linear regression channel and displays it in a separate window in the form of histogram. The signal line is a simple average of the angle. The angle is the difference between the right and left edges of regression (in points), divided by its period. The angle value above 0 indicates an uptrend. The higher
The Regression Momentum is an indicator of directional movement, built as the relative difference between the linear regression at the current moment and n bars ago. The indicator displays the calculated Momentum in a separate window as a histogram. The signal line is a simple average of the histogram. The histogram value above 0 indicates an uptrend. The higher the value, the stronger the trend. A value below 0 indicates a downtrend. The lower the value, the stronger the downtrend. Intersection
Adaptive trailing uses rsi Adaptive trailing uses rsi - это скрипт, который  реализует трейлинг, а именно: вычисляет уровень защитного стопа, отображает  уровни на графике, исполняет заданные пользователем торговые операции при достижении ценой стоп уровня.  Режимы работы.  Трейлинг может осуществляться как снизу, когда уровень стопа ниже текущей цены и подтягивается за ценой, если она возрастает, так и сверху, когда уровни стопа выше текущей цены. Предусмотрено два режима расчета стоп уровня .
Trailing Uses Standard Deviation.   A daptive_Trailing_uses_StdDev_Indicator is an indicator of directional movement that allows you to identify a trend at the time of its inception and set the levels of a protective stop. Unlike trailing with a constant distance, the indicator uses the distance to the price proportional to the current standard deviation of StdDev. The distance is equal to the product of the standard deviation and the constant coefficient set by the user. Thus, the trailing
Adaptive Trailing uses RSI Indicator - an indicator of directional movement that allows you to determine the trend at the time of its inception and set the levels of a protective stop. Trailing can be carried out both from below, when the stop level is below the current price and is pulled up behind the price if it increases, and above, when stop levels are above the current price. There are two modes for calculating the stop level. Simple trailing is done with a constant distance of Npoints
- This is an indicator of directional movement that allows you to determine the trend at the time of its inception and set the levels of a protective stop. Trailing can be carried out both from below, when the stop level is below the current price and is pulled up behind the price if it increases, and above, when stop levels are above the current price. Unlike trailing with a constant distance, the stop level is set at the lower boundary of the quadratic regression channel (in the case of tra
Filtrele:
İnceleme yok
İncelemeye yanıt