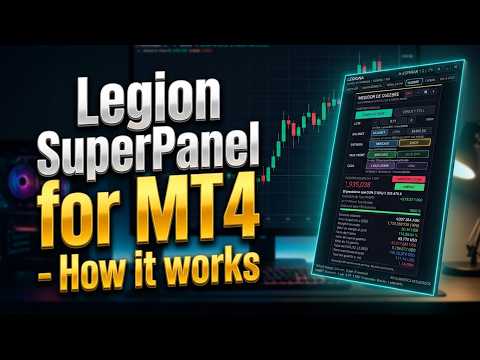
Legion SuperPanel

Tek grafik. Dokuz zaman dilimi. Net bir okuma.

Çoğu trader RSI'ı bir pencerede, ADX'i başka bir pencerede, seansları üçüncü bir grafikte takip eder ve yanında bir hesap makinesi açık tutar. Her şey kontrol edildiğinde tablo dağılmış olur ve karar aceleyle verilir.

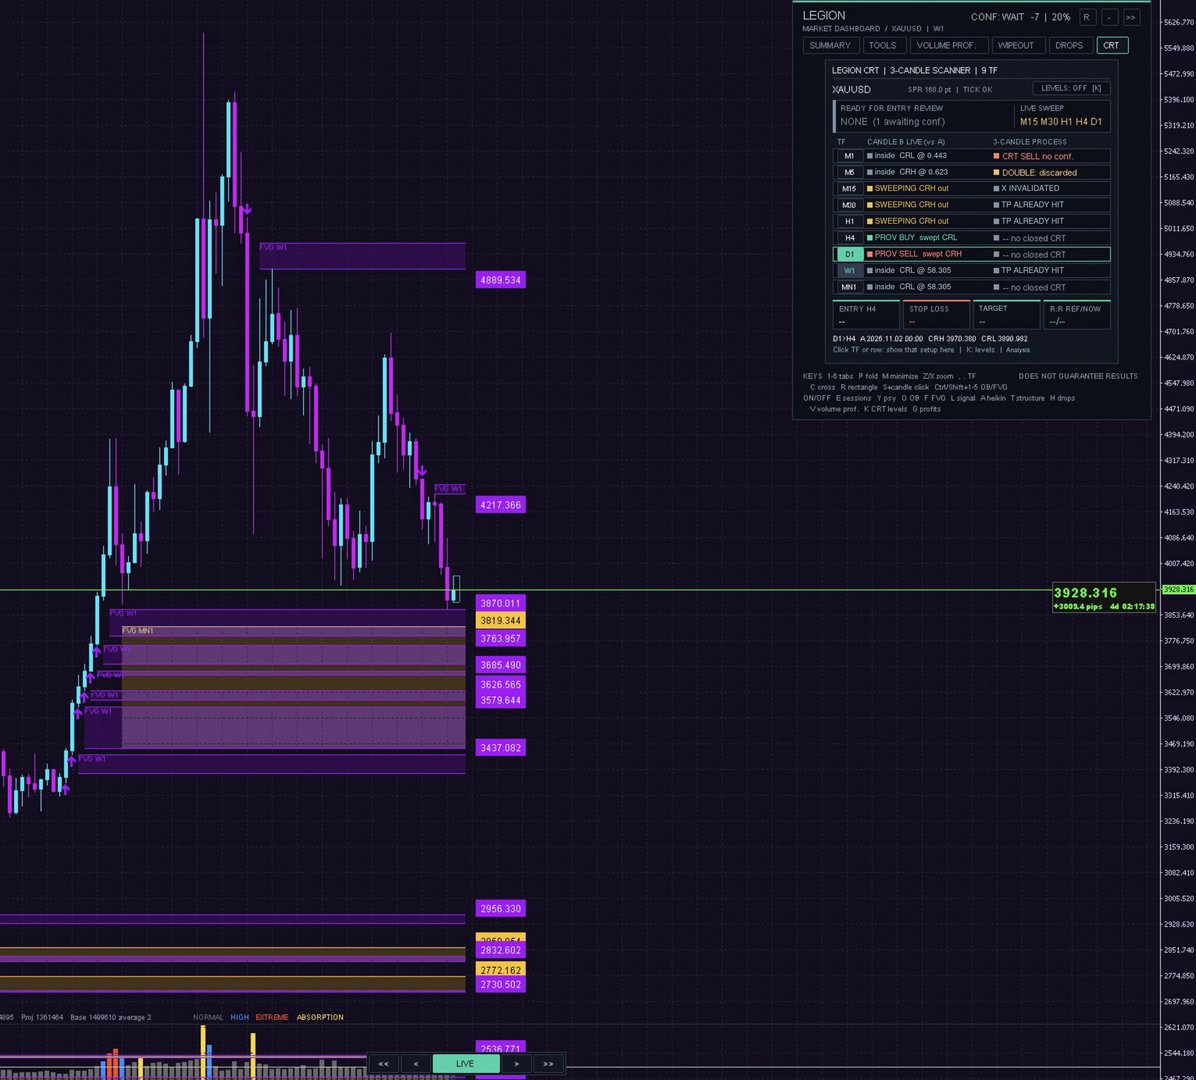
Legion SuperPanel tüm bunları grafiğinizdeki tek bir panelde toplar ve okumaların nerede uyuştuğunu, nerede uyuşmadığını size sade bir dille söyler. Pencereler arasında geçiş yapmayı bırakır, piyasayı bir bütün olarak okumaya başlarsınız.

Panel yalnızca bilgi amaçlıdır. Emir açmaz, değiştirmez veya kapatmaz: her karar sizin elinizde kalır.

Bir bakışta gördükleriniz

  • Yön ve uyum: -100 ile +100 arasında bir confluence (uyum) skoru ve bir güven yüzdesi.
  • Fiyat nerede: Bid'in H4, D1, W1 veya MN1'deki bir order block ya da dengesizlik (FVG) içinde olup olmadığı ve ne kadar derine girdiği.
  • Eksik olan ne: her koşulu MET, ALMOST veya MISSING olarak işaretleyen bir kontrol listesi; böylece neyi beklemeniz gerektiğini bilirsiniz.
  • Parasal riskiniz: margin call, stop out ve take profit seviyeleri, işlem açmadan önce grafikte çizilir.

Altı sekme, tek panel

SUMMARY Hesap, Confluence Status, Legion kontrol listesi, OB + FVG, Aktif Bölgeler, RSI Paneli, ADX Gun, çoklu zaman dilimi yapısı, FlowPulse, parite gücü ve Heikin Ashi.
TOOLS Seanslar ve psikolojik seviyeler, renk şablonları ve fiyat etiketli dikdörtgenler.
VOLUME PROF. Herhangi bir mumun hacim profili ve ana mum kapanışının kendi aralığı içindeki konumu.
WIPEOUT Sermayenize göre stop out, margin call, take profit ve lot büyüklüğünü gösteren pozisyon simülatörü.
DROPS Endeksler, altın ve bitcoin'deki en büyük tarihsel düşüşler ve mevcut düşüş.
CRT M1'den MN1'e üç mum aralığı (range) tarayıcısı.

SUMMARY sekmesi birkaç saniyede nasıl okunur

  1. Başlık: grafiğin genel eğilimi (örneğin SELL BIAS -52 | 76%) her zaman en üstte görünür.
  2. Uyum: her modül kendi oyunu gösterir (FLOW, PAIR, RSI, ADX, STRUCT, CANDLE) ve skor çubuğu SELL'den BUY'a uzanır. Kısa bir cümle okumayı açıklar.
  3. Legion kontrol listesi: akış, parite gücü, RSI, ADX formasyonu, yapı ve Heikin Ashi; her biri MET, ALMOST veya MISSING olarak işaretlenir. Ayrıca son mum formasyonu ve göreceli hacim de gösterilir.
  4. OB + FVG ve Aktif Bölgeler: her zaman dilimini tek tıkla açıp kapatın ve fiyatın bir bölgenin içinde olup olmadığını ya da en yakın bölgenin ne kadar uzakta olduğunu metin olarak okuyun.
  5. RSI Paneli ve ADX Gun: M1'den D1'e değişim ve seri bilgisiyle RSI; ayrıca 9 zaman diliminde (M1'den MN1'e) 5 periyotluk (7, 21, 42, 89, 144) bir ADX tablosu.
  6. MTF yapısı: MN'den M1'e her zaman dilimi yükseliş veya düşüş olarak işaretlenir; fazı (itki, düzeltme veya CHoCH), kilit seviyesi ve mesafesiyle birlikte zaman dilimlerinin hizalı olup olmadığı da gösterilir.
  7. FlowPulse: 8 günden 1 dakikaya kadar zaman penceresine göre akışın yönü ve gücü.

Tüm modüller

Confluence Status Kaç modülün aynı yönde uyuştuğunu gösteren -100 ile +100 arasında bir skor: RSI, ADX, FlowPulse, parite gücü, ATR itki yapısı ve ana mumun hacim profili. Modüller arasındaki uyumu ölçer; bir başarı olasılığı değildir. Ağırlıklar ve eşikler ayarlanabilir.
Aktif Bölgeler Bid'in H4, D1, W1 veya MN1'de bir order block ya da dengesizlik (FVG) içinde olup olmadığını; bölge aralığı, yönü ve nüfuz derinliğiyle birlikte gösterir. Aktif bölge yoksa en yakın bölgeyi ve mesafesini gösterir.
Order Block ve FVG Radarı H1'den MN1'e kadar, mitigasyon takibi ve her zaman dilimi için bir durum ışığı içeren bölgeler. Etiketler, dolgu ve başlangıç işareti açılıp kapatılabilir.
RSI Paneli Her zaman dilimi için RSI değeri, önceki muma göre değişim ve seri; genel eğilim, güç ve momentum okumasıyla birlikte.
ADX Gun MTF Dokuz zaman diliminde beş periyotluk ADX tablosu; formasyon oluştuğunda izleme durumu gösterir.
Parite Gücü ve FlowPulse Baz ve kote para birimlerinin göreceli gücü ile zaman pencerelerine göre akış okuması.
Çoklu zaman dilimi yapısı MN'den M1'e ATR tabanlı itkiler; faz, kilit seviye ve hizalanma durumu ile.
CRT Tarayıcı M1'den MN1'e üç mum aralığı kurulumları; alt zaman diliminde onay ve 1, 2 ve 3 numaralı mumlar için seviyelerle. Bir satıra tıklamak, zaman dilimini değiştirmeden o kurulumu grafikte gösterir.
Hacim Profili Seçtiğiniz herhangi bir mumun hacim profili, seans profili ve mumların altında bir hacim histogramı.
Seanslar ve psikolojik seviyeler Başlıca işlem seansları için kutular ve yuvarlak sayı seviyeleri.
Tarihsel düşüşler Endeksler, altın ve bitcoin'deki en büyük tarihsel düşüşler, mevcut düşüş ve sermayenize göre en büyük tarihsel düşüşe dayanabilecek lot büyüklüğü.
Hesap ve pozisyon Bakiye, varlık (equity), değişken sonuç, marjin seviyesi, USD ve MXN cinsinden pozisyon değeri, kullanılan kaldıraç ile margin call ve stop out fiyatları.
Wipeout ölçer ve TP görüntüleyici Bir pozisyonu simüle eder ve stop out, margin call ve take profit seviyelerini çizer; take profit'teki brüt tutarı da gösterir (komisyon ve swap dahil değildir).

Dahil olan ek araçlar

  • Üç modlu artı imleç: yüzde, normal ve lot büyüklüğü.
  • Büyük BID / ASK göstergesi, grafik sıfırlayıcı ve mum gezinme düğmeleri.
  • Fiyat etiketli dikdörtgenler, Heikin Ashi mumları ve zaman dilimi kısayol tuşları.
  • Dikey, kompakt veya yatay yerleşim ve çeşitli renk temaları.
  • İngilizce veya İspanyolca arayüz.
  • Seçilen modüller için isteğe bağlı uyarılar (açılır pencere ve push bildirimleri).

Kimler için

  • Order block, FVG ve piyasa yapısı kullanan ve tüm zaman dilimlerini görmek isteyen traderlar.
  • İşleme girmeden önce bir uyum okuması isteyen forex, altın ve hisse endeksi traderları.
  • Bir pozisyonun margin call ve stop out seviyelerini açmadan önce görmek isteyen herkes.

Satın almadan önce deneyin

Ücretsiz demoyu indirin ve paneli Strateji Test Cihazı'nda görsel modda çalıştırın. Ayrıca bir aylığına kiralayıp sonra karar verebilirsiniz.

Klavye kısayolları (varsayılan)

1-6 Sekme değiştir P / M Daralt / küçült
Z / X Yakınlaştır / uzaklaştır C Artı imleç
O / F Order Block / FVG E / Y Seanslar / psikolojik seviyeler
V Hacim Profili K CRT seviyeleri
R 2 tıkla dikdörtgen , / . Alt / üst zaman dilimi

Tüm tuşlar girdi parametrelerinden değiştirilebilir.

Kurulum

  1. Göstergeyi herhangi bir grafiğe ekleyin.
  2. Seansların ve hacim profilinin doğru hizalanması için brokerınızın sunucu saati farkını "Server time" girdi grubunda ayarlayın. Algılanan sunucu saati uyuşmazsa panel sizi uyarır.
  3. Yerleşimi ve dili ilk girdi grubunda seçin.

Ana girdi grupları: Dashboard ve görünüm, Uyum, Hesap ve pozisyon, RSI, ADX Gun, Parite gücü, FlowPulse, Hacim, Server time ve seanslar, Heikin Ashi, Şablonlar, Hacim Profili, Wipeout ölçer, Tarihsel düşüşler, Smart OB, FVG Radarı, Dikdörtgenler, CRT Tarayıcı, BID / ASK, Chart Resetter ve TP görüntüleyici.

Her sembol ve zaman diliminde çalışır. Ağırlıklı olarak forex, altın ve hisse endeksleri için tasarlanmıştır.

Destek

Sorular ve öneriler bu ürünün yorumlar bölümünde ve MQL5 özel mesajları aracılığıyla yanıtlanır.

Bu gösterge bir analiz aracıdır ve sonuç garanti etmez. Kaldıraçlı ürünlerle işlem yapmak yüksek kayıp riski içerir.
Önerilen ürünler
ToolBox 360 is the swiss knife of all indicators. It is full packed with useful tools to help you with your trading. It can be used to find best entry and exit points and help you to decide if you should open a trade or not. It shows market trends, candlestick formations outside / inside bars and you can sett time based allerts. Main features: Time based Fibonacci lines Choose a start and end time and the indicator shows you Fibonacci lines within the selected time range including range high a
Power Average
Khurram Mustafa
4.25 (4)
This Indicator is a affordable trading tool because with the help of Popular Developers & Support of M Q L Platform I have programmed this strategy. I tried to combine logic of Moving Averages, Parabolic Stop And Reverse, Trend Strength, Oversold, Overbought . Furthermore, I have also care about Support Resistance that Trader can easily get in touch with market by selecting one indicator only. What is in for Trader? Trading Modes: This selection is for activate whole strategy "Power Average" Sp
FREE
Gann Box MT4
Frederic Jacques Collomb
5 (1)
Gann Box göstergesi, trader'ların piyasanın kilit seviyelerini tanımlamalarına ve bunlardan yararlanmalarına yardımcı olmak için tasarlanmış güçlü ve çok yönlü bir araçtır. Bu gösterge, grafiğe bir dikdörtgen çizmeyi sağlar ve bu dikdörtgen otomatik olarak stratejik seviyeler olan 0, 0.25, 0.50, 0.75, 1 ile birkaç bölgeye ayrılır. Fiyat bu seviyelerden birine ulaştığında, alarmlar tetiklenir ve bu, ticaret kararları için değerli bir destek sağlar. Çizdiğiniz bölgeye göre piyasanın gelişimini an
Dynamic Range Indicator for MQL4 Introducing our cutting-edge Dynamic Range Indicator , specifically designed for 5-minute charts, featuring a proven back-testing record to ensure reliable performance. Key Features: Blue and Red Lines: The indicator uses two dynamic lines to represent market volatility. Calculation Method: The lines are constructed using the last 14 days' average absolute movement of 5-minute closing prices, multiplied by today's session open price. Indicator Formula: Today's op
Octo Tack
Rafael Vega Ruiz
OCTO TACK TREND INDICATOR Summary/Description: Trend indicator showing signals to execute orders in favor of the current trend Get ready to have the best trend indicator you've ever tried. No repainting in any way, guaranteed It generates clear signals and always in favor of the trend (see screenshots) You just have to wait for the alert to indicate it and earn pip Are you tired of indicators that never work? Here we have the solution, try the free version and if you want to have more signals
FREE
LEFORT is a multi-currency, fully automatic, high-frequency trading robot. The robot works with any instruments in MT4 on any timeframe. The algorithm of the expert Advisor is as follows Single-scalping trades will. Using the analytical signals module, the robot analyzes the market dynamics, and then makes single trades in the direction of the dominant trend with a profit of several pips. A series of open orders. The robot makes a series of trades on a pullback in the direction of the dominant t
Candles length
Hafis Mohamed Yacine
Candles length indicator is, as the name suggests, an indicator that displays the body size of each candle. The nominal size is placed below each bearish candle and below each bullish candle. How to install the Candles length Indicator on your Metatrader 4 trading plaftform? Download the indicator Copy and paste the Candle Body Size Indicator files into following folder of your Metatrader 4 (MT4) platform: MQL4 > Indicators. You can gain access to the folders this way: File > Open Data Folder >
Mongol indicator
Sumiyabazar Buyanjargal
It's a variation of mid of HH and LL since it compares the higher of HH or LL against a period and twice the number of bars back to avoid whipsaws. I used to display this against lines on a chart, but made a histogram out of it and it looks interesting. It looks good at gauging trend strength and general turns (see image below). The name of the indicator is BAM, which is an acronym for "Below and Above Mid". Ways to use it: 1. To see general trend on longer TFs (more than 60 bars back).
Ultimate ADX Multi-timeframe Indicator This indicator provides real-time ADX values for multiple timeframes in one unobtrusive label panel. It i s especially useful for gauging trend strength across timeframes without constantly switching charts. Choose which periods to display, anchor the panel to any chart corner, and color-code ADX strength levels to your taste. Key Features & Personalization Multi-Timeframe ADX - Toggle visibility for 9 built-in periods (M1, M5, M15, M30, H1, H4, D1, W1, MN1
FREE
FFXMV Dashboard Plus
Opengates Success International
Full Forex Market View Dashboard Plus This is a custom indicator created to give Traders a full view of what is going on in the market. It uses a real time data to access the market and display every bit of information needed to make successful trading. The PLUS there to produce the kind of RESULTS as you see in the SCREENSHOTS, I added a MultipleOrder Utility EA with it with instructions on how to use it with FFXMV Dashboard. INSTALLATION : Read the MANUALS that comes with the rest of the PAC
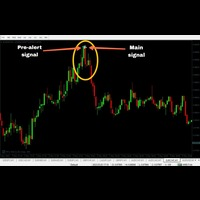
This Indicator has a accuracy in between 80-90% but it will work one time in a day. The timing is (MT4 time 18:00 to 18:05) Tickmill, Alpari, Amarket MT4 recommended. Although it will work on most of the MT4.  MT2 Auto trading supported: Buy buffer = 2 //  Sell buffer = 3 Intrabar Candle TF = M1 Trade Expiry = 1 minute or 5 minutes No martingale required, but if you wish then you can take 1 step martingale. Features: Neural Network based Advance price action algorithms Advance consolidation fi
FTC Neuro
Aliaksandr Ausiyevich
Yenilikçi ticaret çözümleri dünyasına hoş geldiniz! Güncel makroekonomik istatistikler ve modern sinir ağı hesaplamaları temelinde çalışan gelişmiş FTC Neuro ticaret danışmanımıza dikkatinizi çekiyoruz. Piyasa durumunu karmaşık algoritmalarla analiz ederek danışman, gelişmiş yapay zeka algoritmalarını kullanarak ekonomik bilgilerdeki gizli modelleri tanır. Ticarete girmek ve çıkmak için benzersiz noktalar sunarak size en profesyonel ticaret deneyimini sunar. Herkes, kaliteli ticaretin her zaman
Bu gösterge, Elliott dalga teorisi ile iki şekilde çalışır: Otomatik Çalışma: Bu modda gösterge, Elliott dalga teorisine uygun olarak grafikteki beş hareket dalgasını otomatik olarak tespit edecek ve tahminlerde bulunacak, potansiyel ters dönüş bölgelerini belirleyecektir. Ayrıca, önemli gelişmeler hakkında tüccarları uyarılar ve bildirimlerle bilgilendirebilme yeteneğine sahiptir. Bu otomatik işlev, Elliott dalga desenlerinin tanımlanması ve analiz sürecini basit hale getirir. Manuel Çalışma: B
Purpose The indicator is intended for manual multi-currency trading based on the Triple Screen Strategy. It works with any symbols located in the Market Watch window of the MT4: currencies, metals, indexes, etc. The number of instruments can be limited by capacity of the МТ4's parameters. But if desired, you can create several windows with various set of instruments and parameters. Operation Principle The indicator uses the modified Triple Screen Strategy for determining trend direction in the
Candle Timer Countdown (CTC) – Minimalist ve Hassas Mum Çubuğu Sayacı Candle Timer Countdown (CTC), grafiğinizdeki mevcut mum çubuğunun kalan süresini görüntüleyen hafif ve göze batmayan bir MetaTrader göstergesidir. Basitlik ve netlik göz önünde bulundurularak tasarlanan bu araç, tüccarların grafiği kirletmeden mum kapanışlarından haberdar olmalarına yardımcı olur. Temel Özellikler: Gerçek Zamanlı Mum Geri Sayımı: Mevcut mum kapanmadan önce kaç saniye kaldığını her zaman bilin – tüm zaman dilim
FREE
Turn Every Market Reversal Into a Money-Making Opportunity With the U-turn Detector Indicator! Imagine having a tool that visually reveals the exact moment price is about to flip — before the crowd catches on. The U-turn Detector isn’t just another indicator... it's your edge in spotting clean, confident entries and exits in forex. If you've ever been frustrated by fake breakouts, late signals, or messy charts — you're about to fall in love with this tool. URGENT REMINDER: PRICE MAY DOUBLE
Zain Gold Scalping MT4 V5
Ahmed Gamal Abdel Nasser Mohamed
Zain Gold Scalping MT4 - Multi-Timeframe Technical Indicator Zain Gold Scalping MT4 is a technical analysis indicator developed for the MetaTrader 4 (MT4) platform. It provides analytical insights and multi-timeframe trend tracking for various market instruments, including precious metals and major currency pairs.  Timeframe and Market Compatibility Multiple Timeframe Support: Designed to operate across standard chart timeframes, from M1 and M5 up to higher structured timeframes like H1 and Dai
HF Crosshair
Wong Sze Wai
4.6 (5)
For some trader's charts analysis use, specially for  multi timeframe trading strategies . When you need to check something of the time within different timeframe at the same symbol chart, even different symbol charts, this indicator will show the crosshair at sync moving. You just need to load this indicator into some charts, then the crosshair will shown automatic. 
FREE
NQX Turn Pattern New York MT4, MetaTrader 4 için bir sinyal göstergesidir: dönüş formasyonu sinyalleri (yalnızca New York seansı sırasında sinyal verir (gün içi grafikler)). Kısa, üç mumluk bir dönüş formasyonunu tespit eden özel NQX mantığı. Yalnızca New York seansı sırasında sinyal verir (gün içi grafikler). Önerilen girişi, kısa bir stopu ve uzak hedefleri (3:1, 5:1, 10:1, swing'de 20:1'e kadar) çizer; kararı siz verirsiniz. Grafikte neler çizer - Kapanmış sinyal mumunun üzerinde bir ok (kapa
Great Indicator
Ruben David Santana Rodriguez
Les presento un indicador que funciona como estrategia por si solo , trabaja muy bien en periodos de 4 horas pero puedes aplicarlo a cualquier timeframe , las señales son muy faciles de interpretar , en momento en que la linea naranja pasa hacia arriba las media azul y roja , se entra en largos , la operativa se mantiene abierta hasta que la linea naranja cruce la media mas cercana ya sea la azul o la roja , si la operacion era long y la linea azul cruza hacia arriba la linea roja y la naranja c
This EA is an extension for the free trade indicator Trend Mate . https://www.mql5.com/en/market/product/50082 The main idea is to support your decision to  trade  according to the current trend. It is possible to configure alert and push notification to receive when entering to first candle for bull / bear trend. For this extension of the free indicator now it is possible to filter the current trend info with other timeframes. For example show trend for timeframe M5 considering also timeframe
The Trend Champion indicator works on all timeframes and currency pairs. The indicator should be used as an auxiliary tool for technical analysis, it helps to determine the direction of the trend: either upward or downward price movement for a particular currency pair. Can be used along with oscillators as filters. Trend Champion is a trend indicator. Arrows indicate favorable moments and directions for entering the market. The indicator can be used both for pipsing on small periods and for lo
Account History Collector Panel The Advanced History Collector Panel is a professional-grade account analysis and visualization indicator for MetaTrader. It bridges the gap between raw trading logs and actionable insights by transforming execution data into interactive charts and comprehensive tables. Key Features: Comprehensive Data Metrics : Track daily/weekly profit and loss, long/short ratios, total volume, and deposit/withdrawal history. Dynamic Visualizations : Toggle between various char
FREE
The Arrow Scalper
Fawwaz Abdulmantaser Salim Albaker
1 (2)
Dear Friend..  I share with you this simple Expert Adviser .. it is full automatic  this Expert Adviser following the trend of the pair you install on or any stocks or indices , it is works like that: - when the trend on H4 chart show a start of up trend the expert will wait till the 15M & 1H charts show an up trend the EA will open a buy order directly , and do the same for down trend and open a sell order the buy or sell  order lot size and take profit and stop loss will measured manually  by
FREE
Rira Renko
Vitor Palmeira Abbehusen
RENKO on Time Chart This indicator is an enhanced Renko, so you can watch the Renko bricks on the chart to understand price movement more clearly the other improvement is automated box size according to ATR (Average True Range) period you can set the ATR number as you want and the box size of Renko changes automatically based on price movement Inputs Mode: Box size is the input to specify the size of the Renko box you want to print on the chart. This input lets you choose the fixed box siz
MarketFlow Indies MarketFlow Indies is a clean MT5 chart indicator designed to help traders read directional flow, confirmed Buy/Sell signals, market structure, reaction zones, and spread information in one simple visual workspace. The indicator focuses on chart clarity. Signals are displayed directly on the main chart with compact Buy and Sell labels, colored flow lines, optional structure marks, and a small dashboard for quick signal review. Expert Version MT5 :  https://www.mql5.com/en/market
IMPORTANT; Price is subject to rise at any time from now! Do not miss this offer! Dear trader I am glad to introduce my new tool called Trend Analyser Dashboard to you. The design, style, and settings of this indicator  have been made simple to make its users not take too much time in understanding the indicator itself.   The purpose is to help traders in analysing the direction of the major trend and the status of the trend whether in weak trend or its strong trend. The indicator will also prov
Dynamic Forex28 Navigator
Bernhard Schweigert
4.43 (7)
Dynamic Forex28 Navigator - Yeni Nesil Forex Ticaret Aracı. ŞU ANDA %49 İNDİRİM. Dynamic Forex28 Navigator, uzun zamandır popüler olan göstergelerimizin evrimidir ve üçünün gücünü tek bir göstergede birleştirir: Gelişmiş Döviz Gücü28 Göstergesi (695 inceleme) + Gelişmiş Döviz İMPULS ve UYARI (520 inceleme) + CS28 Kombo Sinyalleri (Bonus). Gösterge hakkında ayrıntılar https://www.mql5.com/en/blogs/post/758844 Yeni Nesil Güç Göstergesi Ne Sunuyor?  Orijinallerde sevdiğiniz her şey, şimdi yeni
Trade Stats
Johannes Schoeman
Does your trading consist of Multiple EA's, Multiple time frames an no clear indication of how each individual strategy or time frame is performing, then this indicator will help. Assign the EA Magic number to this indicator and track it's performance on the chart by selecting on chart the period, today, week, month year or all history to view. Easy visual colour changing header to display the performance of the EA for the respective periods.    Minimize the panel to reduce chart clutter. Add yo
Smoothed Heiken Ashi with AC/AO Zones – Professional Trading Clarity Transform your Heiken Ashi analysis with intelligent smoothing that eliminates noise while preserving actionable signals. What Makes This Different? This isn't just another Heiken Ashi indicator. We've engineered a sophisticated smoothing engine that works with the Accelerator (AC) and Awesome Oscillator (AO) zone logic to give you cleaner entries and exits without sacrificing responsiveness. Four Smoothing Methods at Your Comm
Bu ürünün alıcıları ayrıca şunları da satın alıyor
Miraculous Indicator Binary & Forex v3 StrategySafe Miraculous Indicator Binary & Forex v3 StrategySafe , net sinyaller, güçlü onay araçları ve Binary ile Forex piyasalarında kullanılabilecek yapılandırılmış bir işlem yaklaşımı isteyen traderlar için geliştirilmiş profesyonel bir indikatördür. v3 sürümü; MIR Dashboard, Miraculous Confirmation Dashboard, GANN Law, Square of 9 seviyeleri, GANN açıları ve daha gelişmiş Forex modu ile daha güçlü bir piyasa analizi sunar. Öne çıkan özellikler Tek ind
OrderFlow Absorption – MT4 için Profesyonel Delta ve Absorpsiyon Sinyal Göstergesi OrderFlow Absorption ile gerçek emir akışı analizinin gücünü keşfedin – MetaTrader 4 için nihai delta histogramı ve absorpsiyon sinyal göstergesi. Fiyat hareketlerinin arkasında gerçekte neler olduğunu görmek isteyen traderlar için tasarlanan bu araç, piyasayı hareket ettiren gizli alım/satım baskısını ve absorpsiyon olaylarını ortaya çıkarır. Özellikler Delta Histogramı Görselleştirme:   Alım ve satım baskısını a
Meravith
Ivan Stefanov
5 (3)
Market maker aracı. Meravith şunları yapar: Tüm zaman dilimlerini analiz eder ve geçerli trendi gösterir. Alış ve satış hacimlerinin eşit olduğu likidite bölgelerini (hacim dengesi) vurgular. Farklı zaman dilimlerinden tüm likidite seviyelerini doğrudan grafiğinizde gösterir. Referansınız için metin tabanlı piyasa analizi üretir ve sunar. Mevcut trende göre hedefler, destek seviyeleri ve stop-loss noktalarını hesaplar. İşlemleriniz için risk/ödül oranını hesaplar. Hesap bakiyenize göre pozisyon

Binary Booster
Yaroslav Varankin
5 (1)
Binary Options Trading Indicator: A Reliable Tool for Your Trades This indicator is specifically designed for binary options trading and has proven its high quality, reliability, and adequate accuracy, depending on the dynamics of the chart. Key Points: Signal Interpretation: When a blue cross signal appears, it indicates a potential entry into a trade, though it is considered a weak signal on its own. However, if the blue cross is accompanied by an arrow, it is considered a more reliable buy s
First time on MetaTrader, introducing IQ Star Lines - an original Vedic Astrology based indicator. "Millionaires don't use astrology, billionaires do" . - J.P. Morgan, Legendary American financier and banker. We don't offer free or bonus indicators in exchange of reviews from you. You won't need any free products with this indicator to make it work. ;) Enjoy! Welcome to  the new and updated  IQ Star Lines , the ultimate fusion of ancient planetary harmonic cycles and modern quantitative trading.
CVD Diverjans Tespiti - Gelişmiş Hacim Delta Analizi   ÇÖZDÜĞÜMÜZ PROBLEM Çoğu trader sadece fiyat hareketine güvenir ve gerçek piyasa hissiyatını ortaya çıkaran kritik hacim akış bilgilerini kaçırır. Geleneksel göstergeler fiyat hareketlerinin gerisinde kalır, geç girişlere ve kötü risk yönetimine neden olur. CVD Diverjans Tespiti, fiyat ve hacim delta momentumu arasındaki ilişkiyi analiz ederek bunu çözer ve önemli piyasa hareketlerinden önce erken uyarı sinyalleri verir.   CVD DİVERJANS

FFx Engulfing Setup Alerter gives trade suggestions with Entry, Target 1, Target 2 and StopLoss. Below are the different options available: Entry suggestion - pips to be added over the break for the entry 3 different options to calculate the SL - by pips, by ATR multiplier or at the pattern High/Low 3 different options to calculate the 2 TPs - by pips, by ATR multiplier or at Risk/Reward Offset the dashboard - any place on the chart Remove the suggestion once the price reached the SL line Lines
FFx InsideBar Setup Alerter gives trade suggestions with Entry, Target 1, Target 2 and StopLoss. Below are the different options available: Entry suggestion - pips to be added over the break for the entry Minimum candle size - to avoid too close buy/sell entry suggestions 3 different options to calculate the SL - by pips, by ATR multiplier or at the pattern High/Low 3 different options to calculate the 2 TPs - by pips, by ATR multiplier or at Risk/Reward Offset the dashboard - any place on the c
FFx OutsideBar Setup Alerter gives trade suggestions with Entry, Target 1, Target 2 and StopLoss. Below are the different options available: Entry suggestion - pips to be added over the break for the entry. 3 different options to calculate the SL - by pips, by ATR multiplier or at the pattern High/Low. 3 different options to calculate the 2 TPs - by pips, by ATR multiplier or at Risk/Reward. Offset the dashboard - any place on the chart. Remove the suggestion once the price reached the SL line.
FFx PinBar Setup Alerter gives trade suggestions with Entry, Target 1, Target 2 and StopLoss. Below are the different options available: Entry suggestion - pips to be added over the break for the entry Minimum candle size - to avoid too small candles 3 different options to calculate the SL - by pips, by ATR multiplier or at the pattern High/Low 3 different options to calculate the 2 TPs - by pips, by ATR multiplier or at Risk/Reward Offset the dashboard - any place on the chart Remove the sugges
Automatic, live & interactive picture of all trendlines. Assign push, email and sound alerts to the lines of your choice and be informed about price rollback, breakout, rollback after breakout, number of rollbacks, line expiration by double breakout. Correct, drag or delete the lines and interactively tune the line system. https://youtu.be/EJUo9pYiHFA . Chart examples https: //www.mql5.com/en/users/efficientforex Price Interaction Events All events are effective immediately and only after one
The purpose of this new version of the MT4 standard indicator provided in your platform is to display in a sub-window multiple timeframes of the same indicator with its divergences. See the example shown in the picture below. But the display isn't like a simple MTF indicator. This is the real display of the indicator on its timeframe. Here's the options available in the FFx divergences indicator: Select the timeframes to be displayed (M1 to Monthly) Define the width (number of bars) for each tim

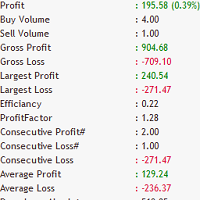
The purpose of this new version of the MT4 standard indicator provided in your platform is to display in a sub-window multiple timeframes of the same indicator with its divergences. See the example shown in the picture below. But the display isn't like a simple MTF indicator. This is the real display of the indicator on its timeframe. Here's the options available in the FFx divergences indicator: Select the timeframes to be displayed (M1 to Monthly). Define the width (number of bars) for each ti
The FFx Dashboard MTF alerter will show you on a single chart all the timeframes (M1 to Monthly) with their own status for the indicator. 2 Alert Options: Single timeframe: each selected timeframe alert separately when a signal occurs Multi timeframes: all selected timeframes must agree for an alert to be triggered Both options have an input to select the timeframes to be used for the alert(s). How to Understand the Status: Green/Red square: histogram above/below 0 line Green square + Red bord
The FFx Dashboard MTF alerter will show you on a single chart all the timeframes (M1 to Monthly) with their own status for the indicator. 2 Alert Options: Single timeframe: each selected timeframe alert separately when a signal occurs Multi timeframes: all selected timeframes must agree for an alert to be triggered Both options have an input to select the timeframes to be used for the alert(s). How to understand the status: Green/Red square: RSI above/below 50 line Green square + Red border: R
The FFx Dashboard MTF alerter will show you on a single chart all the timeframes (M1 to Monthly) with their own status for the indicator. 2 Alert Options: Single timeframe: each selected timeframe alert separately when a signal occurs Multi timeframes: all selected timeframes must agree for an alert to be triggered Both options have an input to select the timeframes to be used for the alert(s). How to understand the status: Green/Red square: Stoch above/below 50 line Green square + Red border:
The FFx Dashboard MTF alerter will show you on a single chart all the timeframes (M1 to Monthly) with their own status for the indicator. 2 Alert Options: Single timeframe: each selected timeframe alert separately when a signal occurs Multi timeframes: all selected timeframes must agree for an alert to be triggered Both options have an input to select the timeframes to be used for the alert(s). How to understand the status: Green/Red square: Price above/below Cloud (Kumo) Green square + Red bo
The FFx Dashboard MTF alerter will show you on a single chart all the timeframes (M1 to Monthly) with their own status for the indicator. 2 Alert Options: Single timeframe: each selected timeframe alert separately when a signal occurs Multi timeframes: all selected timeframes must agree for an alert to be triggered Both options have an input to select the timeframes to be used for the alert(s). How to understand the status: Green/Red square: MA pointing Up/Down Green square + Red border: MA po
The FFx Dashboard MTF alerter will show you on a single chart all the timeframes (M1 to Monthly) with their own status for the indicator. 2 Alert Options: Single timeframe: each selected timeframe alert separately when a signal occurs. Multi timeframes: all selected timeframes must agree for an alert to be triggered. Both options have an input to select the timeframes to be used for the alert(s). How to understand the status: Green square: Price above PSAR Red square: Price below PSAR Options
The FFx Dashboard MTF alerter will show you on a single chart all the timeframes (M1 to Monthly) with their own status for the indicator. 2 Alert Options: Single timeframe: each selected timeframe alert separately when a signal occurs Multi timeframes: all selected timeframes must agree for an alert to be triggered Both options have an input to select the timeframes to be used for the alert(s). How to understand the status: Green/Red square: CCI above/below levels (ie. 100/-100) Grey square: C
The FFx Dashboard MTF alerter will show you on a single chart all the timeframes (M1 to Monthly) with their own status for the indicator. 2 Alert Options: Single timeframe: each selected timeframe alert separately when a signal occurs Multi timeframes: all selected timeframes must agree for an alert to be triggered Both options have an input to select the timeframes to be used for the alert(s). How to understand the status: Green/Red square: ADX above level Grey square: ADX below level Red bor
The FFx Dashboard MTF alerter will show you on a single chart all the timeframes (M1 to Monthly) with their own status. 2 Alert Options: Single timeframe: each selected timeframe alert separately when a signal occurs Multi timeframes: all selected timeframes must agree for an alert to be triggered Both options have an input to select the timeframes to be used for the alert(s). How to understand the status: Green/Red square: bullish/bearish candle Options available in the FFx Dashboard Alerter
Simply drop the indicator to the chart and Fibonacci levels will be shown automatically! The indicator is developed for automatic drawing of Fibonacci levels on the chart. It provides the abilities to: Select the standard Fibo levels to be shown Add custom levels Draw the indicator on the timeframes other than the current one. For example, the indicator is calculated on the weekly period (W1) and is displayed on the monthly period (MN1) Select the timeframes the indicator will be available on Ca
The indicator of a Professional Trader is an arrow indicator for predicting the direction of price movement. I have been working on this indicator since 2014. You can use this indicator as your main indicator, use its entry signals, and use it as your only indicator to find entry points. About the product: Recommended TF [H4-D1-W1]   . The indicator predicts the direction of the next candle. Fits a variety of tools; Flexibility in settings for different instruments and intervals through the MO
The [GRAFF] III manual trading system is based on multiple MetaTrader (MT4) indicators. Together, the entire PACK of GRAFF III indicators makes an advanced trading tool. The system consists of over 20 different custom-built indicators which have been carefully selected and tested in the long term to produce strong and efficient trading signals. The particular indicators are based on different mathematical formulas, so the entire system is calibrated to remove false signals from its own indicator
Simply drop the indicator to the graph and support and resistance levels will be shown automatically! The indicator for automatic drawing of support and resistance levels based on THREE points. Identified points are marked on the chart Indicator shows break through price for both bullish and bearish trends (if found) You can specify on how many bars the indicator shall look in order to identify supporting points. In addition, you can select on which time frame the indicator will work. That means
This indicator is a multipairs dashboard which recognizes the best pair setup to open orders with 8 families of currencies. Families of currencies include: AUD, USD, EUR, GBP, CAD, NZD, CHF, JPY; 28 pairs in total. The precise moment to open an order is shown at Column A on the dashboard, you can also setup alerts, e-mails and notification to mobile devices. You can filter alerts by spread value of pairs. What is the dashboard showing? RED values mean short trends, GREEN values mean long trends
Filtrele:
Değerlendirme yok
Değerlendirmeye yanıt