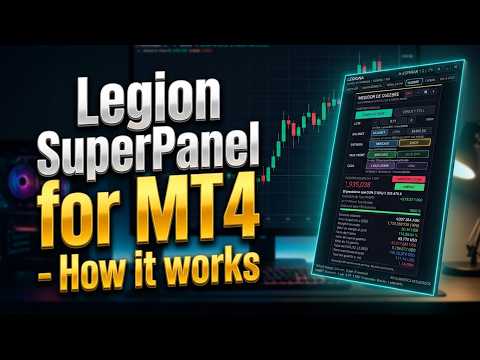
Legion SuperPanel

One chart. Nine timeframes. One clear reading.

Most traders work with RSI in one window, ADX in another, sessions on a third chart and a calculator open on the side. By the time everything is checked, the picture is scattered and the decision is made in a hurry.

Legion SuperPanel puts all of that in one panel on your chart and tells you, in plain words, where the readings agree and where they do not. You stop switching windows and start reading the market as a whole.

The panel is read-only. It does not open, modify or close orders: every decision stays in your hands.

What you see at a glance

  • Direction and agreement: a confluence score from -100 to +100 and a confidence percentage.
  • Where the price is: whether the Bid is inside an order block or an imbalance (FVG) of H4, D1, W1 or MN1, and how deep it has entered.
  • What is still missing: a checklist that marks each condition as MET, ALMOST or MISSING, so you know what to wait for.
  • Your risk in money: margin call, stop out and take profit levels drawn on the chart before you place a trade.

Six tabs, one panel

SUMMARY Account, Confluence Status, Legion checklist, OB + FVG, Active Zones, RSI Dashboard, ADX Gun, multi-timeframe structure, FlowPulse, pair strength and Heikin Ashi.
TOOLS Sessions and psychological levels, color templates and rectangles with price.
VOLUME PROF. Volume profile of any candle and the position of the mother candle close inside its range.
WIPEOUT Position simulator with stop out, margin call, take profit and lot size for your capital.
DROPS Largest historical drops of indices, gold and bitcoin, and the current drop.
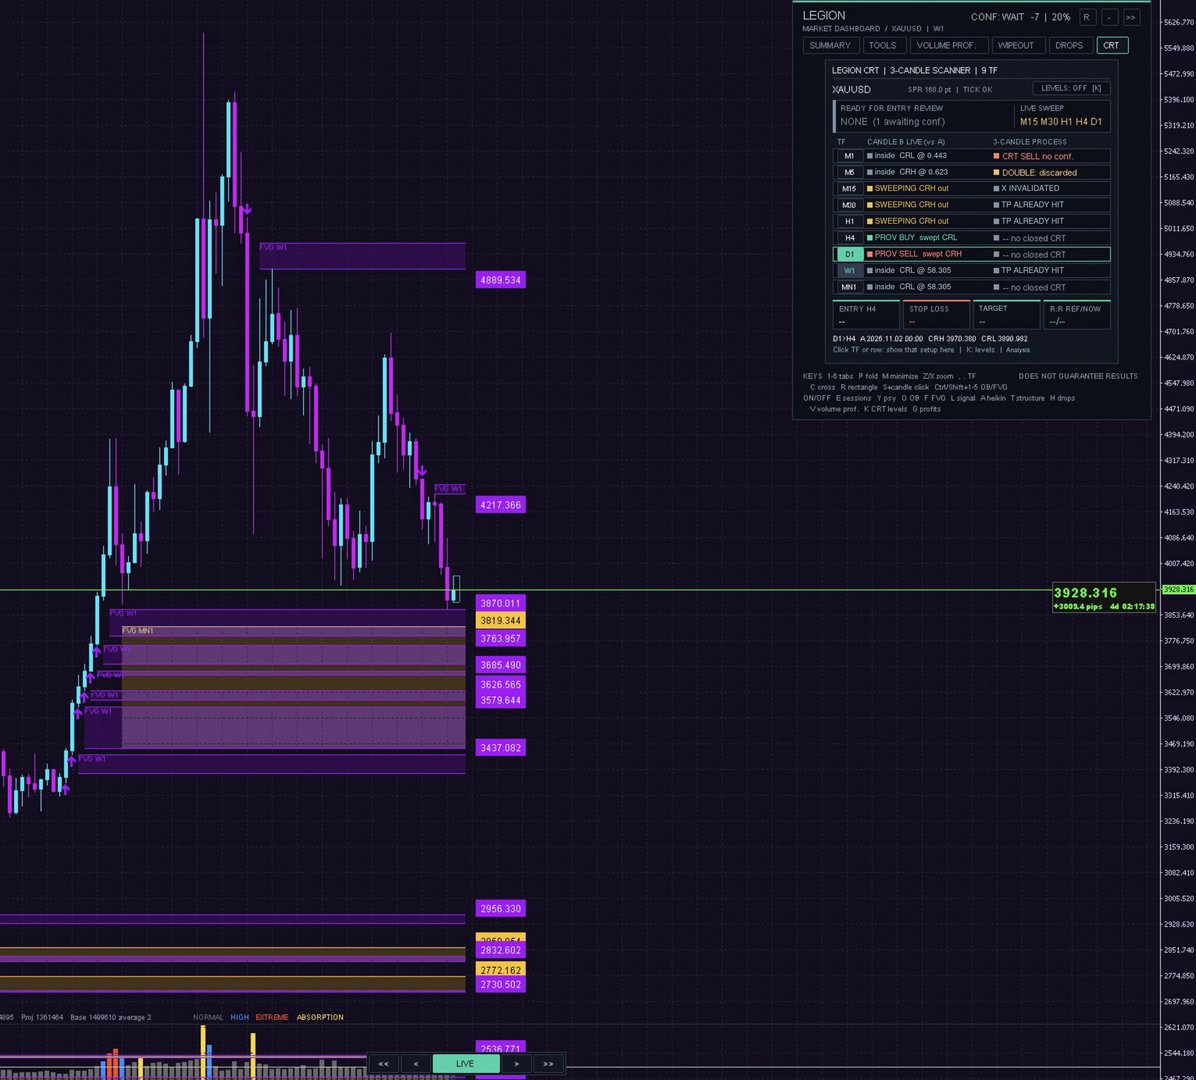
CRT Three-candle range scanner from M1 to MN1.

How to read the Summary tab in a few seconds

  1. Header: the overall bias of the chart (for example SELL BIAS -52 | 76%) is always visible at the top.
  2. Confluence: each module shows its own vote (FLOW, PAIR, RSI, ADX, STRUCT, CANDLE) and the score bar goes from SELL to BUY. A short sentence explains the reading.
  3. Legion checklist: flow, pair strength, RSI, ADX formation, structure and Heikin Ashi, each marked MET, ALMOST or MISSING, plus the last candle pattern and relative volume.
  4. OB + FVG and Active Zones: switch each timeframe on or off with one click and read in text whether the price is inside a zone or how far the nearest one is.
  5. RSI Dashboard and ADX Gun: RSI with change and streak from M1 to D1, and an ADX grid of 5 periods (7, 21, 42, 89, 144) across 9 timeframes (M1 to MN1).
  6. MTF structure: each timeframe from MN to M1 marked bullish or bearish, with its phase (impulsing, correcting or CHoCH), key level and distance, and whether the timeframes are aligned.
  7. FlowPulse: direction and flow strength by time window, from 8 days down to 1 minute.

All modules

Confluence Status A score from -100 to +100 that shows how many modules agree on the same direction: RSI, ADX, FlowPulse, pair strength, ATR impulse structure and the volume profile of the mother candle. It measures agreement between modules; it is not a probability of success. Weights and thresholds can be adjusted.
Active Zones Shows whether the Bid is inside an order block or an imbalance (FVG) on H4, D1, W1 or MN1, with the zone range, direction and penetration. When no zone is active, it shows the nearest one and its distance.
Order Blocks and FVG Radar Zones from H1 to MN1 with mitigation tracking and a status light for each timeframe. Labels, fill and origin marker can be switched on or off.
RSI Dashboard RSI value, change versus the previous candle and streak for each timeframe, with an overall bias, strength and momentum reading.
ADX Gun MTF ADX grid of five periods across nine timeframes, with a watch state when the pattern forms.
Pair Strength and FlowPulse Relative strength of the base and quote currencies, and a flow reading by time windows.
Multi-timeframe structure ATR-based impulses from MN to M1 with phase, key level and alignment status.
CRT Scanner Three-candle range setups from M1 to MN1, with lower-timeframe confirmation and levels for candles 1, 2 and 3. Clicking a row shows that setup on the chart without changing the timeframe.
Volume Profile Volume profile of any candle you select, sessions profile and a volume histogram under the candles.
Sessions and psychological levels Boxes for the main trading sessions and round-number levels.
Historical drops Largest historical drops of indices, gold and bitcoin, the current drop, and the lot size that would withstand the largest historical drop for your capital.
Account and position Balance, equity, floating result, margin level, position value in USD and MXN, leverage used, and margin call and stop out prices.
Wipeout meter and TP viewer Simulates a position and draws its stop out, margin call and take profit, with the gross amount at the take profit (commission and swap not included).

Extra tools included

  • Crosshair cursor with three modes: percentage, normal and lot size.
  • Large BID / ASK display, chart resetter and candle navigation buttons.
  • Rectangles with price, Heikin Ashi candles and timeframe hotkeys.
  • Vertical, compact or horizontal layout, and several color themes.
  • Interface in English or Spanish.
  • Optional alerts (pop-up and push notifications) for selected modules.

Who it is for

  • Traders who use order blocks, FVG and market structure and want every timeframe in view.
  • Traders of forex, gold and stock indices who want a confluence reading before entering.
  • Anyone who wants to see the margin call and stop out of a position before opening it.

Try it before you buy

Download the free demo and run the panel in the Strategy Tester in visual mode. You can also rent it for one month and decide afterwards.

Keyboard shortcuts (default)

1-6 Switch tabs P / M Fold / minimize
Z / X Zoom in / out C Crosshair cursor
O / F Order Blocks / FVG E / Y Sessions / psychological levels
V Volume Profile K CRT levels
R Rectangle with 2 clicks , / . Lower / higher timeframe

All keys can be changed in the inputs.

Setup

  1. Attach the indicator to any chart.
  2. Set your broker's server time offset in the "Server time" group of inputs, so sessions and the volume profile align correctly. The panel warns you if the detected server time does not match.
  3. Choose the layout and language in the first group of inputs.

Main input groups: Dashboard and appearance, Confluence, Account and position, RSI, ADX Gun, Pair strength, FlowPulse, Volume, Server time and sessions, Heikin Ashi, Templates, Volume Profile, Wipeout meter, Historical drops, Smart OB, FVG Radar, Rectangles, CRT Scanner, BID / ASK, Chart Resetter and TP viewer.

Works on any symbol and timeframe. Designed mainly for forex, gold and stock indices.

Support

Questions and suggestions are answered in the comments section of this product and through MQL5 private messages.

This indicator is an analysis tool and does not guarantee results. Trading leveraged products involves a high risk of loss.
Produits recommandés
ToolBox 360 is the swiss knife of all indicators. It is full packed with useful tools to help you with your trading. It can be used to find best entry and exit points and help you to decide if you should open a trade or not. It shows market trends, candlestick formations outside / inside bars and you can sett time based allerts. Main features: Time based Fibonacci lines Choose a start and end time and the indicator shows you Fibonacci lines within the selected time range including range high a
Power Average
Khurram Mustafa
4.25 (4)
This Indicator is a affordable trading tool because with the help of Popular Developers & Support of M Q L Platform I have programmed this strategy. I tried to combine logic of Moving Averages, Parabolic Stop And Reverse, Trend Strength, Oversold, Overbought . Furthermore, I have also care about Support Resistance that Trader can easily get in touch with market by selecting one indicator only. What is in for Trader? Trading Modes: This selection is for activate whole strategy "Power Average" Sp
FREE
Gann Box MT4
Frederic Jacques Collomb
5 (1)
L'indicateur Gann Box est un outil puissant et polyvalent conçu pour aider les traders à identifier et exploiter les niveaux clés du marché. Cet indicateur permet de dessiner un rectangle sur le graphique, qui est automatiquement divisé en plusieurs zones avec des niveaux stratégiques  0, 0.25, 0.50, 075, 1 . Lorsque le prix touche un de ces niveaux, des alertes se déclenchent, offrant ainsi une aide précieuse pour les décisions de trading. Vous savez instantanément l'évolution du marché par ra
Dynamic Range Indicator for MQL4 Introducing our cutting-edge Dynamic Range Indicator , specifically designed for 5-minute charts, featuring a proven back-testing record to ensure reliable performance. Key Features: Blue and Red Lines: The indicator uses two dynamic lines to represent market volatility. Calculation Method: The lines are constructed using the last 14 days' average absolute movement of 5-minute closing prices, multiplied by today's session open price. Indicator Formula: Today's op
Octo Tack
Rafael Vega Ruiz
OCTO TACK TREND INDICATOR Summary/Description: Trend indicator showing signals to execute orders in favor of the current trend Get ready to have the best trend indicator you've ever tried. No repainting in any way, guaranteed It generates clear signals and always in favor of the trend (see screenshots) You just have to wait for the alert to indicate it and earn pip Are you tired of indicators that never work? Here we have the solution, try the free version and if you want to have more signals
FREE
Lefort
Maksim Pliskach
LEFORT is a multi-currency, fully automatic, high-frequency trading robot. The robot works with any instruments in MT4 on any timeframe. The algorithm of the expert Advisor is as follows Single-scalping trades will. Using the analytical signals module, the robot analyzes the market dynamics, and then makes single trades in the direction of the dominant trend with a profit of several pips. A series of open orders. The robot makes a series of trades on a pullback in the direction of the dominant t
Candles length
Hafis Mohamed Yacine
Candles length indicator is, as the name suggests, an indicator that displays the body size of each candle. The nominal size is placed below each bearish candle and below each bullish candle. How to install the Candles length Indicator on your Metatrader 4 trading plaftform? Download the indicator Copy and paste the Candle Body Size Indicator files into following folder of your Metatrader 4 (MT4) platform: MQL4 > Indicators. You can gain access to the folders this way: File > Open Data Folder >
Mongol indicator
Sumiyabazar Buyanjargal
It's a variation of mid of HH and LL since it compares the higher of HH or LL against a period and twice the number of bars back to avoid whipsaws. I used to display this against lines on a chart, but made a histogram out of it and it looks interesting. It looks good at gauging trend strength and general turns (see image below). The name of the indicator is BAM, which is an acronym for "Below and Above Mid". Ways to use it: 1. To see general trend on longer TFs (more than 60 bars back).
Ultimate ADX Multi-timeframe Indicator This indicator provides real-time ADX values for multiple timeframes in one unobtrusive label panel. It i s especially useful for gauging trend strength across timeframes without constantly switching charts. Choose which periods to display, anchor the panel to any chart corner, and color-code ADX strength levels to your taste. Key Features & Personalization Multi-Timeframe ADX - Toggle visibility for 9 built-in periods (M1, M5, M15, M30, H1, H4, D1, W1, MN1
FREE
FFXMV Dashboard Plus
Opengates Success International
Full Forex Market View Dashboard Plus This is a custom indicator created to give Traders a full view of what is going on in the market. It uses a real time data to access the market and display every bit of information needed to make successful trading. The PLUS there to produce the kind of RESULTS as you see in the SCREENSHOTS, I added a MultipleOrder Utility EA with it with instructions on how to use it with FFXMV Dashboard. INSTALLATION : Read the MANUALS that comes with the rest of the PAC
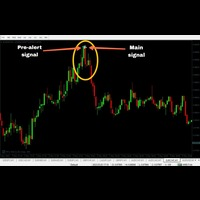
This Indicator has a accuracy in between 80-90% but it will work one time in a day. The timing is (MT4 time 18:00 to 18:05) Tickmill, Alpari, Amarket MT4 recommended. Although it will work on most of the MT4.  MT2 Auto trading supported: Buy buffer = 2 //  Sell buffer = 3 Intrabar Candle TF = M1 Trade Expiry = 1 minute or 5 minutes No martingale required, but if you wish then you can take 1 step martingale. Features: Neural Network based Advance price action algorithms Advance consolidation fi
FTC Neuro
Aliaksandr Ausiyevich
Bienvenue dans le monde des solutions commerciales innovantes! Nous présentons à votre attention notre conseiller commercial avancé FTC Neuro , travaillant sur la base des statistiques macroéconomiques actuelles et des calculs de neuroset modernes. En analysant la situation du marché à l'aide d'algorithmes complexes, le conseiller reconnaît les modèles cachés de l'information économique à l'aide d'algorithmes avancés d'intelligence artificielle. Il vous offre l'expérience de trading la plus pro
Cet indicateur fonctionne en conjonction avec la théorie des vagues d'Elliott de deux manières : Mode automatique : Dans ce mode, l'indicateur détectera automatiquement les cinq vagues motrices sur le graphique conformément à la théorie des vagues d'Elliott. Il fournira des prédictions et identifiera les zones potentielles de retournement. De plus, il a la capacité de générer des alertes et des messages push pour informer les traders des développements importants. Cette fonctionnalité automatiqu
Purpose The indicator is intended for manual multi-currency trading based on the Triple Screen Strategy. It works with any symbols located in the Market Watch window of the MT4: currencies, metals, indexes, etc. The number of instruments can be limited by capacity of the МТ4's parameters. But if desired, you can create several windows with various set of instruments and parameters. Operation Principle The indicator uses the modified Triple Screen Strategy for determining trend direction in the
Candle Timer Countdown (CTC) – Minuteur de bougie minimaliste et précis Candle Timer Countdown (CTC) est un indicateur MetaTrader léger et non intrusif qui affiche le temps restant de la bougie actuelle sur votre graphique. Conçu dans un souci de simplicité et de clarté, cet outil aide les traders à rester conscients de la clôture des bougies sans encombrer le graphique. Caractéristiques principales : Compte à rebours de bougie en temps réel : Sachez toujours combien de secondes il reste avant l
FREE
Turn Every Market Reversal Into a Money-Making Opportunity With the U-turn Detector Indicator! Imagine having a tool that visually reveals the exact moment price is about to flip — before the crowd catches on. The U-turn Detector isn’t just another indicator... it's your edge in spotting clean, confident entries and exits in forex. If you've ever been frustrated by fake breakouts, late signals, or messy charts — you're about to fall in love with this tool. URGENT REMINDER: PRICE MAY DOUBLE
Zain Gold Scalping MT4 V5
Ahmed Gamal Abdel Nasser Mohamed
Zain Gold Scalping MT4 - Multi-Timeframe Technical Indicator Zain Gold Scalping MT4 is a technical analysis indicator developed for the MetaTrader 4 (MT4) platform. It provides analytical insights and multi-timeframe trend tracking for various market instruments, including precious metals and major currency pairs. Timeframe and Market Compatibility Multiple Timeframe Support: Designed to operate across standard chart timeframes, from M1 and M5 up to higher structured timeframes like H1 and D
HF Crosshair
Wong Sze Wai
4.6 (5)
For some trader's charts analysis use, specially for  multi timeframe trading strategies . When you need to check something of the time within different timeframe at the same symbol chart, even different symbol charts, this indicator will show the crosshair at sync moving. You just need to load this indicator into some charts, then the crosshair will shown automatic. 
FREE
NQX Turn Pattern New York MT4 est un indicateur de signaux pour MetaTrader 4 : signaux de figures de retournement (il ne signale que pendant la session de New York (graphiques intraday)). Logique NQX propriétaire qui détecte une courte figure de retournement en trois bougies. Il ne signale que pendant la session de New York (graphiques intraday). Il trace l'entrée suggérée, un stop court et des objectifs éloignés (3:1, 5:1, 10:1, jusqu'à 20:1 en swing) ; vous décidez. Ce qu'il affiche sur le gra
Great Indicator
Ruben David Santana Rodriguez
Les presento un indicador que funciona como estrategia por si solo , trabaja muy bien en periodos de 4 horas pero puedes aplicarlo a cualquier timeframe , las señales son muy faciles de interpretar , en momento en que la linea naranja pasa hacia arriba las media azul y roja , se entra en largos , la operativa se mantiene abierta hasta que la linea naranja cruce la media mas cercana ya sea la azul o la roja , si la operacion era long y la linea azul cruza hacia arriba la linea roja y la naranja c
This EA is an extension for the free trade indicator Trend Mate . https://www.mql5.com/en/market/product/50082 The main idea is to support your decision to  trade  according to the current trend. It is possible to configure alert and push notification to receive when entering to first candle for bull / bear trend. For this extension of the free indicator now it is possible to filter the current trend info with other timeframes. For example show trend for timeframe M5 considering also timeframe
The Trend Champion indicator works on all timeframes and currency pairs. The indicator should be used as an auxiliary tool for technical analysis, it helps to determine the direction of the trend: either upward or downward price movement for a particular currency pair. Can be used along with oscillators as filters. Trend Champion is a trend indicator. Arrows indicate favorable moments and directions for entering the market. The indicator can be used both for pipsing on small periods and for lo
Account History Collector Panel The Advanced History Collector Panel is a professional-grade account analysis and visualization indicator for MetaTrader. It bridges the gap between raw trading logs and actionable insights by transforming execution data into interactive charts and comprehensive tables. Key Features: Comprehensive Data Metrics : Track daily/weekly profit and loss, long/short ratios, total volume, and deposit/withdrawal history. Dynamic Visualizations : Toggle between various char
FREE
The Arrow Scalper
Fawwaz Abdulmantaser Salim Albaker
1 (2)
Dear Friend..  I share with you this simple Expert Adviser .. it is full automatic  this Expert Adviser following the trend of the pair you install on or any stocks or indices , it is works like that: - when the trend on H4 chart show a start of up trend the expert will wait till the 15M & 1H charts show an up trend the EA will open a buy order directly , and do the same for down trend and open a sell order the buy or sell  order lot size and take profit and stop loss will measured manually  by
FREE
Rira Renko
Vitor Palmeira Abbehusen
RENKO on Time Chart This indicator is an enhanced Renko, so you can watch the Renko bricks on the chart to understand price movement more clearly the other improvement is automated box size according to ATR (Average True Range) period you can set the ATR number as you want and the box size of Renko changes automatically based on price movement Inputs Mode: Box size is the input to specify the size of the Renko box you want to print on the chart. This input lets you choose the fixed box siz
MarketFlow Indies MarketFlow Indies is a clean MT5 chart indicator designed to help traders read directional flow, confirmed Buy/Sell signals, market structure, reaction zones, and spread information in one simple visual workspace. The indicator focuses on chart clarity. Signals are displayed directly on the main chart with compact Buy and Sell labels, colored flow lines, optional structure marks, and a small dashboard for quick signal review. Expert Version MT5 :  https://www.mql5.com/en/market
IMPORTANT; Price is subject to rise at any time from now! Do not miss this offer! Dear trader I am glad to introduce my new tool called Trend Analyser Dashboard to you. The design, style, and settings of this indicator  have been made simple to make its users not take too much time in understanding the indicator itself.   The purpose is to help traders in analysing the direction of the major trend and the status of the trend whether in weak trend or its strong trend. The indicator will also prov
Dynamic Forex28 Navigator
Bernhard Schweigert
4.43 (7)
Dynamic Forex28 Navigator - L'outil de trading Forex de nouvelle génération. ACTUELLEMENT 49 % DE RÉDUCTION. Dynamic Forex28 Navigator est l'évolution de nos indicateurs populaires de longue date, combinant la puissance de trois en un : Advanced Currency Strength28 Indicator (695 avis) + Advanced Currency IMPULSE avec ALERT (520 avis) + CS28 Combo Signals (Bonus). Détails sur l'indicateur https://www.mql5.com/en/blogs/post/758844 Qu'offre l'indicateur de force de nouvelle génération ? Tout
Trade Stats
Johannes Schoeman
Does your trading consist of Multiple EA's, Multiple time frames an no clear indication of how each individual strategy or time frame is performing, then this indicator will help. Assign the EA Magic number to this indicator and track it's performance on the chart by selecting on chart the period, today, week, month year or all history to view. Easy visual colour changing header to display the performance of the EA for the respective periods.    Minimize the panel to reduce chart clutter. Add yo
Smoothed Heiken Ashi with AC/AO Zones – Professional Trading Clarity Transform your Heiken Ashi analysis with intelligent smoothing that eliminates noise while preserving actionable signals. What Makes This Different? This isn't just another Heiken Ashi indicator. We've engineered a sophisticated smoothing engine that works with the Accelerator (AC) and Awesome Oscillator (AO) zone logic to give you cleaner entries and exits without sacrificing responsiveness. Four Smoothing Methods at Your Comm
Les acheteurs de ce produit ont également acheté
Miraculous Indicator Binary & Forex v3 StrategySafe Miraculous Indicator Binary & Forex v3 StrategySafe est un indicateur professionnel conçu pour les traders qui recherchent des signaux clairs, des outils de confirmation puissants et une méthode structurée pour trader les marchés Binary et Forex. La version v3 intègre le MIR Dashboard, le Miraculous Confirmation Dashboard, la GANN Law, les niveaux Square of 9, les angles GANN et un mode Forex plus avancé pour une analyse plus complète. Fonction
OrderFlow Absorption – Indicateur professionnel de delta et de signaux d’absorption pour MT4 Libérez la puissance de l’analyse réelle du flux d’ordres avec OrderFlow Absorption – l’indicateur ultime d’histogramme delta et de signaux d’absorption pour MetaTrader 4. Conçu pour les traders qui veulent comprendre ce qui se passe réellement derrière chaque mouvement de prix, cet outil révèle la pression d’achat/vente cachée et les événements d’absorption qui font bouger le marché. Fonctionnalités Vis
ORB Seeker
Marcela Goncalves De Oliveira
4 (1)
Prix spécial pour limiter la disponibilité et maintenir la rareté du produit ! Seulement 599 $ ! Après votre achat, contactez-moi pour obtenir le bonus ORB Seeker EA et les fichiers de configuration optimisés personnalisés. Réussissez vos sessions de mixage en toute confiance ! ORB Seeker est un indicateur professionnel de cassure de la plage d'ouverture (ORB) conçu pour les traders qui recherchent précision, simplicité, flexibilité et une structure graphique claire. Il trace automatiquement l
Meravith
Ivan Stefanov
5 (3)
Outil des market makers. Meravith va : Analyser toutes les unités de temps et afficher la tendance actuellement en vigueur. Mettre en évidence les zones de liquidité (équilibre des volumes) où le volume haussier et baissier est égal. Afficher tous les niveaux de liquidité provenant de différentes unités de temps directement sur votre graphique. Générer et présenter une analyse de marché sous forme de texte pour votre référence. Calculer les objectifs, les niveaux de support et les points de stop
Binary Booster
Yaroslav Varankin
5 (1)
Binary Options Trading Indicator: A Reliable Tool for Your Trades This indicator is specifically designed for binary options trading and has proven its high quality, reliability, and adequate accuracy, depending on the dynamics of the chart. Key Points: Signal Interpretation: When a blue cross signal appears, it indicates a potential entry into a trade, though it is considered a weak signal on its own. However, if the blue cross is accompanied by an arrow, it is considered a more reliable buy s
First time on MetaTrader, introducing IQ Star Lines - an original Vedic Astrology based indicator. "Millionaires don't use astrology, billionaires do" . - J.P. Morgan, Legendary American financier and banker. We don't offer free or bonus indicators in exchange of reviews from you. You won't need any free products with this indicator to make it work. ;) Enjoy! Welcome to  the new and updated  IQ Star Lines , the ultimate fusion of ancient planetary harmonic cycles and modern quantitative trading.
CVD Divergence Détection - Analyse Avancée du Delta de Volume   LE PROBLÈME QUE NOUS RÉSOLVONS La plupart des traders s'appuient uniquement sur l'action des prix, manquant des informations cruciales sur le flux de volume qui révèlent le véritable sentiment du marché. Les indicateurs traditionnels sont en retard par rapport aux mouvements de prix, causant des entrées tardives et une mauvaise gestion des risques. CVD Divergence Detection résout cela en analysant la relation entre le prix et le
FFx Engulfing Setup Alerter gives trade suggestions with Entry, Target 1, Target 2 and StopLoss. Below are the different options available: Entry suggestion - pips to be added over the break for the entry 3 different options to calculate the SL - by pips, by ATR multiplier or at the pattern High/Low 3 different options to calculate the 2 TPs - by pips, by ATR multiplier or at Risk/Reward Offset the dashboard - any place on the chart Remove the suggestion once the price reached the SL line Lines
FFx InsideBar Setup Alerter gives trade suggestions with Entry, Target 1, Target 2 and StopLoss. Below are the different options available: Entry suggestion - pips to be added over the break for the entry Minimum candle size - to avoid too close buy/sell entry suggestions 3 different options to calculate the SL - by pips, by ATR multiplier or at the pattern High/Low 3 different options to calculate the 2 TPs - by pips, by ATR multiplier or at Risk/Reward Offset the dashboard - any place on the c

FFx OutsideBar Setup Alerter gives trade suggestions with Entry, Target 1, Target 2 and StopLoss. Below are the different options available: Entry suggestion - pips to be added over the break for the entry. 3 different options to calculate the SL - by pips, by ATR multiplier or at the pattern High/Low. 3 different options to calculate the 2 TPs - by pips, by ATR multiplier or at Risk/Reward. Offset the dashboard - any place on the chart. Remove the suggestion once the price reached the SL line.

FFx PinBar Setup Alerter gives trade suggestions with Entry, Target 1, Target 2 and StopLoss. Below are the different options available: Entry suggestion - pips to be added over the break for the entry Minimum candle size - to avoid too small candles 3 different options to calculate the SL - by pips, by ATR multiplier or at the pattern High/Low 3 different options to calculate the 2 TPs - by pips, by ATR multiplier or at Risk/Reward Offset the dashboard - any place on the chart Remove the sugges
Automatic, live & interactive picture of all trendlines. Assign push, email and sound alerts to the lines of your choice and be informed about price rollback, breakout, rollback after breakout, number of rollbacks, line expiration by double breakout. Correct, drag or delete the lines and interactively tune the line system. https://youtu.be/EJUo9pYiHFA . Chart examples https: //www.mql5.com/en/users/efficientforex Price Interaction Events All events are effective immediately and only after one
The purpose of this new version of the MT4 standard indicator provided in your platform is to display in a sub-window multiple timeframes of the same indicator with its divergences. See the example shown in the picture below. But the display isn't like a simple MTF indicator. This is the real display of the indicator on its timeframe. Here's the options available in the FFx divergences indicator: Select the timeframes to be displayed (M1 to Monthly) Define the width (number of bars) for each tim
The purpose of this new version of the MT4 standard indicator provided in your platform is to display in a sub-window multiple timeframes of the same indicator with its divergences. See the example shown in the picture below. But the display isn't like a simple MTF indicator. This is the real display of the indicator on its timeframe. Here's the options available in the FFx divergences indicator: Select the timeframes to be displayed (M1 to Monthly). Define the width (number of bars) for each ti
The FFx Dashboard MTF alerter will show you on a single chart all the timeframes (M1 to Monthly) with their own status for the indicator. 2 Alert Options: Single timeframe: each selected timeframe alert separately when a signal occurs Multi timeframes: all selected timeframes must agree for an alert to be triggered Both options have an input to select the timeframes to be used for the alert(s). How to Understand the Status: Green/Red square: histogram above/below 0 line Green square + Red bord
The FFx Dashboard MTF alerter will show you on a single chart all the timeframes (M1 to Monthly) with their own status for the indicator. 2 Alert Options: Single timeframe: each selected timeframe alert separately when a signal occurs Multi timeframes: all selected timeframes must agree for an alert to be triggered Both options have an input to select the timeframes to be used for the alert(s). How to understand the status: Green/Red square: RSI above/below 50 line Green square + Red border: R
The FFx Dashboard MTF alerter will show you on a single chart all the timeframes (M1 to Monthly) with their own status for the indicator. 2 Alert Options: Single timeframe: each selected timeframe alert separately when a signal occurs Multi timeframes: all selected timeframes must agree for an alert to be triggered Both options have an input to select the timeframes to be used for the alert(s). How to understand the status: Green/Red square: Stoch above/below 50 line Green square + Red border:
The FFx Dashboard MTF alerter will show you on a single chart all the timeframes (M1 to Monthly) with their own status for the indicator. 2 Alert Options: Single timeframe: each selected timeframe alert separately when a signal occurs Multi timeframes: all selected timeframes must agree for an alert to be triggered Both options have an input to select the timeframes to be used for the alert(s). How to understand the status: Green/Red square: Price above/below Cloud (Kumo) Green square + Red bo
The FFx Dashboard MTF alerter will show you on a single chart all the timeframes (M1 to Monthly) with their own status for the indicator. 2 Alert Options: Single timeframe: each selected timeframe alert separately when a signal occurs Multi timeframes: all selected timeframes must agree for an alert to be triggered Both options have an input to select the timeframes to be used for the alert(s). How to understand the status: Green/Red square: MA pointing Up/Down Green square + Red border: MA po
The FFx Dashboard MTF alerter will show you on a single chart all the timeframes (M1 to Monthly) with their own status for the indicator. 2 Alert Options: Single timeframe: each selected timeframe alert separately when a signal occurs. Multi timeframes: all selected timeframes must agree for an alert to be triggered. Both options have an input to select the timeframes to be used for the alert(s). How to understand the status: Green square: Price above PSAR Red square: Price below PSAR Options
The FFx Dashboard MTF alerter will show you on a single chart all the timeframes (M1 to Monthly) with their own status for the indicator. 2 Alert Options: Single timeframe: each selected timeframe alert separately when a signal occurs Multi timeframes: all selected timeframes must agree for an alert to be triggered Both options have an input to select the timeframes to be used for the alert(s). How to understand the status: Green/Red square: CCI above/below levels (ie. 100/-100) Grey square: C
The FFx Dashboard MTF alerter will show you on a single chart all the timeframes (M1 to Monthly) with their own status for the indicator. 2 Alert Options: Single timeframe: each selected timeframe alert separately when a signal occurs Multi timeframes: all selected timeframes must agree for an alert to be triggered Both options have an input to select the timeframes to be used for the alert(s). How to understand the status: Green/Red square: ADX above level Grey square: ADX below level Red bor
The FFx Dashboard MTF alerter will show you on a single chart all the timeframes (M1 to Monthly) with their own status. 2 Alert Options: Single timeframe: each selected timeframe alert separately when a signal occurs Multi timeframes: all selected timeframes must agree for an alert to be triggered Both options have an input to select the timeframes to be used for the alert(s). How to understand the status: Green/Red square: bullish/bearish candle Options available in the FFx Dashboard Alerter
Simply drop the indicator to the chart and Fibonacci levels will be shown automatically! The indicator is developed for automatic drawing of Fibonacci levels on the chart. It provides the abilities to: Select the standard Fibo levels to be shown Add custom levels Draw the indicator on the timeframes other than the current one. For example, the indicator is calculated on the weekly period (W1) and is displayed on the monthly period (MN1) Select the timeframes the indicator will be available on Ca
The indicator of a Professional Trader is an arrow indicator for predicting the direction of price movement. I have been working on this indicator since 2014. You can use this indicator as your main indicator, use its entry signals, and use it as your only indicator to find entry points. About the product: Recommended TF [H4-D1-W1]   . The indicator predicts the direction of the next candle. Fits a variety of tools; Flexibility in settings for different instruments and intervals through the MO
The [GRAFF] III manual trading system is based on multiple MetaTrader (MT4) indicators. Together, the entire PACK of GRAFF III indicators makes an advanced trading tool. The system consists of over 20 different custom-built indicators which have been carefully selected and tested in the long term to produce strong and efficient trading signals. The particular indicators are based on different mathematical formulas, so the entire system is calibrated to remove false signals from its own indicator
Simply drop the indicator to the graph and support and resistance levels will be shown automatically! The indicator for automatic drawing of support and resistance levels based on THREE points. Identified points are marked on the chart Indicator shows break through price for both bullish and bearish trends (if found) You can specify on how many bars the indicator shall look in order to identify supporting points. In addition, you can select on which time frame the indicator will work. That means
Filtrer:
Aucun avis
Répondre à l'avis