Olimpia Classic Dashboard

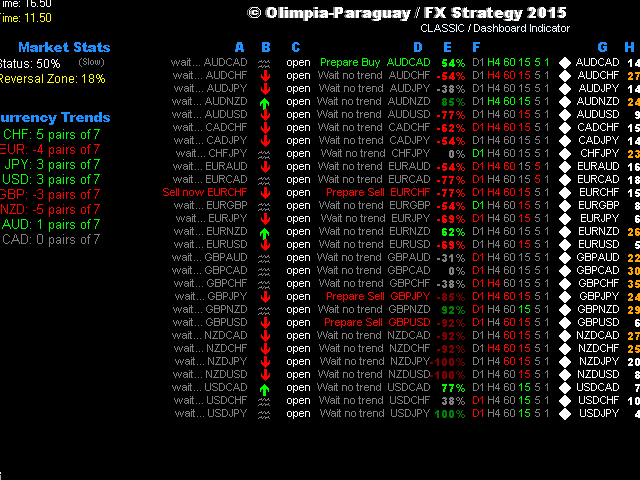
This indicator is a multipairs dashboard which recognizes the best pair setup to open orders with 8 families of currencies. Families of currencies include: AUD, USD, EUR, GBP, CAD, NZD, CHF, JPY; 28 pairs in total. The precise moment to open an order is shown at Column A on the dashboard, you can also setup alerts, e-mails and notification to mobile devices. You can filter alerts by spread value of pairs.


What is the dashboard showing?

RED values mean short trends, GREEN values mean long trends


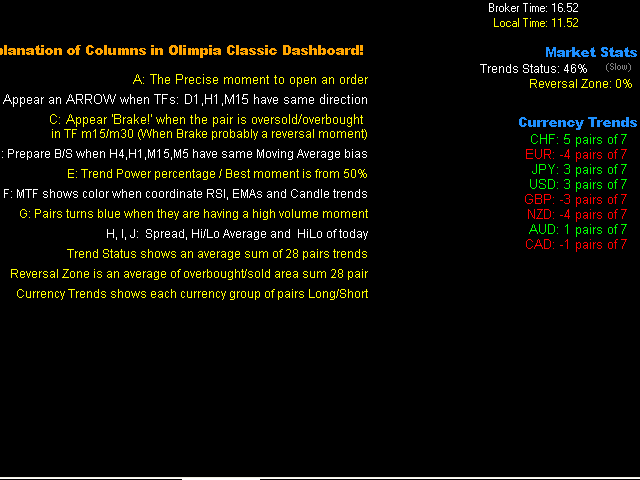
Explanation of Columns in Olimpia Classic Dashboard

  • A: The precise moment to open an order:
    • Wait EURUSD in Gray: means not a good moment to setup an order.
    • Buy now EURUSD: means a good moment to open a buy ORDER in EURUSD pair.
    .
  • B: An ARROW appears when D1, H1 and M15 time frames have same trend direction in candle.
  • C: 'Brake!' appears when the pair is oversold/overbought (Probably a price reversal zone).
  • D: Prepare Buy or Sell message when H4, H1, M15, M5 have the same Moving Average bias (Exponential Moving Average crosses with 7 and 14 value).
  • E: Trend Power percentage -- Best moment is between 60% and 80%. Very exclusive and secret Trend Power Percentage indicator uses MTF Multi indicator to know accurately trends directions for each pair and recognize the best moment to open a trade. More than 80% means the TREND has rolled a lot, probably its too late to enter a trade. Less than 60% means the trend is still not absolutely strong.
  • F: Multi Time Frame shows green or red color when RSI, EMA and Candle trends are having same trend bias.
  • G: Pairs turn blue when they are having a high volume moment: this column shows info or current M1 volume and compare with average value of last 120 minutes. Turns BLUE if current value is higher than average.
  • H: Spread. Turns orange if values are higher than the minimum spread value.


Market Stats

  • Trend Status shows a sum of 28 pairs trends and its average value.
  • Reversal Zone is a sum of overbought/sold areas of 28 pairs and its average value.
  • Currency Trends shows each currency group of 7 pairs, so green color means a long trend and red color means a short trend.


Indicator Parameters

  • ShowColumnsInfo: true or false. Shows the info of columns values on one side.
  • Spreadnum. Alerts only with pairs having less spread than the value.
  • Enable messages. Alert popup, Email and/or notification.
  • Trend Power: 50 (default). The perfect moment is 50% which means 75% or probability the trend will continue going to that direction with the pair, 90% is too late and less that 50% means that there is still not enough powerr.
  • Market Trend status: 50 (default). More than 50% in Market Trends means that the market is having a good bias moment to open orders. Less than 50% the trends means that the market is very noisy, so it is not a good moment to open an order. You can disable this filter adding 0 value in properties.
  • Difference Broker Time. You can compare the broker time to your local time to adjust this parameter (not important for indicator action).


Note

You don't have to worry in which TF or chart pair add the indicator. The indicator is programmed to use all included pairs (28). Its concept lays in recognition the best pair to have an alarm or visualize in the dashboard.

The indicator can NOT show history on charts because it's using real time values.

You can lose some or all of your initial investment even using this indicator; do not invest money that you cannot afford to lose. Educate yourself on the risks associated with foreign exchange trading before using this Olimpia Classic Dashboard!

Önerilen ürünler
Robot scalper for M5 timeframe. Trades on the GBPUSD currency pair. This robot has been specially developed by a company of professional traders for trading in the pound sterling. The robot approximately opens 5 to 15 trades every day. It is best to trade with brokers that have a low spread on GBPUSD up to 10 pips. The recommended minimum deposit to start is $500 or more. Advantages: does not use martingale. not a net. every trade has a stop loss. professional bot specifically for the GBPUSD p
Gösterge, tarihsel olanlarla karşılaştırılabilecek güncel teklifler oluşturur ve bu temelde bir fiyat hareketi tahmini yapar. Gösterge, istenen tarihe hızlı navigasyon için bir metin alanına sahiptir. Seçenekler: Sembol - göstergenin göstereceği sembolün seçimi; SymbolPeriod - göstergenin veri alacağı dönemin seçimi; GöstergeRenk - gösterge rengi; Ters - doğru tırnakları tersine çevirir, yanlış - orijinal görünüm; Sonraki, tarihi girebileceğiniz ve 'enter' tuşuna basarak hemen atlayab
Nostradamix
Andrey Kozak
5 (1)
The "Nostradamix" indicator is designed to analyze short-term market movements on lower timeframes (e.g., M1), while simultaneously considering trend direction on higher timeframes (e.g., M30). This tool identifies key trend reversal points, displays volatility levels, and generates buy/sell signals based on market dynamics. The indicator automatically plots: Current trend lines. Volatility bands to assess movement strength. Visual markers (arrows) for entry signals. Forecast Accuracy and Mathem
Gets
Andrey Kozak
Gets is a smart trading system with complex market analysis mechanism. The operation principle of Gets is based on neural networks and diversified collection of information from various market analyzers. Then the system analyzes the statistical databases to create a general idea of the current market situation and the further price movement. The information is displayed on the screen in a simple and intuitive way - in the form of buy and sell arrows. Also, the information on the current trend st
Trend PA
Mikhail Nazarenko
5 (3)
The Trend PA indicator uses   Price Action   and its own filtering algorithm to determine the trend. This approach helps to accurately determine entry points and the current trend on any timeframe. The indicator uses its own algorithm for analyzing price changes and Price Action. Which gives you the advantage of recognizing, without delay, a new nascent trend with fewer false positives. Trend filtering conditions can be selected in the settings individually for your trading style. The indicator
Arz ve Talep Bölgesi Temel Fiyat Göstergeleri arka plan Sistem K-çizgisindeki arz ve talep alanlarını otomatik olarak arar ve gerçek zamanlı anahtar fiyat çizgilerini çizer. Yatırımcılar fiyat işlem hatlarına göre işlem yapabilirler. Ana Özellikler Sistem K-çizgisindeki arz ve talep alanlarını otomatik olarak arar. Sistem aynı zamanda gerçek zamanlı anahtar fiyat çizgilerini de çizecek ve yatırımcılar fiyat işlem çizgilerine göre işlem yapabilecekler. Dolayısıyla arz ve talep bölgesi stratejisi
Indicador Taurus All4
Fabio Oliveira Magalhaes
Taurus All4 Taurus All4 is a high-performance indicator, it will tell you the strength of the trend, and you will be able to observe the strength of the candle. Our indicator has more than 4 trend confirmations. It is very simple and easy to use. Confirmation Modes Candle Trend Confirmations: When the candle switches to light green the trend is high. When the candle switches to light red the trend is reverting down. When the candle changes to dark red the trend is low. Trendline Trend Confirm
Alpha Trend sign has been a very popular trading tool in our company for a long time. It can verify our trading system and clearly indicate trading signals, and the signals will not drift. Main functions: Based on the market display of active areas, indicators can be used to intuitively determine whether the current market trend belongs to a trend market or a volatile market. And enter the market according to the indicator arrows, with green arrows indicating buy and red arrows indicating se
VR Cub
Vladimir Pastushak
VR Cub , yüksek kaliteli giriş noktaları elde etmenin bir göstergesidir. Gösterge, matematiksel hesaplamaları kolaylaştırmak ve bir pozisyona giriş noktalarının aranmasını basitleştirmek için geliştirildi. Göstergenin yazıldığı ticaret stratejisi uzun yıllardan beri etkinliğini kanıtlamaktadır. Ticaret stratejisinin basitliği, acemi yatırımcıların bile başarılı bir şekilde ticaret yapmasına olanak tanıyan büyük avantajıdır. VR Cub, pozisyon açılış noktalarını ve Kâr Al ve Zararı Durdur hedef sev
Indicator Description GOLD TITAN KING SIGNAL INDICATOR High-Precision Gold Scalping Buy/Sell Signals – Manual Trading Assistant Overview The Gold Titan King Signal Indicator is a manual trading assistant tool designed for high-frequency scalping on Gold (XAUUSD) and other major pairs. It generates clear BUY/SELL signals with precise entry levels, along with adjustable Stop Loss and Take Profit levels displayed directly on the chart. ️ This tool is NOT an EA. It does not execute trades
Добрый День уважаемые трейдеры!  Вашему вниманию индикатор созданный и работающий на базе трендовика ADX,  для торговли на смене направления движения который учитывает коррекцию и даёт возможность на ней заработать.  Применяю этот индикатор для скальпинга. Рекомендую таймфреймы от 15 ти минутного(М15) до часового (Н1) периодов.  Красный кружок сигнал на продажу- Sell) Зелёный кружок  сигнал на покупку Buy) Чем меньше ваш таймфрейм тем меньше пунктов вы зарабатываете.   Важно выставлять стопы! !В
AW Candle Patterns MT4
AW Trading Software Limited
AW Mum Kalıpları göstergesi, güçlü bir mum kalıbı tarayıcı ile birleştirilmiş gelişmiş bir trend göstergesinin birleşimidir. En güvenilir otuz mum kalıbını tanımak ve vurgulamak için kullanışlı bir araçtır. Ek olarak, renkli çubuklara dayalı güncel bir trend analizörüdür.       yeniden boyutlandırılabilen ve konumlandırılabilen eklenti çoklu zaman çerçevesi trend paneli. Trend filtrelemeye bağlı olarak kalıpların görünümünü ayarlamak için benzersiz bir yetenek. Avantajlar: Mum desenlerini kolayc
El indicador "MR BEAST ALERTAS DE LIQUIDEZ" es una herramienta avanzada diseñada para proporcionar señales y alertas sobre la liquidez del mercado basándose en una serie de indicadores técnicos y análisis de tendencias. Ideal para traders que buscan oportunidades de trading en función de la dinámica de precios y los niveles de volatilidad, este indicador ofrece una visualización clara y detallada en la ventana del gráfico de MetaTrader. Características Principales: Canal ATR Adaptativo: Calcula
Owl smart levels
Sergey Ermolov
4.24 (37)
MT5 versiyonu  |  FAQ Owl Smart Levels Indicator ,   Bill Williams'ın gelişmiş fraktalları , piyasanın doğru dalga yapısını oluşturan Valable ZigZag ve kesin giriş seviyelerini gösteren   Fibonacci seviyeleri   gibi popüler piyasa analiz araçlarını içeren tek gösterge içinde eksiksiz bir ticaret sistemidir. pazara ve kar elde edilecek yerlere. Stratejinin ayrıntılı açıklaması Gösterge ile çalışma talimatı Baykuş Yardımcısı ticaretinde Danışman Yardımcısı Kullanıcıların özel sohbeti -> Satın ald
Rainbow Price Visualizer v1.21 See where the market really breathes. Turns your MT4 chart into an ultra-precise heatmap that highlights price zones favored by big players. Why it matters 300 price levels at 0.2‑pip resolution — microscopic detail. 8 visual themes (Rainbow, Fire, Ocean…) for instant readibility. Smart opacity: low noise fades, real zones pop. Lightweight rendering with automatic cleanup. Fully customizable: saturation, opacity, resolution, history depth. Bands project into the f
MetaCOT 2 is a set of indicators and specialized utilities for the analysis of the U.S. Commodity Futures Trading Commission reports. Thanks to the reports issued by the Commission, it is possible to analyze the size and direction of the positions of the major market participants, which brings the long-term price prediction accuracy to a new higher-quality level, inaccessible to most traders. These indicators, related to the fundamental analysis, can also be used as an effective long-term filter
ZhiBiMACD MT4
Qiuyang Zheng
4.5 (2)
This is a unique MACD indicator that is more accurate and easy to use than traditional MACD. It is suitable for any chart cycle and is suitable for any market variety. The red column is the (Buy) band signal, and the blue column is the (Sell) band signal. The yellow and green lines are trend lines, and the two lines never cross. Buy: In the blue column, look at the green line up through the middle 0 axis. Sell: In the red column, look at the yellow line down the middle 0 axis. The MACD's de
Yenilikçi Temel Mum Çubuğu Formasyonları Panomuz, grafikteki kârlı mum çubuğu formasyonlarını otomatik olarak belirlemek için özel olarak tasarlanmıştır. Bu gösterge paneli, fiyat grafiklerini gerçek zamanlı olarak taramak ve klasikten karmaşığa kadar çok çeşitli mum çubuğu formasyonlarını tespit etmek için gelişmiş algoritmalar kullanır. Buna ek olarak, tespit edilen formasyonları farklı zaman dilimlerinde görselleştirmenize olanak tanıyan kullanımı kolay bir arayüze sahiptir ve bilinçli karar
Step into the world of Forex trading with confidence, clarity, and precision using   Gold Indicator   a next-generation tool engineered to take your trading performance to the next level. Whether you’re a seasoned professional or just beginning your journey in the currency markets, Gold Indicator equips you with powerful insights and help you trade smarter, not harder. Built on the proven synergy of three advanced indicators, Gold Indicator focuses exclusively on medium and long-term trends eli
The indicator helps to identify possible rollbacks and reversals. Shows the direction of the price movement and is painted in the appropriate color. Allows you to conduct trend and counter trend trading It works on all timeframes, on any currency pairs, metals and cryptocurrency Can be used when working with binary options Distinctive features Does not redraw; Simple and clear settings; It works on all timeframes and on all symbols; Suitable for trading currencies, metals, options and cryptocurr
Forex Gump Trend is a universal indicator for highly effective determination of the trend direction. If you identify the trend correctly, this is 95% of trading success, because you will be able to open trades in the direction of the price movement and benefit from it. The Forex Gump Trend indicator helps traders with a high degree of efficiency to determine the current trend direction, as well as trend reversal points. The direction of the trend is shown by colored lines on the chart, and the
Indicator for determining flat and trend. If the price is below any of the two histograms and two lines (red and blue), this is a sell zone. When purchasing this version of the indicator, MT5 version for one real and one demo account - as a gift (to receive, write me a private message)! If the price is above any of the two histograms and two lines (red and blue), this is a buy zone. MT5 version:  https://www.mql5.com/en/market/product/70409 If the price is between two lines or in the zone of
The LineMagnit Indicator for MT4 is a highly precise tool that builds support and resistance levels which magnetically attract prices. This feature allows traders to easily determine the most probable entry and exit points in the market, as well as identify the market's directional forces, as levels are based on capital inflows into the instrument. Equipped with an intuitively understandable graphical interface, the LineMagnit Indicator enables users to quickly locate and analyze support and res
H4 GBPUSD Trend Scalper is a trend signal scalper The EA trades according to the trend strategy using original built-in indicator for opening and closing orders. The external inputs for limiting trading on Fridays and Mondays are available. The purpose of the strategy is to use the current trend with the most benefit. According to the results of testing and working on demo and real accounts, the best results achieved by using the Н4 timeframe on the GBP/USD pair Works on MetaTrader 4 Build 971+
PABT Pattern Indicator - it's classical system one of the signal patterns. Indicator logic - the Hi & Lo of the bar is fully within the range of the preceding bar, look to trade them as pullback in trend. In the way if indicator found PABT pattern it's drawing two lines and arrow what showing trend way.  - First line - it's entry point and drawing at: 1. On the high of signal bar or on middle of the signal bar (depending from indicator mode) for buy; 2. On the low of signal bar or on middle of t
Smart Moving Average MT4
Mostafa Saad Saeed Shawara
Ürün Başlığı Smart Moving Averages (MT4) – SmartView serisinin bir parçası Kısa Açıklama MetaTrader platformunda benzersiz bir kullanıcı deneyimi sunan Moving Averages göstergesi. Daha önce mevcut olmayan gelişmiş özellikler sunar, çift tıklama ile ayarları açma, silmeden göstergeleri gizleme/gösterme ve gösterge penceresini tam grafik boyutunda görüntüleme gibi. SmartView Indicators serisinin geri kalanı ile sorunsuz çalışacak şekilde tasarlanmıştır. Genel Bakış SmartView serisi, yenilikçi özel
FREE
Bu, bir mumun kapanış fiyatını tahmin eden bir göstergedir. Gösterge öncelikle D1 çizelgelerinde kullanılmak üzere tasarlanmıştır. Bu gösterge hem geleneksel forex ticareti hem de ikili opsiyon ticareti için uygundur. Gösterge, bağımsız bir ticaret sistemi olarak kullanılabilir veya mevcut ticaret sisteminize ek olarak hareket edebilir. Bu gösterge, mevcut mumu analiz ederek mumun gövdesi içindeki belirli güç faktörlerini ve önceki mumun parametrelerini hesaplar. Böylece gösterge, piyasa hareket
AV Monitor
Anja Vivia Vogel
"AV Monitor" is an indicator for MetaTrader 4, which alowes a history analysis of the closed orders. It helps to achieve a quick visual analysis of your own trading or different expert advisors among themselves. Compare and analyze your expert advisors: Which one is the best? I use an "AV Monitor MT5" indicator per running expert advisor chart to track its performance split into long & short, as well as an index chart e.g. DOW with this indicator and the setting "Show Balance & Equity" to track
Cosmic Diviner X Planet
Olena Kondratenko
4 (2)
This unique multi-currency strategy simultaneously determines the strength of trends and market entry points, visualizing this using histograms on the chart. The indicator is optimally adapted for trading on the timeframes М5, М15, М30, Н1. For the convenience of users, the indicator renders the entry point (in the form of an arrow), recommended take profit levels (TP1, TP2 with text labels) and the recommended Stop Loss level. The take profit levels (TP1, TP2) are automatically calculated for
Blahtech Market Profile
Blahtech Limited
4.53 (15)
Was: $249  Now: $99   Market Profile defines a number of day types that can help the trader to determine market behaviour. A key feature is the Value Area, representing the range of price action where 70% of trading took place. Understanding the Value Area can give traders valuable insight into market direction and establish the higher odds trade. It is an excellent addition to any system you may be using. Blahtech Limited presents their Market Profile indicator for the MetaTrader community. Ins
Bu ürünün alıcıları ayrıca şunları da satın alıyor
Pulse Scalping Line - an indicator for identifying potential pivot points. Based on this indicator, you can build an effective Martingale system. According to our statistics, the indicator gives a maximum of 4 erroneous pivot points in a series. On average, these are 2 pivot points. That is, the indicator shows a reversal, it is erroneous. This means that the second signal of the indicator will be highly accurate. Based on this information, you can build a trading system based on the Martingale
Meravith
Ivan Stefanov
5 (1)
Gösterge, her noktadan hacmi analiz eder ve bu hacim için piyasa tükenme seviyelerini hesaplar. Üç çizgiden oluşur: Boğa hacmi tükenme çizgisi Ayı hacmi tükenme çizgisi Piyasa trendini gösteren bir çizgi. Bu çizgi, piyasanın boğa mı yoksa ayı mı olduğunu yansıtacak şekilde rengini değiştirir. Piyasayı istediğiniz herhangi bir başlangıç noktasından analiz edebilirsiniz. Bir hacim tükenme çizgisine ulaşıldığında, bir sonraki analize başlamak için yeni bir nokta belirleyin. Herhangi bir şeyi analiz
Product Name:   Quantum Regime Indicator Short Description:   A multi-engine structural regime and volatility filter. Description: Quantum Regime Indicator (QRI) is a sophisticated technical analysis algorithm designed to identify market structure shifts and volatility regimes. Unlike standard indicators that rely on immediate price action, QRI utilizes a hierarchical logic architecture to filter market noise and identify statistical extremes. The indicator is built on the philosophy of "Market
Miraculous Göstergesi – Gann Dokuz Kareye Dayalı %100 Tekrarlamayan Forex ve İkili Araç Bu video, Forex ve İkili Opsiyon traderları için özel olarak geliştirilmiş son derece doğru ve güçlü bir ticaret aracı olan Miraculous Göstergesi 'ni tanıtıyor. Bu göstergeyi benzersiz kılan, efsanevi Gann Dokuz Karesi ve Gann Titreşim Yasası 'na dayanmasıdır; bu da onu modern ticarette mevcut en hassas tahmin araçlarından biri yapmaktadır. Miraculous Göstergesi tamamen tekrarlamaz ; yani mum kapandıktan son
" Dynamic Scalper System " göstergesi, trend dalgaları içinde işlem yapmak için scalping yöntemi için tasarlanmıştır. Başlıca döviz çiftleri ve altın üzerinde test edilmiştir, diğer işlem araçlarıyla uyumluluğu mümkündür. Ek fiyat hareketi desteğiyle trend boyunca pozisyonların kısa vadeli açılması için sinyaller sağlar. Göstergenin prensibi. Büyük oklar trend yönünü belirler. Küçük oklar şeklinde scalping için sinyaller üreten bir algoritma trend dalgaları içinde çalışır. Kırmızı oklar yüksel
F-16 Uçak Göstergesini tanıtıyoruz, ticaret deneyiminizi devrimleştirmek için tasarlanmış son teknoloji bir MT4 aracı. F-16 savaş uçağının eşsiz hızı ve hassasiyetinden ilham alan bu gösterge, finansal piyasalarda eşi benzeri olmayan performans sunmak için ileri algoritmalar ve son teknoloji teknolojileri bir araya getirir. F-16 Uçak Göstergesi ile gerçek zamanlı analiz sunarak yüksek doğruluklu ticaret sinyalleri üretirken rekabetin üzerine çıkacaksınız. Dinamik özellikleri, farklı varlık sınıf
Gold Channel is a volatility-based indicator, developed with a specific timing algorithm for the XAUUSD pair, which consists of finding possible corrections in the market. This indicator shows two outer lines, an inner line (retracement line) and an arrow sign, where the theory of the channel is to help identify overbought and oversold conditions in the market. The market price will generally fall between the boundaries of the channel. If prices touch or move outside the channel it is a tradi
OrderFlow Absorption – MT4 için Profesyonel Delta ve Absorpsiyon Sinyal Göstergesi OrderFlow Absorption ile gerçek emir akışı analizinin gücünü keşfedin – MetaTrader 4 için nihai delta histogramı ve absorpsiyon sinyal göstergesi. Fiyat hareketlerinin arkasında gerçekte neler olduğunu görmek isteyen traderlar için tasarlanan bu araç, piyasayı hareket ettiren gizli alım/satım baskısını ve absorpsiyon olaylarını ortaya çıkarır. Özellikler Delta Histogramı Görselleştirme:   Alım ve satım baskısını a
Everyone who purchases the Scalping signals M1 indicator receives a FREE BONUS — a fully automated Expert Advisor that trades based on the indicator’s signals. The indicator shows the arrows — the robot can execute the trades for you, following all signals and risk-management rules. Scalping signals M1 – a ready-made trend-following entry system for M1 Scalping signals M1 is an indicator that turns your chart into a clear action map: a colored trend channel shows the direction of the market, and
BinaryIndicator is a highly accurate indicator for trading binary options. It shows excellent results in scalping. This indicator is based in multifactor analysis of trend indicators, as well as confirmation oscillators, which in the end gives an increased accuracy of signals. Advantages of the indicator Increased accuracy of signals. Excellent results when trading binary options with a short expiration time from M30 to M1 . It works on any timeframes. Works with any trade symbols. Parameters
Rtc ML Ai | Predictor CORE MACHINE LEARNING ENGINE Adaptive ML Market Predictor – Multi-Bar Trend & Candle Forecast What This Indicator Does This indicator is a  real-time market prediction engine  designed to analyze price behavior and estimate  future market tendencies . Unlike conventional indicators, this system  does not rely on static parameters or historical curve-fitting , but adapts its internal state dynamically during live market operation. Instead of using static rules, the indic
The Hurricane Indicator
Paul Nicholas Clevett
5 (1)
Currently switched to the 4 hour chart - but use other time frames for confirmation. :-)  I change my main time frame based on the market movement at the time. The Hurricane Forex Indicator is a multi time frame indicator that includes such things as Trade Notifications, Trade Calculator, Momentum Indicator, risk reward and much more. We have a free Trade room for our users as well. Please check out the video for full details of how this indicator works as it has over 15 years worth of developme
FFx Engulfing Setup Alerter gives trade suggestions with Entry, Target 1, Target 2 and StopLoss. Below are the different options available: Entry suggestion - pips to be added over the break for the entry 3 different options to calculate the SL - by pips, by ATR multiplier or at the pattern High/Low 3 different options to calculate the 2 TPs - by pips, by ATR multiplier or at Risk/Reward Offset the dashboard - any place on the chart Remove the suggestion once the price reached the SL line Lines
FFx InsideBar Setup Alerter gives trade suggestions with Entry, Target 1, Target 2 and StopLoss. Below are the different options available: Entry suggestion - pips to be added over the break for the entry Minimum candle size - to avoid too close buy/sell entry suggestions 3 different options to calculate the SL - by pips, by ATR multiplier or at the pattern High/Low 3 different options to calculate the 2 TPs - by pips, by ATR multiplier or at Risk/Reward Offset the dashboard - any place on the c
FFx OutsideBar Setup Alerter gives trade suggestions with Entry, Target 1, Target 2 and StopLoss. Below are the different options available: Entry suggestion - pips to be added over the break for the entry. 3 different options to calculate the SL - by pips, by ATR multiplier or at the pattern High/Low. 3 different options to calculate the 2 TPs - by pips, by ATR multiplier or at Risk/Reward. Offset the dashboard - any place on the chart. Remove the suggestion once the price reached the SL line.
FFx PinBar Setup Alerter gives trade suggestions with Entry, Target 1, Target 2 and StopLoss. Below are the different options available: Entry suggestion - pips to be added over the break for the entry Minimum candle size - to avoid too small candles 3 different options to calculate the SL - by pips, by ATR multiplier or at the pattern High/Low 3 different options to calculate the 2 TPs - by pips, by ATR multiplier or at Risk/Reward Offset the dashboard - any place on the chart Remove the sugges
Automatic, live & interactive picture of all trendlines. Assign push, email and sound alerts to the lines of your choice and be informed about price rollback, breakout, rollback after breakout, number of rollbacks, line expiration by double breakout. Correct, drag or delete the lines and interactively tune the line system. https://youtu.be/EJUo9pYiHFA . Chart examples https: //www.mql5.com/en/users/efficientforex Price Interaction Events All events are effective immediately and only after one
The purpose of this new version of the MT4 standard indicator provided in your platform is to display in a sub-window multiple timeframes of the same indicator with its divergences. See the example shown in the picture below. But the display isn't like a simple MTF indicator. This is the real display of the indicator on its timeframe. Here's the options available in the FFx divergences indicator: Select the timeframes to be displayed (M1 to Monthly) Define the width (number of bars) for each tim
The purpose of this new version of the MT4 standard indicator provided in your platform is to display in a sub-window multiple timeframes of the same indicator with its divergences. See the example shown in the picture below. But the display isn't like a simple MTF indicator. This is the real display of the indicator on its timeframe. Here's the options available in the FFx divergences indicator: Select the timeframes to be displayed (M1 to Monthly). Define the width (number of bars) for each ti
The FFx Dashboard MTF alerter will show you on a single chart all the timeframes (M1 to Monthly) with their own status for the indicator. 2 Alert Options: Single timeframe: each selected timeframe alert separately when a signal occurs Multi timeframes: all selected timeframes must agree for an alert to be triggered Both options have an input to select the timeframes to be used for the alert(s). How to Understand the Status: Green/Red square: histogram above/below 0 line Green square + Red bord
The FFx Dashboard MTF alerter will show you on a single chart all the timeframes (M1 to Monthly) with their own status for the indicator. 2 Alert Options: Single timeframe: each selected timeframe alert separately when a signal occurs Multi timeframes: all selected timeframes must agree for an alert to be triggered Both options have an input to select the timeframes to be used for the alert(s). How to understand the status: Green/Red square: RSI above/below 50 line Green square + Red border: R
The FFx Dashboard MTF alerter will show you on a single chart all the timeframes (M1 to Monthly) with their own status for the indicator. 2 Alert Options: Single timeframe: each selected timeframe alert separately when a signal occurs Multi timeframes: all selected timeframes must agree for an alert to be triggered Both options have an input to select the timeframes to be used for the alert(s). How to understand the status: Green/Red square: Stoch above/below 50 line Green square + Red border:
The FFx Dashboard MTF alerter will show you on a single chart all the timeframes (M1 to Monthly) with their own status for the indicator. 2 Alert Options: Single timeframe: each selected timeframe alert separately when a signal occurs Multi timeframes: all selected timeframes must agree for an alert to be triggered Both options have an input to select the timeframes to be used for the alert(s). How to understand the status: Green/Red square: Price above/below Cloud (Kumo) Green square + Red bo
The FFx Dashboard MTF alerter will show you on a single chart all the timeframes (M1 to Monthly) with their own status for the indicator. 2 Alert Options: Single timeframe: each selected timeframe alert separately when a signal occurs Multi timeframes: all selected timeframes must agree for an alert to be triggered Both options have an input to select the timeframes to be used for the alert(s). How to understand the status: Green/Red square: MA pointing Up/Down Green square + Red border: MA po
The FFx Dashboard MTF alerter will show you on a single chart all the timeframes (M1 to Monthly) with their own status for the indicator. 2 Alert Options: Single timeframe: each selected timeframe alert separately when a signal occurs. Multi timeframes: all selected timeframes must agree for an alert to be triggered. Both options have an input to select the timeframes to be used for the alert(s). How to understand the status: Green square: Price above PSAR Red square: Price below PSAR Options
The FFx Dashboard MTF alerter will show you on a single chart all the timeframes (M1 to Monthly) with their own status for the indicator. 2 Alert Options: Single timeframe: each selected timeframe alert separately when a signal occurs Multi timeframes: all selected timeframes must agree for an alert to be triggered Both options have an input to select the timeframes to be used for the alert(s). How to understand the status: Green/Red square: CCI above/below levels (ie. 100/-100) Grey square: C
The FFx Dashboard MTF alerter will show you on a single chart all the timeframes (M1 to Monthly) with their own status for the indicator. 2 Alert Options: Single timeframe: each selected timeframe alert separately when a signal occurs Multi timeframes: all selected timeframes must agree for an alert to be triggered Both options have an input to select the timeframes to be used for the alert(s). How to understand the status: Green/Red square: ADX above level Grey square: ADX below level Red bor
Yazarın diğer ürünleri
Olimpia Dragged Trends! This dashboard indicator is a visual tool which recognizes dragged trends of 28 pairs in a easy-to-read histogram. You will see a group of squares indicating the sum and average values of trends of the last "...." minutes for each square from L to A in a dragged way. "Dragged Way" means that regardless the hour of the day or opened or closed candle it always shows the present and the pastinformation. You can configure a sequence of numbers with values between 1 minute to
Filtrele:
İnceleme yok
İncelemeye yanıt