IMD Triangles MT4

IMD Triangles – trend çizgilerinde üçgen ve kanal tarayıcısı

Takım robotları hakkında konuşmak için sohbet odasına katılın :


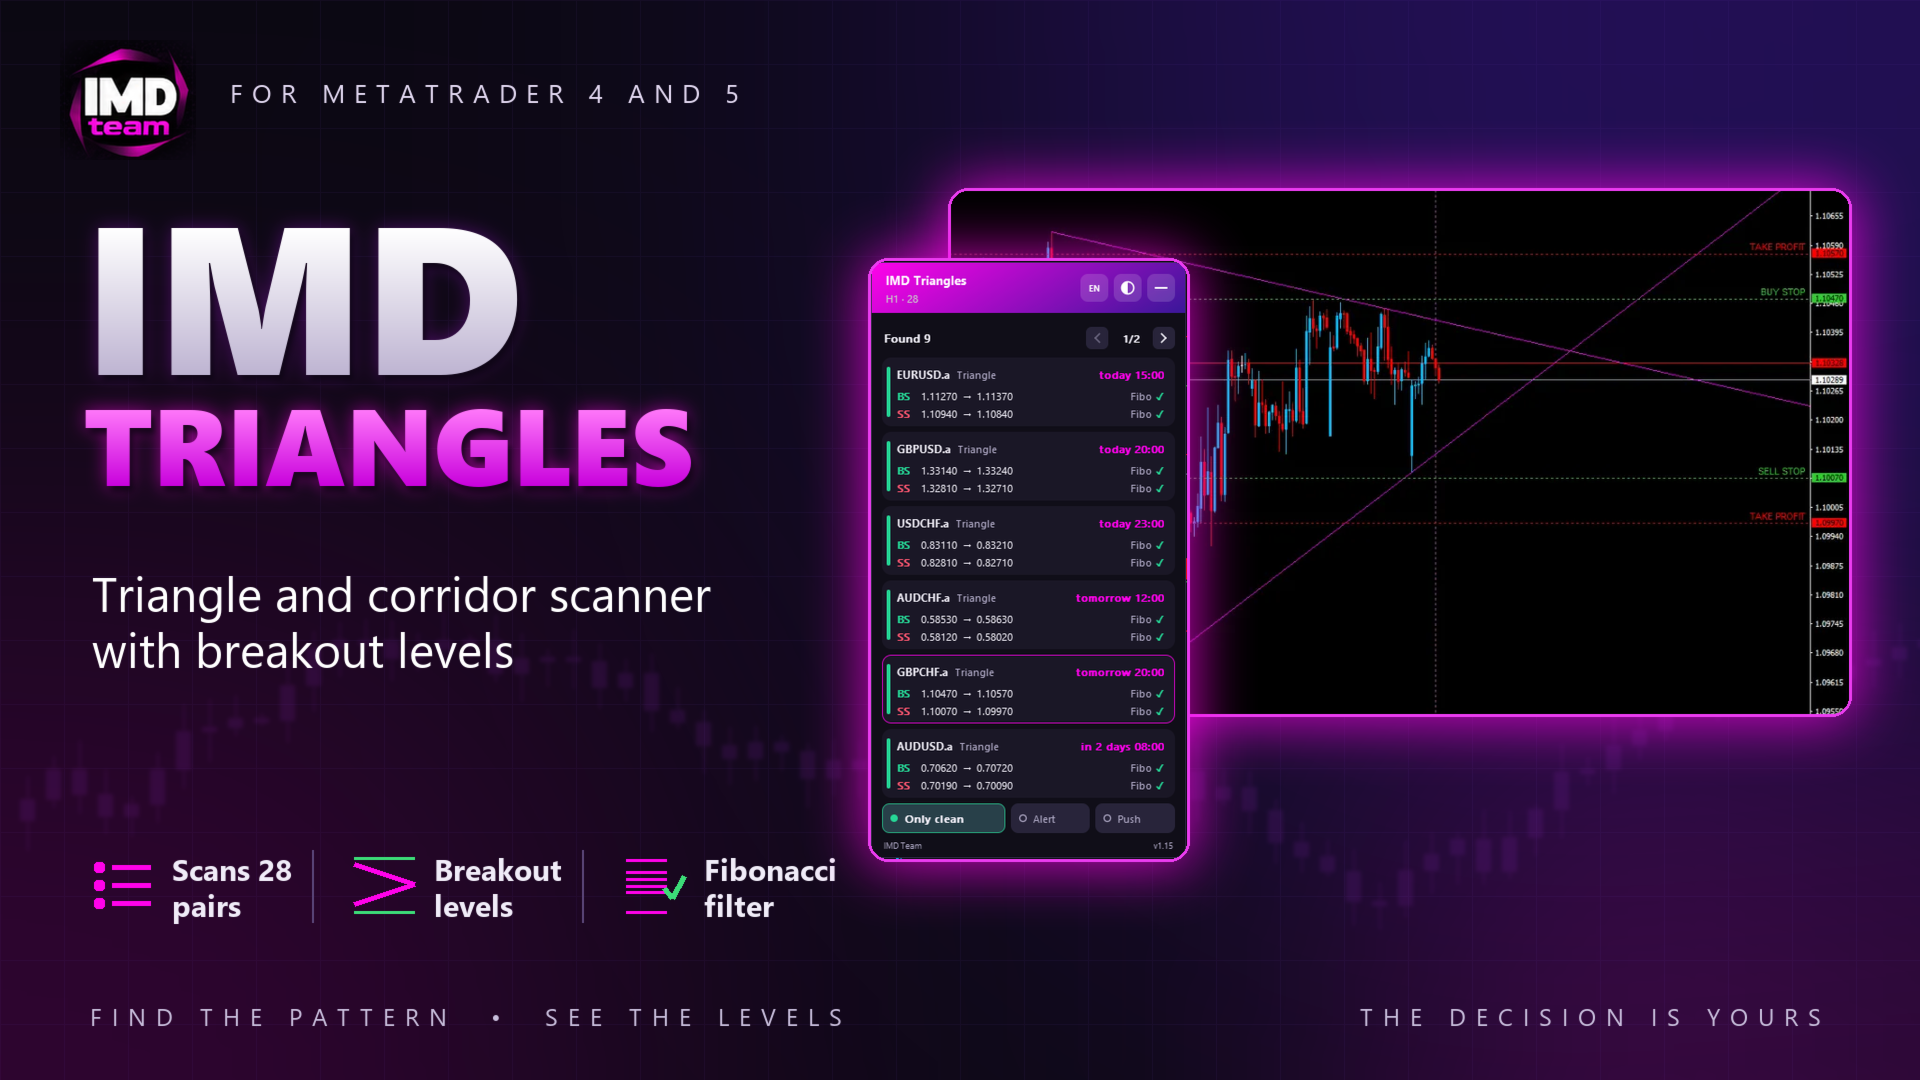
IMD Triangles, bir sembol listesinde trend çizgilerinden oluşan üçgenleri ve yatay kanalları arayan ve kırılım için Buy Stop ve Sell Stop seviyelerini hesaplayan bir göstergedir.

Gösterge işlem açmaz ve işlem kararı vermez. Formasyonu ve seviyeleri gösterir; emir verip vermemeye trader karar verir.

Formasyonlar nasıl bulunur

Üst çizgi mumların en yüksek, alt çizgi en düşük noktalarından geçer. Bir temas, yalnızca sonraki mumlar çizgiyi kesmezse sayılır; son kapanan mumlar (varsayılan 3) temas olarak kullanılmaz. Bu yüzden formasyon her yeni mumda yeniden çizilmez.

Bir üçgen şu durumda gösterilir:
• formasyonun ilk tabanı yeterince yüksekse;
• her iki çizgiye de yakın zamanda temas edildiyse;
• çizgiler ayarlanan işlem günü sayısı içinde kesişiyorsa: varsayılan olarak bugün, yarın veya öbür gün.

Kanal yalnızca iki çizgi de neredeyse yatay ve paralel olduğunda gösterilir. Eğimli bir kanalda çizgilerin kesişme noktası olmadığı için kullanılmaz.

Giriş seviyeleri

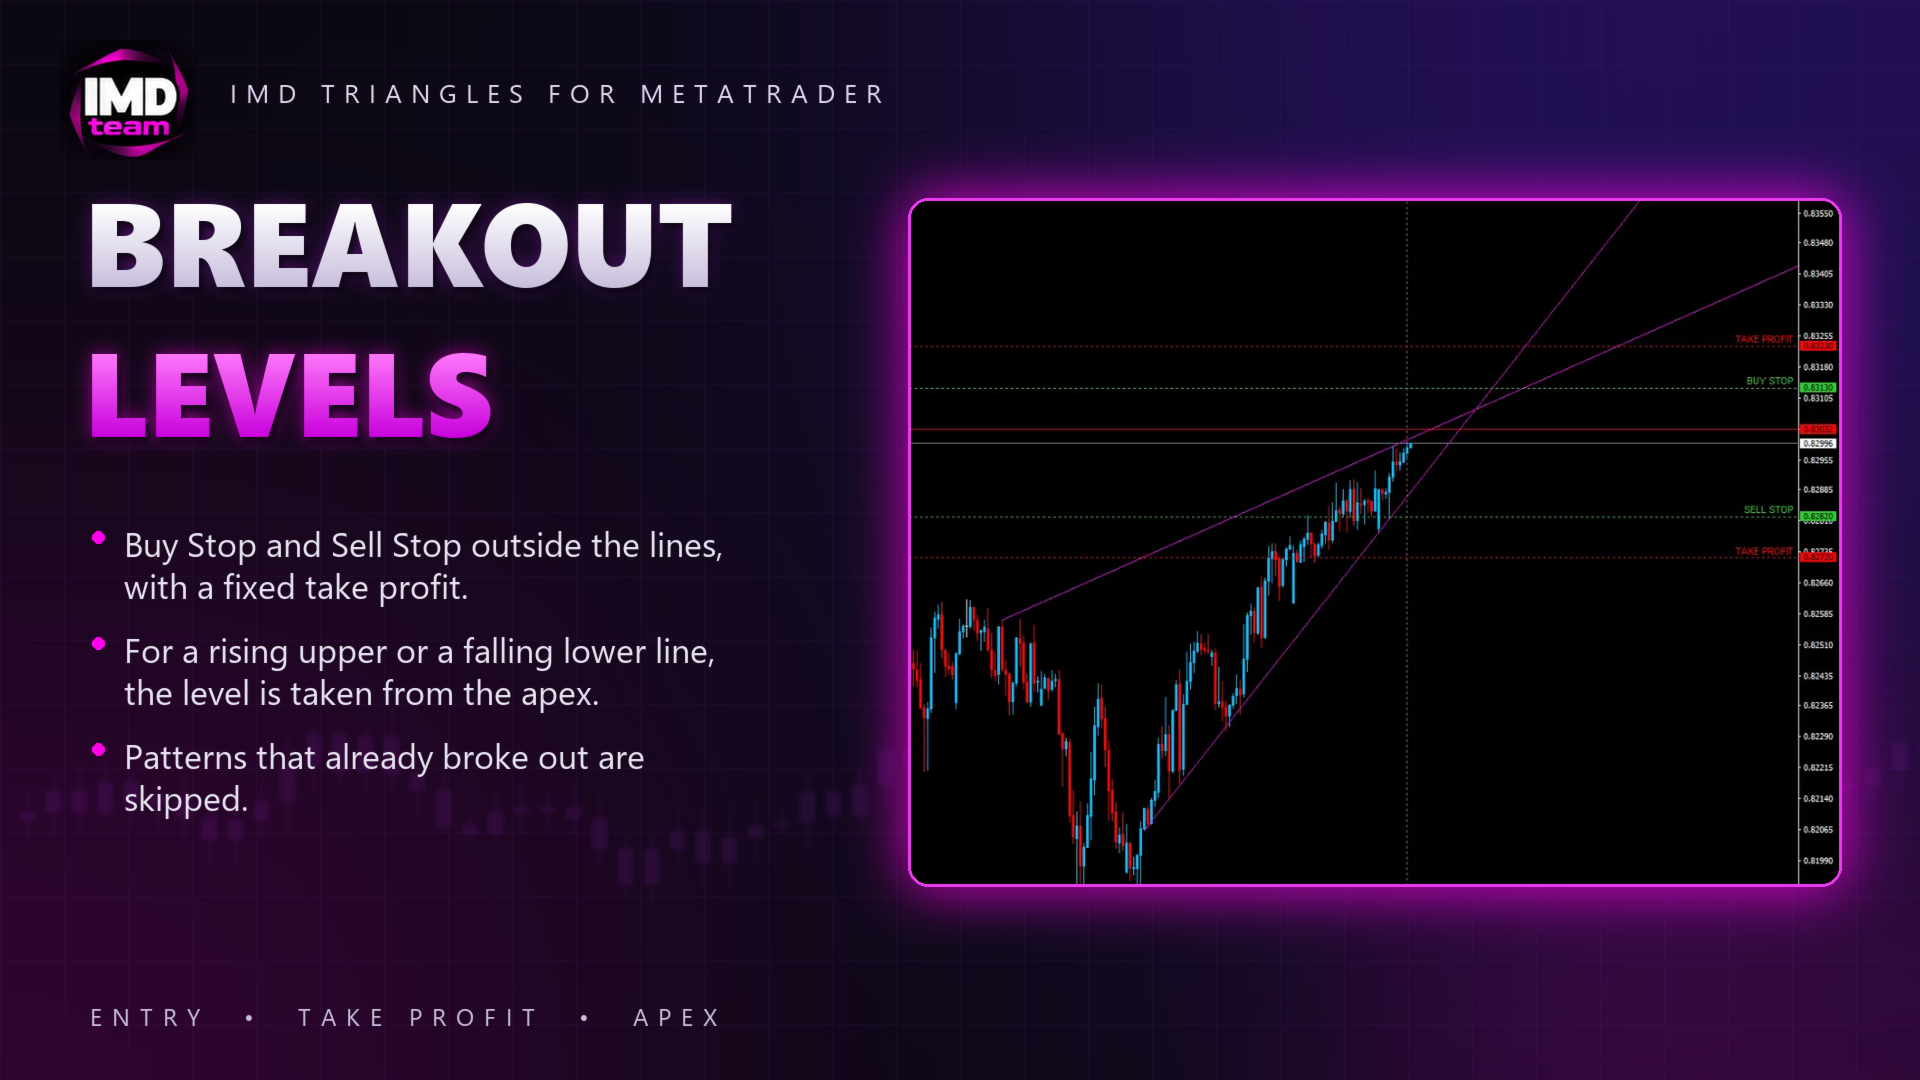
Buy Stop ve Sell Stop, son kapanan mumda çizgilerin dışında ayarlanan mesafeye (varsayılan 50 puan) yerleştirilir, ayarlanan adıma yuvarlanır; kâr al sabittir.

Üst çizgi yükseliyorsa tepe noktasına kadar üçgenin içinden geçer; bu yüzden Buy Stop seviyesi çizgilerin kesiştiği nokta olan tepeden alınır. Düşen alt çizgi için Sell Stop seviyesi de aynı şekilde tepeden alınır.

İki giriş birbirine çok yakınsa veya fiyat son mumlarda ya da mevcut mumda bir giriş seviyesine zaten ulaştıysa formasyon atlanır: böyle bir emir geç kalmış olur.

Fibonacci filtresi

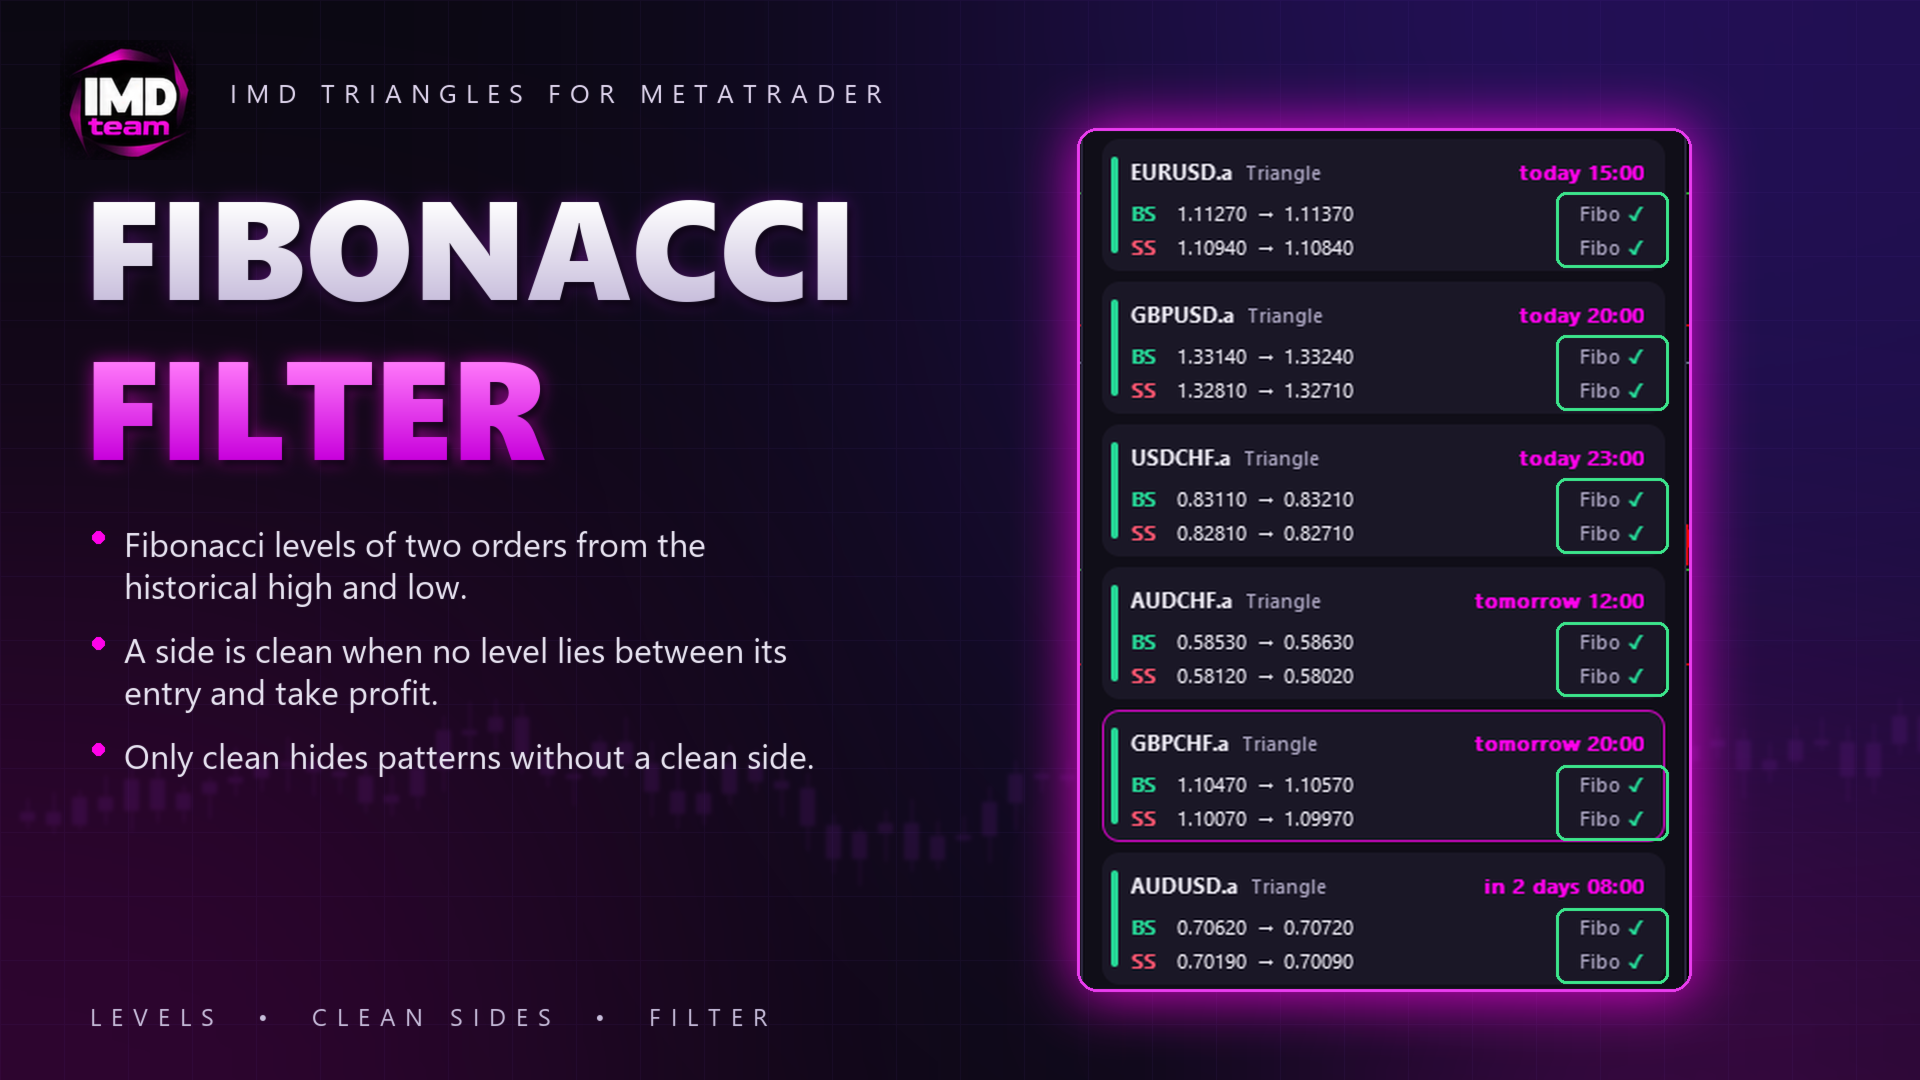
Sembolün tarihsel en yüksek ve en düşük noktasından iki düzeyli Fibonacci seviyeleri oluşturulur. Girişi ile kâr alı arasında hiçbir seviye olmayan taraf temiz olarak işaretlenir. «Sadece temiz» anahtarı temiz tarafı olmayan formasyonları gizler.

Panel

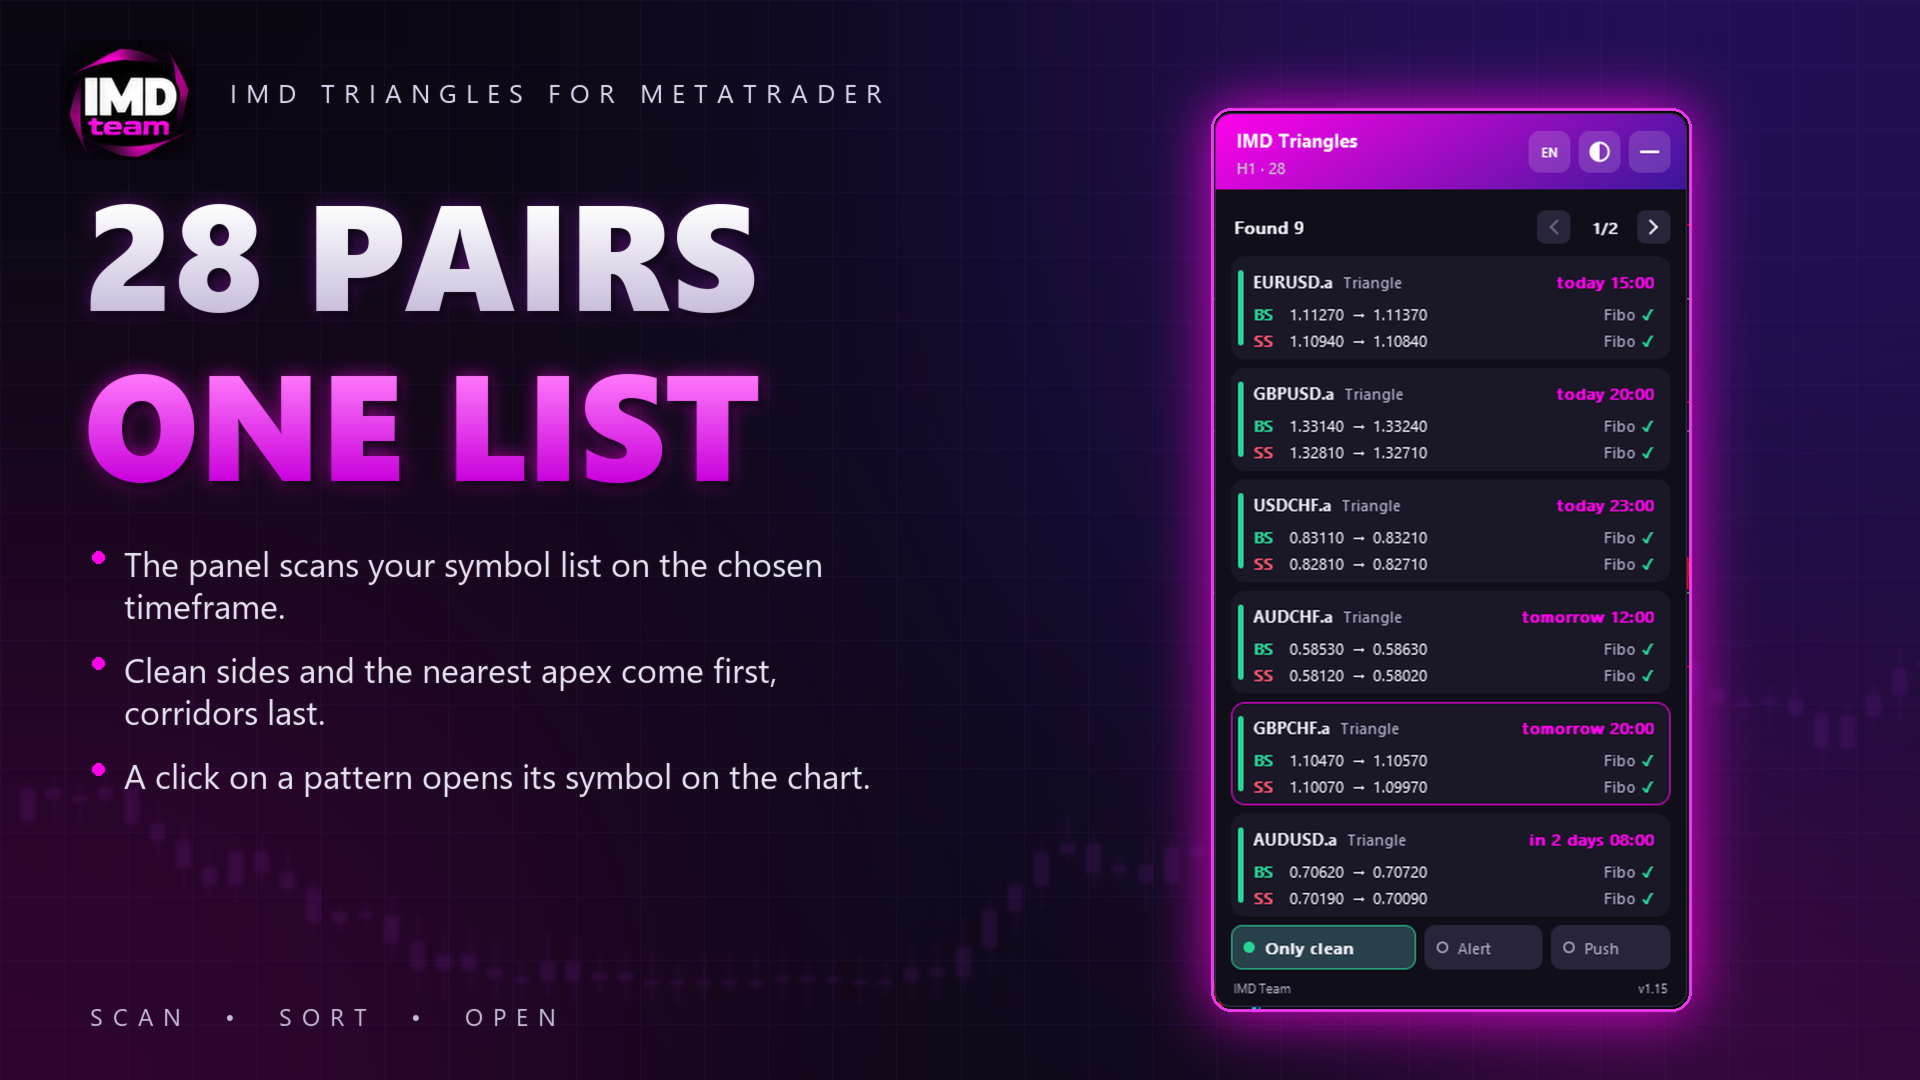
• Sayfa sayfa formasyon listesi: sembol, formasyon türü, tepe zamanı, kâr al ile Buy Stop ve Sell Stop ve her taraf için Fibonacci işareti. Temiz tarafı olan ve tepesi daha yakın formasyonlar önce, kanallar en sonda gelir.
• Bir formasyona tıklamak sembolünü grafikte açar; çizgiler ve seviyeler orada çizilir.
• Paneldeki anahtarlar: «Sadece temiz», «Uyarı», «Push».
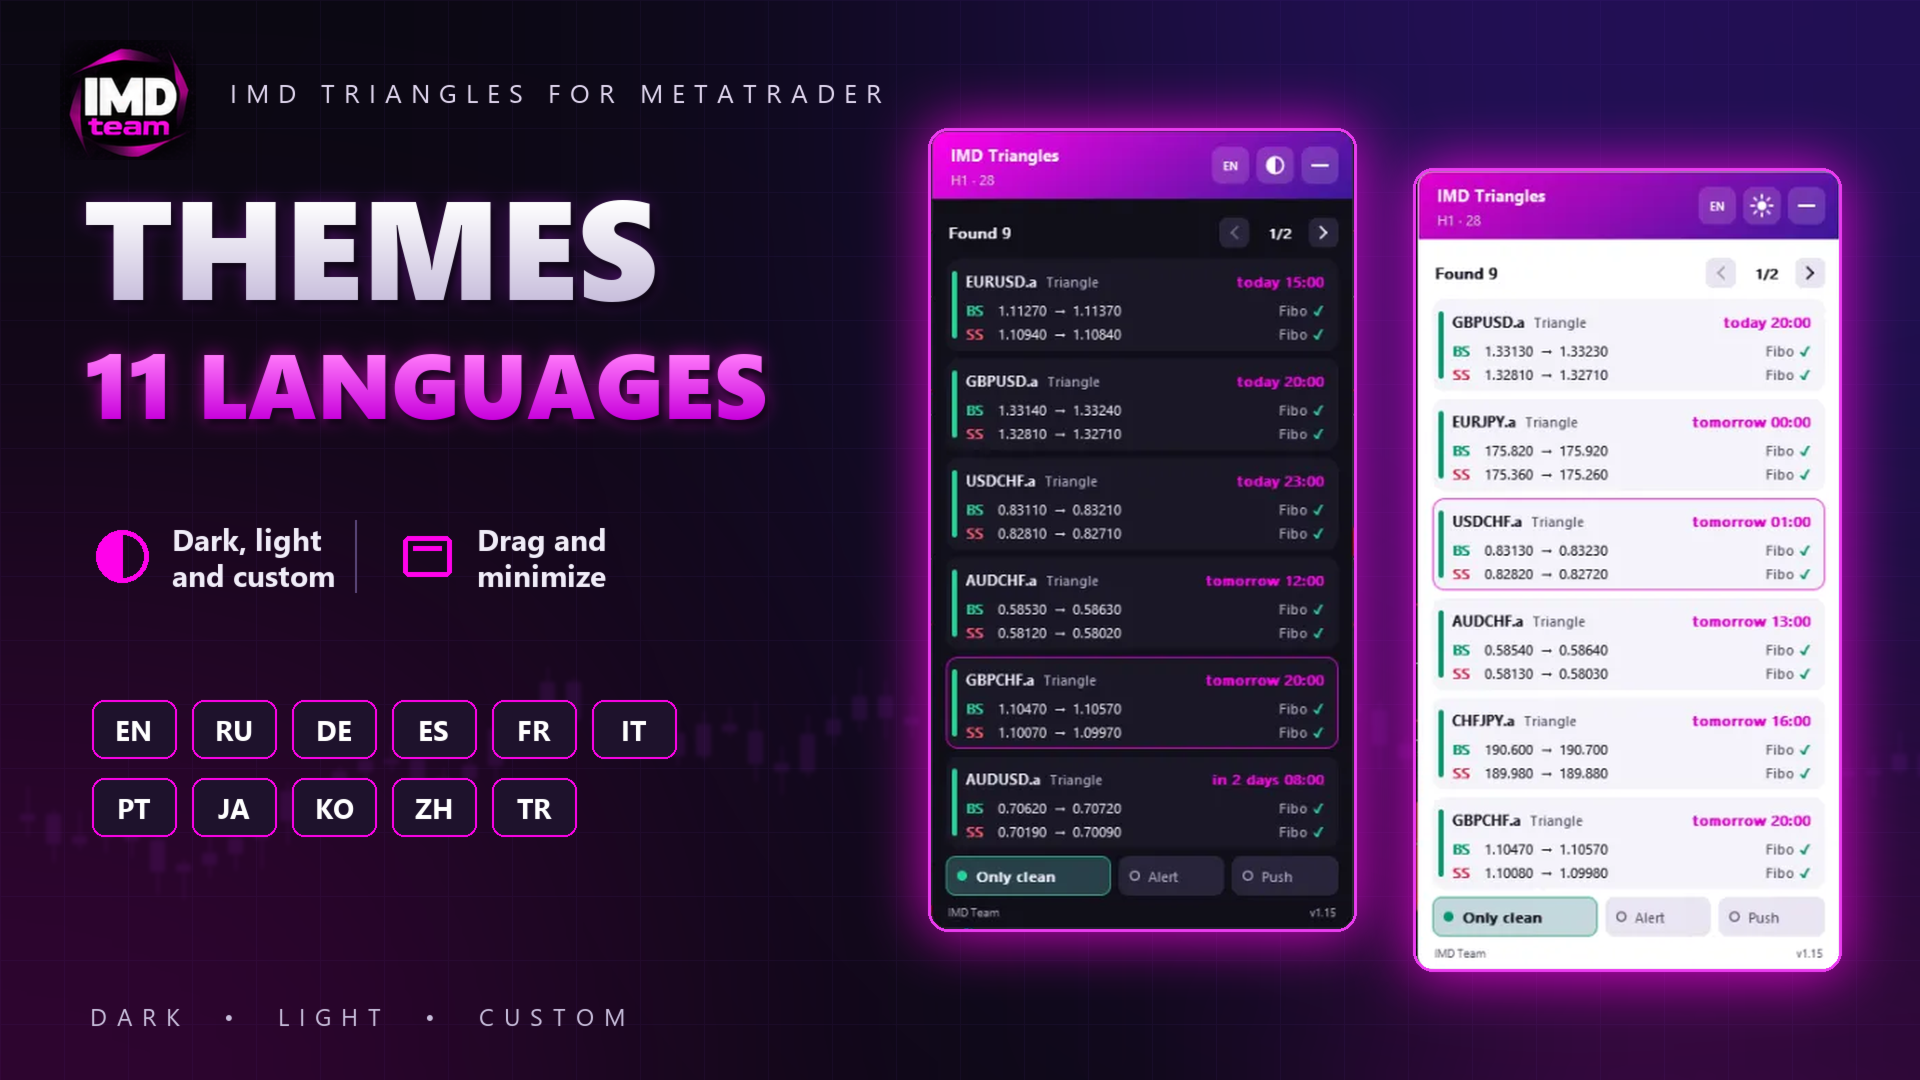
• Koyu, açık ve özel tema, 11 arayüz dili, sürükleme ve küçültme.

Bildirimler

Yeni bir formasyon belirdiğinde uyarı ve push bildirimi. Push bildirimleri varsayılan olarak kapalıdır.

Parametreler

• Tarayıcı: sembol listesi (aracı kurumun önek ve sonekleri otomatik bulunur), zaman dilimi, tarama penceresi, geçmiş testi zamanı.
• Çizgiler: temas toleransı, iki temas arasındaki en az mum sayısı, son temasın yaşı, temas sayılmayan son mum sayısı, ilk tabanın en az yüksekliği, tepe için gün sınırı, kanal ayarları.
• Emirler: giriş mesafesi, kâr al, girişler arasındaki en az mesafe, yuvarlama adımı, girişine zaten ulaşılmış formasyonları atlama.
• Fibonacci filtresi: başlangıç tarihi ve seviyeler.
• Grafik ve panel: renkler, çizgi kalınlığı, bildirimler, dil, tema, konum, ölçek, sayfa başına formasyon sayısı.

Notlar

Mesafeler 5 haneli fiyatların (JPY çiftlerinde 3 haneli) puanlarıyla ayarlanır; 4 ve 2 haneli fiyatlar otomatik olarak dönüştürülür.

İlk çalıştırmada gösterge listedeki tüm sembollerin geçmişini indirir, bu yüzden ilk tarama birkaç saniye sürebilir. Fibonacci filtresi için aylık geçmiş birkaç dakika sürebilir; yüklenene kadar panelde Fibonacci işareti yerine «…» görünür.

Strateji test cihazında gösterge yalnızca test edilen sembolü tarar.

Geçmiş testi: parametrelerde geçmiş bir sunucu zamanı belirtin; gösterge piyasayı o andaki haliyle analiz eder ve formasyon listesini «Uzmanlar» günlüğüne yazar.

İşlem yapmak risk içerir. Geçmişte bulunan formasyonlar gelecekteki sonuçları garanti etmez.

Her türlü sorunuz için MQL5.com üzerinden yazara özel mesaj gönderin.
Önerilen ürünler
PTW NON REPAINT TRADING SYSTEM + HISTOGRAM Non-Repainting ,   Non-Redrawing   and   Non-Lagging  Trading System. Does the following: - Gives Accurate Entry and Exit Points - Scalping, Day and Swing Trading  - 95% Accuracy  - Targets, where to take profits. - Shows Trends, Support and resistance levels - Works on All Brokers - Works on All Currencies, CFDs and Stocks - It does not place trades for you, it only shows you what trades to place. - It works on All Timeframes - It is for Trend or ran
Gold Strike Predator
Ignacio Agustin Mene Franco
GoldStrike Predator – Professional Expert Advisor for XAUUSD GoldStrike Predator is an advanced, high-precision Expert Advisor (EA) designed exclusively for trading the XAUUSD pair (Gold vs. US Dollar) on the MetaTrader 4 platform. Developed with a sophisticated hybrid architecture, it combines multiple layers of technical and predictive analysis to identify high-probability opportunities in the gold market, one of the world's most volatile and profitable instruments. Trading Strategy The sys
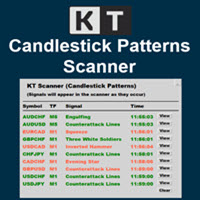
KT Candlestick Patterns Scanner is a Multi-Symbol and Multi-Timeframe scanner that fetches and shows various candlestick patterns on 28 currency pairs and 9 time-frames concurrently . The scanner finds the candlestick patterns by loading the KT Candlestick Patterns indicator as a resource in the background. Features The scanner can find the candlestick patterns on 252* combinations of symbols and time-frames from a single chart. Open the signal's chart loaded with a predefined template with a s
Boost binary option profesional
Sebastian Alejandro Merino Sepulveda
Binarias & Forex (+90% Ratio-Win Next Candle) Espere que el precio llegue a una buena zona (fuerte) sea soporte, resistencia, zona de oferta o demanda, fibonacci level key, cifra redonda. Haciendo lo anterior definitivamente habrá una reversión en el precio y obtendrá su ITM en primera vela dando una efectividad del 100% siguiendo la tendencia. Es muy importante estar atento a las noticias fundamentales en el mercado y estas no afecten tu trading. Sesiones comerciales: cualquiera (24 horas).
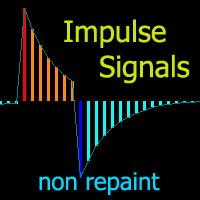
Grafikleri yapılandıran ve döngüsel fiyat hareketlerini belirleyen teknik bir gösterge. Herhangi bir grafik üzerinde çalışabilirim. Birkaç çeşit bildirim var. Grafiğin kendisinde ek oklar var. Tarihe yeniden bakmadan, mumun kapanışına dair çalışmalar. M5 ve üzeri TF önerilir. Kullanımı ve yapılandırması kolay parametreler. Farklı parametrelere sahip 2 indikatörü kullanırken, bunları diğer indikatörler olmadan da kullanabilirsiniz. 2 giriş parametresi vardır Döngüsellik ve Sinyal Süresi Bu 2 pa
This EA can run on every currencies pairs recommend EURUSD, USDJPY, EURJPY, GBPUSD Timeframe 30 Minute (M30) The important advantage of this EA is that you can start to trade with $1000 min imum initial Deposit. And the robot can support your manual transactions on EURUSD. ACCOUNT LEVERAGE: 1:100 ACCOUNT (Stop Out): 50% or less ACCOUNT TYPE: Real account ACCOUNT MODE: Hedging account Take Profit: Automatically Stop Loss: Automatically LOT size: Manual first order
This is a professional Trend Sim indicator. The intelligent algorithm of the Trend Sim indicator accurately detects the trend, filters out market noise and generates input signals and exit levels. Functions with advanced statistical calculation rules improve the overall performance of this indicator. The indicator displays signals in a simple and accessible form in the form of arrows (when to buy and when to sell). Knowing the entry point of each of the currencies is very important for every f
Lunexa MT4
Aren Davidian
Lunexa – The Intelligent Trading Robot MT5 Version   :   h ttps://www.mql5.com/en/market/product/143765 products List :   https://www.mql5.com/en/users/arendav/seller Signals:   https://www.mql5.com/en/signals/2341558 Why Lunexa? In the ruthless world of trading, there's no place for luck—only intelligent algorithms and adaptive systems survive. Lunexa is the result of over 20 years of research, development, and testing on more than 2 million real market data points, built with o
Trend Analysis in act
Ihab Mohamed Kamal Fouda
The Trend Analysis Indicator is an innovative tool designed for traders and investors who seek to navigate the complexities of the financial markets with greater precision and insight. This powerful indicator is engineered to adeptly identify whether a market is trending or not, offering users a vital edge in their trading strategy. Key Features: Accurate Trend Detection : The core functionality of the Trend Analysis Indicator lies in its ability to accurately detect market trends. It analyzes p
Description: EuroPulse EMA Trend — EMA 34/144 Trend Following EA with ADX Filter (Swap-Free) PRODUCT OVERVIEW EuroPulse EMA Trend is a premium automated trading solution designed for MetaTrader 4, specialized for the EURUSD currency pair. The EA implements a fast and reliable trend-following strategy: • EMA 34/144 crossover for trend direction • ADX 14 filter for trend strength confirmation • ATR-based stop loss and take profit • Daily loss protection • Swap-Free mode for Islamic acco
Proinsta78
Mikhail Bilan
3.5 (4)
Good afternoon friends! At the request of buyers, now when conditions for buying or selling are met, the indicator will send an alert and push notifications. Push notifications come to the phone, provided that you have the MQL application installed. You just need to enter your MetaQuoteID in the application. You can find it in the MT4 platform in the Service - Settings - Notifications section. I showed the conditions for the signal in the form of screenshots in the section screenshots 1-2 phot


TR Basket System
Meshari F M Alkhawaled
TR_BASKET_SYSTEM v3.5 Institutional-Grade Basket Trading System The Problem Most grid systems fail for one reason: They don’t know when to stop. They keep adding positions blindly… Until the account is gone. The Solution TR_BASKET_SYSTEM is built differently. This is not a random grid EA. This is a defensive, structured, multi-layer trading system designed to: Control risk Adapt to market conditions Protect equity And exit intelligently What Makes It Different? This system does NOT rely on entr
Trade Invest Pro - Kripto para dünyasında patron! Bu gösterge kripto para ticareti için idealdir! Trade Invest Pro üzerinde çalışmak yarım yılımızı aldı! Ama boşuna değil! Şimdi sadece destek yakınında doğru sinyaller - direnç seviyeleri! İkili opsiyonlar için m5 m15 zaman dilimlerinde kendini iyi gösterdi! İsteğe bağlı olarak, m30 ve daha fazlası için forex için yapılandırılabilir! Haberlere iyi tepki veriyor! boyamaz! ve programdan kaybolmaz! Kırmızı ok göründüğü anda, düşüş için bir
Algo Trading Indicaor  With this indicator , you’ll have zones and trends that hight probability the price will reverse from it. so will gives you all the help that you need  MT5 Version                    https://www.mql5.com/en/market/product/170028 MT4 Version                    https://www.mql5.com/en/market/product/88034 Why should you join us !?  1-This indicator is logical since it’s working in previous days movement , to predict the future movements. 2-Algo trading indicator will hel
AuroraV5
Ron Fritzhugh Bryan
I could write a fantastic description with lots of quantitative testing parameters but we have a saying that "taste of a pudding is in the eating " so I will simple put a CHALLENGE :Test this EA on any of the major and minor pairs (AUD,USD,EUR,CHF,NZD )and I guarantee you  50% discount if you can prove in a test on any of the major pairs above  that you have incurred  more than 3 error runs. *NOW HAPPY TESTING* Then you get to write the description unhindered!!!!!!!!!!!!!!!!!!!!!!!!!!!!!!!
Linear Trend Predictor - Giriş noktalarını ve yön destek çizgilerini birleştiren bir trend göstergesi. Yüksek/Düşük fiyat kanalını kırma prensibiyle çalışır. Gösterge algoritması piyasa gürültüsünü filtreler, oynaklığı ve piyasa dinamiklerini dikkate alır. Gösterge yetenekleri  Düzeltme yöntemleri kullanılarak piyasa trendi ve ALIM veya SATIŞ emirlerinin açılabileceği giriş noktaları gösterilir.  Herhangi bir zaman dilimindeki grafikleri analiz ederek kısa ve uzun vadeli piyasa hareketlerini
NRP Surge EA MT4
Black Panther AI
Product Title: NRP Surge EA Description: Looking for the MetaTrader 5 version? > The MT5 version with native news filtering is available here: https://www.mql5.com/en/market/product/178954   SEE THE LIVE TRACK RECORD:   Watch this algorithm execute in real-time on our verified AquaFunded 10K Live Signal account here:   View Live Trading Signal & Performance The NRP Surge EA is a commercial-grade, institutional volume sniper engineered exclusively for the H1 timeframe. Designed for the mo
Al in one level
Kundan Kumar Srivastava
5 (1)
This indicator is collection of important dynamic support and resistance giving a trader crystal clear idea , where to sell and where to buy. it completely complements trend lines, support, resistance, and sideways market and allow a trader to make sustainable profits. The thickness of lines suggests its strengths, the thicker the dynamic line, the stronger is rejection or pullback allowing a trader to make multi-fold profit, as they can clearly see them. Introducing Your Ultimate Trading Edge:
This is a simple arrow system based on Engulfing Candlestick Pattern. It gives you alerts on your smartphone when there is an engulfing candlestick pattern happens. Which type of alerts available? 1. It paints on chart Up/Down Arrows. 2. Popup message and sound alert in trading terminal window. 3. Push notification or Alert on your Android and IOS mobile phones (requires MT4 or MT5 app installed!) *Note: Use it on higher timeframes like H4 (4 hours), D1 (1 Day) then find trade opportunities on s
G2 Entry Signal MT4
Ida Bagus Putu Mahardika
G2 ENTRY SIGNAL by Ida Bagus Putu Mahardika STRATEGY DESCRIPTION G2 Entry Signal is a professional multi-strategy entry dashboard that combines top-down analysis with 3 proven trading strategies in one powerful indicator. Designed for traders who demand clarity, accuracy, and actionable signals, this tool filters market noise and delivers high-probability entry opportunities directly on your chart. KEY ADVANTAGES 1. 3 STRATEGIES IN ONE DASHBOARD Strategy 1 – London Session Breakout:   Capt
FREE
I will support only my client. สำหรับลูกค้า Parameters General Trade Settings Money Management  Lot : Fixed (can change) Strategies  - H1 and H4 Strategies you can using both it is fixed with MA, Bollinger band, Candlestick Levels Close Functions  - H1 and H4 Strategies you can using both MagicNumber  - individual magic number. The EA will only manage position of the chart symbol with this magic number. NextOpenTradeAfterMinutes  - 20 minutes is default, can change it MaxSpread  - upto currenc
Pip Professional
Yaroslav Varankin
Pip Professional: A Reliable Advisor Pip Professional is a reliable advisor that operates on a new algorithm featuring three filters and uses moving averages (MA) to determine the trend. Recommendations: Max Spread: Trades will not be opened once the set spread value is reached. Slippage: Deviation from the price at the moment of order opening. Take Profit: 40 pips. Stop Loss: 35 pips. Lots: Trade size of 0.1. Timeframe: From M1 to D1. Currency Pairs: GBPUSD, EURUSD, and others. You can test th
KT Absolute Strength MT4
KEENBASE SOFTWARE SOLUTIONS
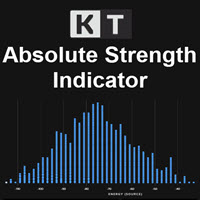
KT Absolute Strength measures and plots the absolute strength of the instrument's price action in a histogram form. It combines the moving average and histogram for a meaningful illustration. It supports two modes for the histogram calculation, i.e., it can be calculated using RSI and Stochastic both. However, for more dynamic analysis, RSI mode is always preferred. Buy Entry When the Absolute Strength histogram turns green and also it's higher than the previous red column. Sell Entry When th
NosTraderMus_RegLin_PRO Doğrusal Regresyon, MTF filtreleri ve aktif pozisyon yönetimine sahip profesyonel EA (Expert Advisor) Öneri: testlere M5 (5 dakika) zaman diliminde başlayın. NosTraderMus_RegLin_PRO; nicel, disiplinli ve tekrarlanabilir bir yaklaşım arayan trader’lar için tasarlanmıştır. EA, doğrusal regresyon kanalı ile değer bölgelerini tespit eder ve yalnızca bağlam (RSI, DeMarker, çok zaman dilimli momentum, hacim ve spread) desteklediğinde işlem açar. Her pozisyonu aktif ve uyarlanab
Cancer
Vitalii Zakharuk
Cancer indicator is great for trend trading! An intelligent indicator algorithm with high probability shows the points of potential market reversal. If you are trading in a trend, then a trading strategy built on the basis of this indicator is perfect for you. The indicator filters out market noise, almost everything and all the necessary functions for working with a thread are built into one tool. It works on all currency pairs and on all timeframes, indicator setting - according to your desire
EMA Dashboard
Chantal Sala
1 (1)
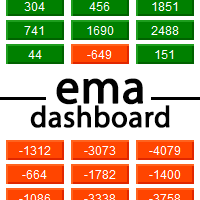
Ema Dashboard is an innovative dashboard that allows you to monitor Moving Average on multiples symbols and different timeframes. This dashboard allows you to analyze information on 28 pairs on an unique chart. Its functionality includes analysis of All Time Frames. This configuration allows you to identify the Long Term Trend with extreme ease. This panel allows you to take very important directional movements. A click on button opens a new chart (symbol and timeframe). Graphic Object Symbol l
The Trend Professor is a moving average based indicator designed for the purpose of helping the community of traders to analyse the price trend. The indicator will be displayed in the main chart as it is indicated on the screenshot section. How it works The indicator has lines of moving averages and colored histograms to depict the direction of the trend. There will be a fast signal line colored blue/yellow/red at some points. The red/yellow colored lines stands for bearish trend/signal while th
The indicator is like a mother-in-law, who talks often, talks a lot and often inappropriately. The indicator, in addition to giving us an entry signal on parameters which I will then list, monitors the trend of the hourly timeframe, OSMA to understand the entry direction, RSI to sense any overbought or oversold conditions from which to abstain, ATR for the volatility and ADX for the trend. Indicator not recommended for newbies. Only the human judgment of these parameters, combined with the entr
Evoque Global
Muhammad Mubashir Mirza
Evoque Global – Reliable Automated Hedging The price will keep increasing by $100 with every  single purchase, so don't be late. Evoque Global   offers a hands-free, adaptive trading solution designed to deliver consistent profits with controlled risk. Using a smart hedging approach, it balances trades to reduce drawdowns and maximize smooth equity growth. This expert advisor works seamlessly in all market conditions—trending or ranging—automatically managing entries, exits, and trade sizes wit
Quantum Frequency Indicator (QFI) The World’s First Universal Market Frequency Analyzer for MT4 Trade Forex, Crypto, and Stocks With Up To 98% Accuracy Discover the Indicator That Decodes the Hidden Frequency of the Market After 14 years of research into market vibration and frequency science, a revolutionary breakthrough has arrived. The Quantum Frequency Indicator (QFI) reads the internal frequency of any financial market and generates ultra-precise Buy & Sell signals—before major moves
Bu ürünün alıcıları ayrıca şunları da satın alıyor
Miraculous Indicator Binary & Forex v3 StrategySafe Miraculous Indicator Binary & Forex v3 StrategySafe , net sinyaller, güçlü onay araçları ve Binary ile Forex piyasalarında kullanılabilecek yapılandırılmış bir işlem yaklaşımı isteyen traderlar için geliştirilmiş profesyonel bir indikatördür. v3 sürümü; MIR Dashboard, Miraculous Confirmation Dashboard, GANN Law, Square of 9 seviyeleri, GANN açıları ve daha gelişmiş Forex modu ile daha güçlü bir piyasa analizi sunar. Öne çıkan özellikler Tek ind
FFx Engulfing Setup Alerter gives trade suggestions with Entry, Target 1, Target 2 and StopLoss. Below are the different options available: Entry suggestion - pips to be added over the break for the entry 3 different options to calculate the SL - by pips, by ATR multiplier or at the pattern High/Low 3 different options to calculate the 2 TPs - by pips, by ATR multiplier or at Risk/Reward Offset the dashboard - any place on the chart Remove the suggestion once the price reached the SL line Lines
FFx InsideBar Setup Alerter gives trade suggestions with Entry, Target 1, Target 2 and StopLoss. Below are the different options available: Entry suggestion - pips to be added over the break for the entry Minimum candle size - to avoid too close buy/sell entry suggestions 3 different options to calculate the SL - by pips, by ATR multiplier or at the pattern High/Low 3 different options to calculate the 2 TPs - by pips, by ATR multiplier or at Risk/Reward Offset the dashboard - any place on the c
FFx OutsideBar Setup Alerter gives trade suggestions with Entry, Target 1, Target 2 and StopLoss. Below are the different options available: Entry suggestion - pips to be added over the break for the entry. 3 different options to calculate the SL - by pips, by ATR multiplier or at the pattern High/Low. 3 different options to calculate the 2 TPs - by pips, by ATR multiplier or at Risk/Reward. Offset the dashboard - any place on the chart. Remove the suggestion once the price reached the SL line.
FFx PinBar Setup Alerter gives trade suggestions with Entry, Target 1, Target 2 and StopLoss. Below are the different options available: Entry suggestion - pips to be added over the break for the entry Minimum candle size - to avoid too small candles 3 different options to calculate the SL - by pips, by ATR multiplier or at the pattern High/Low 3 different options to calculate the 2 TPs - by pips, by ATR multiplier or at Risk/Reward Offset the dashboard - any place on the chart Remove the sugges
The purpose of this new version of the MT4 standard indicator provided in your platform is to display in a sub-window multiple timeframes of the same indicator with its divergences. See the example shown in the picture below. But the display isn't like a simple MTF indicator. This is the real display of the indicator on its timeframe. Here's the options available in the FFx divergences indicator: Select the timeframes to be displayed (M1 to Monthly) Define the width (number of bars) for each tim
The purpose of this new version of the MT4 standard indicator provided in your platform is to display in a sub-window multiple timeframes of the same indicator with its divergences. See the example shown in the picture below. But the display isn't like a simple MTF indicator. This is the real display of the indicator on its timeframe. Here's the options available in the FFx divergences indicator: Select the timeframes to be displayed (M1 to Monthly). Define the width (number of bars) for each ti
The FFx Dashboard MTF alerter will show you on a single chart all the timeframes (M1 to Monthly) with their own status for the indicator. 2 Alert Options: Single timeframe: each selected timeframe alert separately when a signal occurs Multi timeframes: all selected timeframes must agree for an alert to be triggered Both options have an input to select the timeframes to be used for the alert(s). How to Understand the Status: Green/Red square: histogram above/below 0 line Green square + Red bord
The FFx Dashboard MTF alerter will show you on a single chart all the timeframes (M1 to Monthly) with their own status for the indicator. 2 Alert Options: Single timeframe: each selected timeframe alert separately when a signal occurs Multi timeframes: all selected timeframes must agree for an alert to be triggered Both options have an input to select the timeframes to be used for the alert(s). How to understand the status: Green/Red square: RSI above/below 50 line Green square + Red border: R
The FFx Dashboard MTF alerter will show you on a single chart all the timeframes (M1 to Monthly) with their own status for the indicator. 2 Alert Options: Single timeframe: each selected timeframe alert separately when a signal occurs Multi timeframes: all selected timeframes must agree for an alert to be triggered Both options have an input to select the timeframes to be used for the alert(s). How to understand the status: Green/Red square: Stoch above/below 50 line Green square + Red border:
The FFx Dashboard MTF alerter will show you on a single chart all the timeframes (M1 to Monthly) with their own status for the indicator. 2 Alert Options: Single timeframe: each selected timeframe alert separately when a signal occurs Multi timeframes: all selected timeframes must agree for an alert to be triggered Both options have an input to select the timeframes to be used for the alert(s). How to understand the status: Green/Red square: Price above/below Cloud (Kumo) Green square + Red bo
The FFx Dashboard MTF alerter will show you on a single chart all the timeframes (M1 to Monthly) with their own status for the indicator. 2 Alert Options: Single timeframe: each selected timeframe alert separately when a signal occurs Multi timeframes: all selected timeframes must agree for an alert to be triggered Both options have an input to select the timeframes to be used for the alert(s). How to understand the status: Green/Red square: MA pointing Up/Down Green square + Red border: MA po
The FFx Dashboard MTF alerter will show you on a single chart all the timeframes (M1 to Monthly) with their own status for the indicator. 2 Alert Options: Single timeframe: each selected timeframe alert separately when a signal occurs. Multi timeframes: all selected timeframes must agree for an alert to be triggered. Both options have an input to select the timeframes to be used for the alert(s). How to understand the status: Green square: Price above PSAR Red square: Price below PSAR Options
The FFx Dashboard MTF alerter will show you on a single chart all the timeframes (M1 to Monthly) with their own status for the indicator. 2 Alert Options: Single timeframe: each selected timeframe alert separately when a signal occurs Multi timeframes: all selected timeframes must agree for an alert to be triggered Both options have an input to select the timeframes to be used for the alert(s). How to understand the status: Green/Red square: CCI above/below levels (ie. 100/-100) Grey square: C
The FFx Dashboard MTF alerter will show you on a single chart all the timeframes (M1 to Monthly) with their own status for the indicator. 2 Alert Options: Single timeframe: each selected timeframe alert separately when a signal occurs Multi timeframes: all selected timeframes must agree for an alert to be triggered Both options have an input to select the timeframes to be used for the alert(s). How to understand the status: Green/Red square: ADX above level Grey square: ADX below level Red bor
The FFx Dashboard MTF alerter will show you on a single chart all the timeframes (M1 to Monthly) with their own status. 2 Alert Options: Single timeframe: each selected timeframe alert separately when a signal occurs Multi timeframes: all selected timeframes must agree for an alert to be triggered Both options have an input to select the timeframes to be used for the alert(s). How to understand the status: Green/Red square: bullish/bearish candle Options available in the FFx Dashboard Alerter
The [GRAFF] III manual trading system is based on multiple MetaTrader (MT4) indicators. Together, the entire PACK of GRAFF III indicators makes an advanced trading tool. The system consists of over 20 different custom-built indicators which have been carefully selected and tested in the long term to produce strong and efficient trading signals. The particular indicators are based on different mathematical formulas, so the entire system is calibrated to remove false signals from its own indicator
FFx Universal Strength Meter PRO is more than a basic strength meter. Instead of limiting the calculation to price, it can be based on any of the 19 integrated strength modes + 9 timeframes. With the FFx USM, you are able to define any period for any combination of timeframes. For example, you can set the dashboard for the last 10 candles for M15-H1-H4… Full flexibility! Very easy to interpret... It gives a great idea about which currency is weak and which is strong, so you can find the best pai
Pan PrizMA CD Phase is an analogue of the МetaТrader 5 indicator , and is an option based on the Pan PrizMA indicator. Details . Averaging by a quadric-quartic polynomial increases the smoothness of lines, adds momentum and rhythm. Extrapolation by the sinusoid function near a constant allows adjusting the delay or lead of signals. The value of the phase - wave status parameter (which is close in meaning to the trigonometric phase or the angle of the radius-vector rotation in the trigonometric p
Green Wall Arrows
Daniel Luchinger
1 (1)
The Name Green Wall : Arrows hits a lot of TP, by changing the idea of non using SL as something bad, but instead use Small TP and a lot of free Margin and Patience. Use micro TP and a lot of Free Margin with this indicator on Forex. It also can be used with Binary Options. This strategy is intended to be traded Manually. This Indicator runs on Open Bar, arrows will delete when price are against it. The only Indicator Parameter is Alerts true/false, all the rest is included inside the code. Arro
Golden Monowave is monowave indicator, the monowave theory is one of Elliott wave approach and one of most complicate and accurate method. Golden Monowave can shortcut many major steps to identify and describe the monowave. It works on any timeframe and with any trading instrument, including currencies, indices, futures, etc. Input Parameters initial_Bars - set the initial number of bars to calculate. wave_color - select the color of the wave. label_color - select the color of labels. temp_labe
Ticks Size
Viktor Kolmakov
This indicator displays in a separate window the difference between the number of points which increased the price, and the number of points that decreased the price during the time interval specified in the settings. The time interval for calculation is expressed as the number of bars of the chart the indicator is attached to. This approach allows you to evaluate the movement direction (growth or fall) of the instrument's price, the strength of the movement and the size of the movement in point
MetaTrader 5 version available here : https://www.mql5.com/en/market/product/24882 FFx Basket Scanner is a global tool scanning all pairs and all timeframes over up to five indicators among the 16 available. You will clearly see which currencies to avoid trading and which ones to focus on. Once a currency goes into an extreme zone (e.g. 20/80%), you can trade the whole basket with great confidence. Another way to use it is to look at two currencies (weak vs strong) to find the best single pairs
NostradamusMT4
Andrey Spiridonov
1 (1)
NostradamusMT4 is a powerful indicator from the set of professional trader. The indicator is based on Andrei Spiridonov's original price calculation method (ESTIMATED PRICE) for the current candle price. Advantages The indicator does not redraw. It works on any timeframes. Works with any trading instruments. Perfectly suitable for scalping and trading binary options. Parameters Color - color of the ESTIMATED PRICE FUTURE line. How to work with the indicator The indicator forms the ESTIMATED P
MetaTrader 5 version available here: https://www.mql5.com/en/market/product/25794 FFx Pivot SR Suite PRO is a complete suite for support and resistance levels. Support and Resistance are the most used levels in all kinds of trading. Can be used to find reversal trend, to set targets and stop, etc. The indicator is fully flexible directly from the chart 4 periods to choose for the calculation: 4Hours, Daily, Weekly and Monthly 4 formulas to choose for the calculation: Classic, Camarilla, Fibonac
BinaryIndicator is a highly accurate indicator for trading binary options. It shows excellent results in scalping. This indicator is based in multifactor analysis of trend indicators, as well as confirmation oscillators, which in the end gives an increased accuracy of signals. Advantages of the indicator Increased accuracy of signals. Excellent results when trading binary options with a short expiration time from M30 to M1 . It works on any timeframes. Works with any trade symbols. Parameters
BinaryScalping
Andrey Spiridonov
BinaryScalping is a professional indicator for trading binary options and scalping. The algorithm of the indicator is based on the calculation of pivot points for each time period separately, the location of the price of the trading instrument relative to the pivot points is analyzed and the probability of a trading operation is calculated. The indicator has a built-in filter of trading signals based on the global trend. The indicator is installed in the usual way and works with any trading inst
Yazarın diğer ürünleri
IMD Gold EA
Aleksei Chedaev
IMD Gold EA – Grid trading veya martingale stratejisi kullanmayan, her işlemde Stop Loss bulunan adaptif bir işlem robotu. Robotları tartışmak için sohbet: katıl Robotun gerçek zamanlı sinyalleri: aç IMD GOLD EA: Altın (XAUUSD) için Uzman Danışman Nedir. IMD GOLD EA, altını önemli destek ve direnç seviyelerinden işlem yapar. Giriş kararlarını birbirinden bağımsız ve paralel çalışan altı algoritma verir. Bu, sistemi çeşitlendirir: bir yaklaşım zayıf dönem geçirirse diğerleri çalışmaya devam ed
IMD TP SL Manager — pozisyon sepeti için kâr al ve zarar durdur yönetimi Takım robotları hakkında konuşmak için sohbet odasına katılın : IMD TP SL Manager, bir enstrümanda birden fazla pozisyon taşıyan ve bunları önceden belirlenmiş bir finansal sonuçta kapatmak isteyen yatırımcılar için yardımcı bir Uzman Danışmandır (EA). Hedefi bakiyenin yüzdesi veya hesap para birimi cinsinden bir tutar olarak belirlersiniz. EA; ortalama fiyatı, swapları ve komisyonları dikkate alarak tüm pozisyon grubu i
FREE
IMD Fibo MT5
Aleksei Chedaev
5 (1)
IMDFIbo, geçmiş verilere dayalı olarak Fibonacci seviye ızgarasını otomatik olarak oluşturan bir MetaTrader 5 terminal göstergesidir. Bu araç, fiyat grafiğindeki potansiyel destek ve direnç bölgelerini görselleştirmek için tasarlanmıştır. Çalışma prensibi Gösterge, belirtilen dönemdeki geçmiş fiyat en yüksek ve en düşük değerlerini analiz eder ve bunlara dayalı olarak Fibonacci seviyelerini oluşturur. Aracın ayırt edici özelliği, ızgaranın özyinelemeli olarak oluşturulmasıdır: seviyeler arasınd
FREE
IMD Fibo EA IMD Fibo EA , MetaTrader 5 için geliştirilmiş bir trading utility'dir. İşlem bölgelerini bulmaya, piyasa yönünü analiz etmeye ve hiyerarşik Fibonacci seviyelerine dayalı yapılandırılmış bir işlem planı hazırlamaya yardımcı olur. İçerdiği özellikler: çoklu sembol tarayıcısı; EMA/MACD/ADX yön analizi; üç seviyeli Fibonacci yapısı; Entry, Stop Loss ve Take Profit hesaplama; manuel limit emir paneli; sanal istatistikler. IMD Fibo EA tamamen otomatik bir trading robotu değildir. Kullanıc
FREE
IMD Fibo
Aleksei Chedaev
5 (4)
IMDFIbo, geçmiş verilere dayalı olarak Fibonacci seviye ızgarasını otomatik olarak oluşturan bir MetaTrader 4 terminal göstergesidir. Bu araç, fiyat grafiğindeki potansiyel destek ve direnç bölgelerini görselleştirmek için tasarlanmıştır. Çalışma prensibi Gösterge, belirtilen dönemdeki geçmiş fiyat en yüksek ve en düşük değerlerini analiz eder ve bunlara dayalı olarak Fibonacci seviyelerini oluşturur. Aracın ayırt edici özelliği, ızgaranın özyinelemeli olarak oluşturulmasıdır: seviyeler arasınd
FREE
Gösterge, işlem hesabınızı gerçek zamanlı olarak tarar, açık pozisyonları analiz eder ve isteğe bağlı olarak bekleyen emirleri de hesaba katar. Ardından matematiksel olarak iki önemli fiyat seviyesi hesaplar. Başabaş Çizgisi (BE) Pozisyonu kapattığınızda toplam kârınızın tam olarak sıfır olacağı fiyattır. Gösterge, komisyon ve swap maliyetlerini hesaba katarak aracı kurum maliyetlerini unutmanız nedeniyle yanlışlıkla zarar kapatmanızı önler. Hedef Çizgisi (Target/TP) Belirli bir tutarı, örneğ
FREE
IMD Trade Line
Aleksei Chedaev
5 (1)
Gösterge, işlem hesabınızı gerçek zamanlı olarak tarar, açık pozisyonları analiz eder ve isteğe bağlı olarak bekleyen emirleri de hesaba katar. Ardından matematiksel olarak iki önemli fiyat seviyesi hesaplar. Başabaş Çizgisi (BE) Pozisyonu kapattığınızda toplam kârınızın tam olarak sıfır olacağı fiyattır. Gösterge, komisyon ve swap maliyetlerini hesaba katarak aracı kurum maliyetlerini unutmanız nedeniyle yanlışlıkla zarar kapatmanızı önler. Hedef Çizgisi (Target/TP) Belirli bir tutarı, örneğ
FREE
IMD TP SL Manager — pozisyon sepeti için kâr al ve zarar durdur yönetimi Takım robotları hakkında konuşmak için sohbet odasına katılın : IMD TP SL Manager, bir enstrümanda birden fazla pozisyon taşıyan ve bunları önceden belirlenmiş bir finansal sonuçta kapatmak isteyen yatırımcılar için yardımcı bir Uzman Danışmandır (EA). Hedefi bakiyenin yüzdesi veya hesap para birimi cinsinden bir tutar olarak belirlersiniz. EA; ortalama fiyatı, swapları ve komisyonları dikkate alarak tüm pozisyon grubu i
IMD Triangles – trend çizgilerinde üçgen ve kanal tarayıcısı Takım robotları hakkında konuşmak için sohbet odasına katılın : IMD Triangles, bir sembol listesinde trend çizgilerinden oluşan üçgenleri ve yatay kanalları arayan ve kırılım için Buy Stop ve Sell Stop seviyelerini hesaplayan bir göstergedir. Gösterge işlem açmaz ve işlem kararı vermez. Formasyonu ve seviyeleri gösterir; emir verip vermemeye trader karar verir. Formasyonlar nasıl bulunur Üst çizgi mumların en yüksek, alt çizgi en
Filtrele:
Değerlendirme yok
Değerlendirmeye yanıt