PatternSentry Harmonic and Elliott Scanner
- Yardımcı programlar
- Sürüm: 1.0
- Etkinleştirmeler: 5

PatternSentry is a chart analysis Expert Advisor. It does not trade. It detects the structures a discretionary trader draws by hand, and draws them the same way on every chart and timeframe you attach it to, with a toolbar to switch each tool on and off.
What it detects
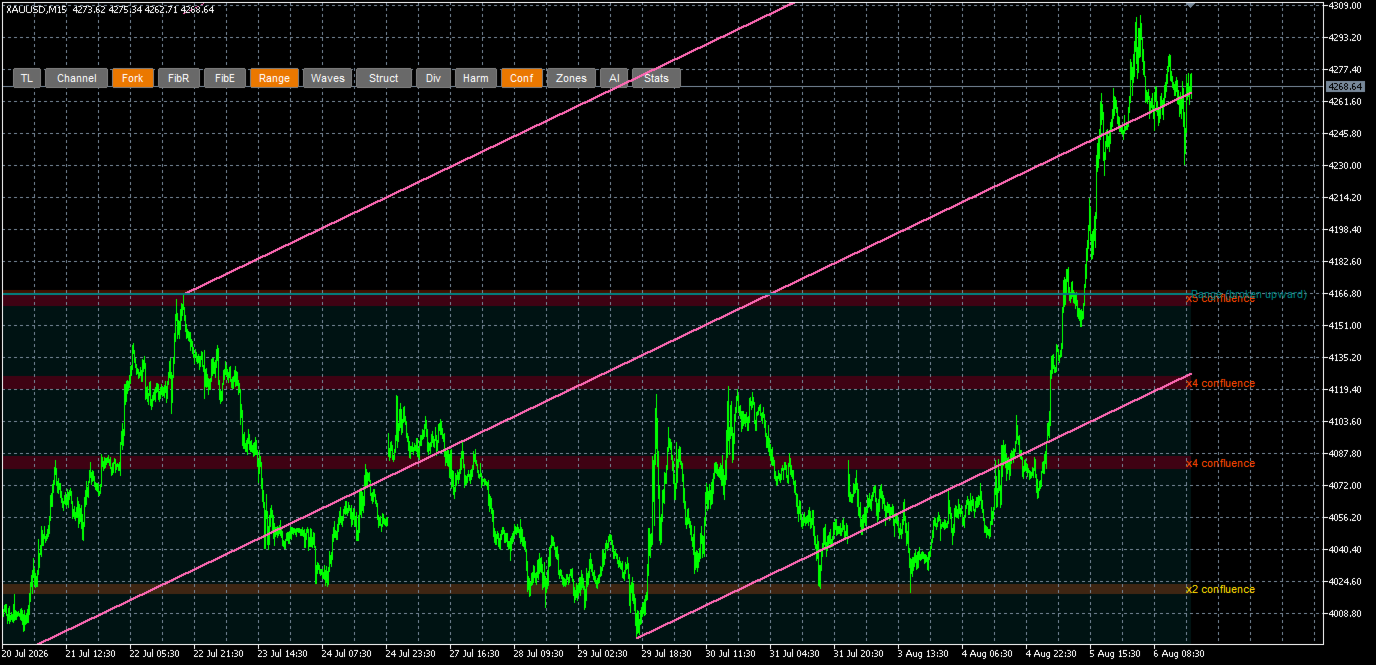
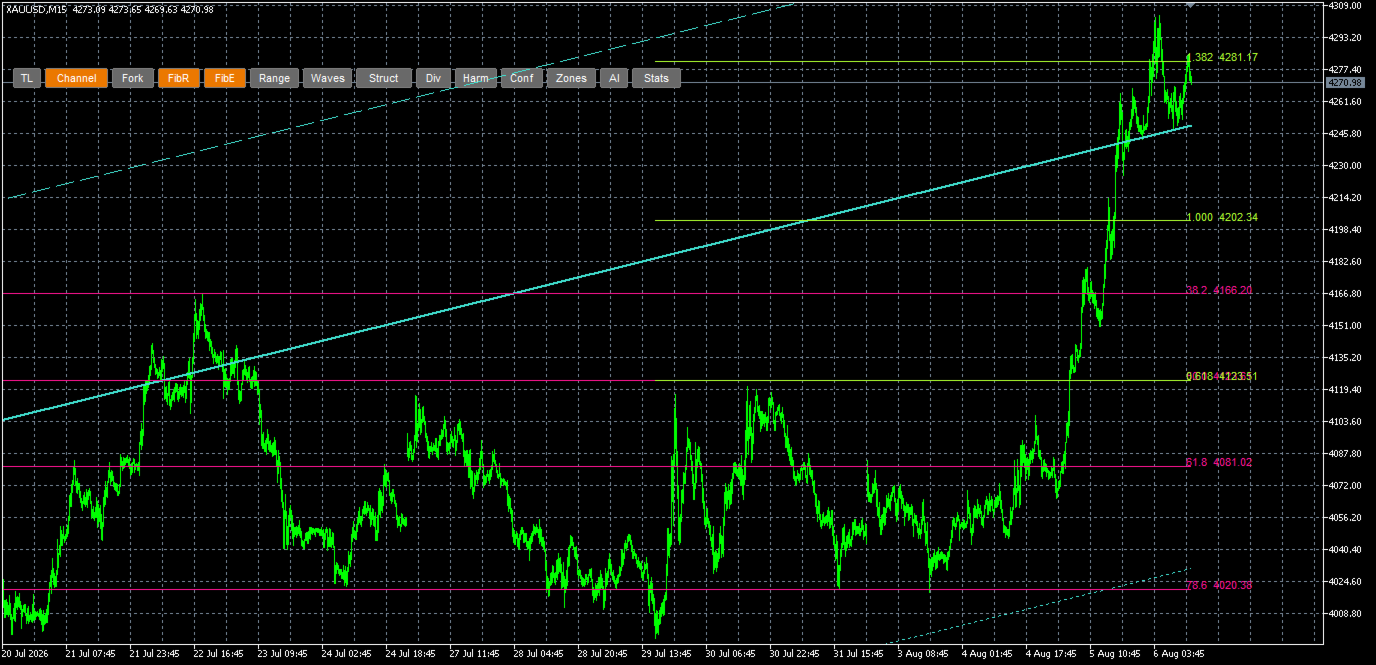
- Trend line of the current move with retest and break detection, parallel channel with midline and extensions, pitchfork from the last three pivots
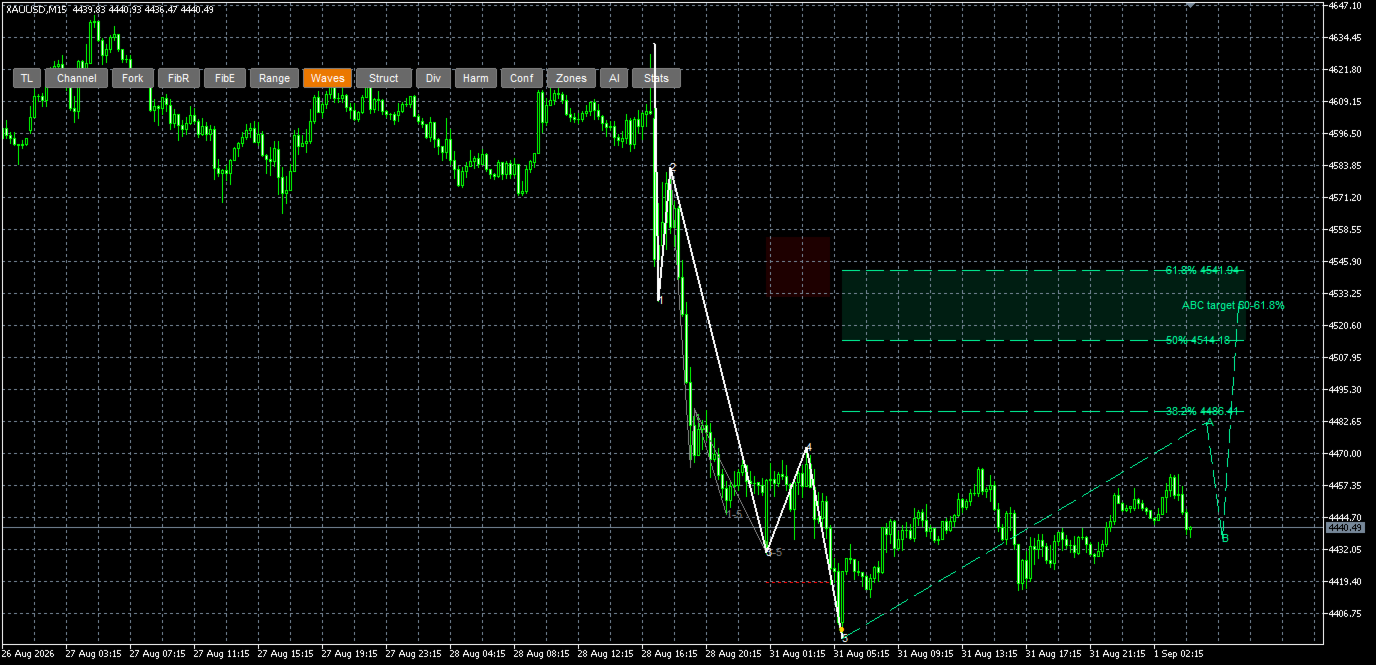
- Fibonacci retracement (38.2 / 50 / 61.8 / 78.6) and extension (0.618 to 2.618) of the current move
- Range box with support and resistance, market structure labels (HH, HL, LH, LL), price/volume divergences
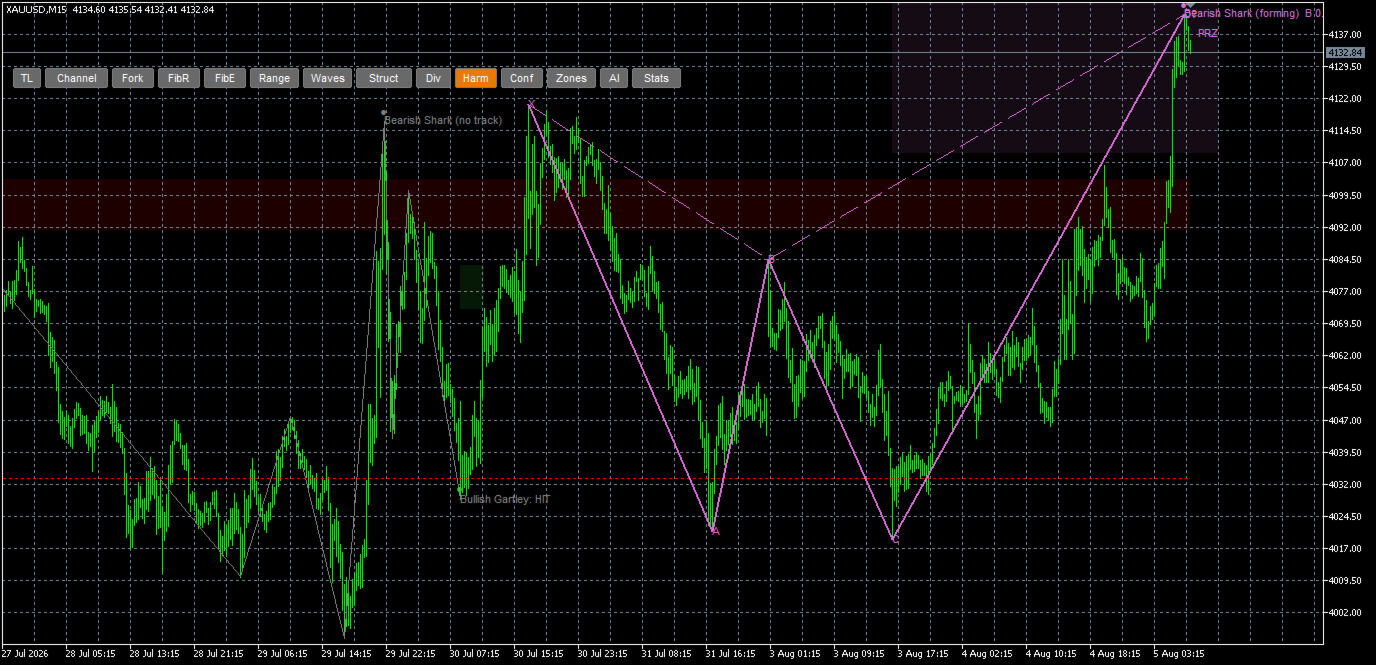
- Harmonic patterns: Gartley, Bat, Butterfly, Crab, Shark, 5-0, Three Drives, including the forming pattern's potential reversal zone (PRZ) and the A-D 50-61.8% reference band
- Elliott impulse 1-5 with the three cardinal rules, fifth-wave failure, corrective triangle, and the ABC projection band (50-61.8% of the 1-5 move) with fib lines
- Confluence map: shaded bands where two or more detected levels coincide, graded by how many
Why it saves time
Drawing fibs, harmonics and wave counts by hand on several symbols and timeframes is slow, and two traders (or the same trader on two days) will draw them differently. PatternSentry applies the same ratio tolerances and the same counting rules everywhere. Every tolerance is an input you can change, and the toolbar lets you keep only what you use.
Toolbar
TL · Channel · Fork · FibR · FibE · Range · Waves · Struct · Div · Harm · Conf · Zones · AI · Stats. Each button toggles its drawings. Alternative lookbacks draw dashed, dimmed variants of the same structure at another degree.
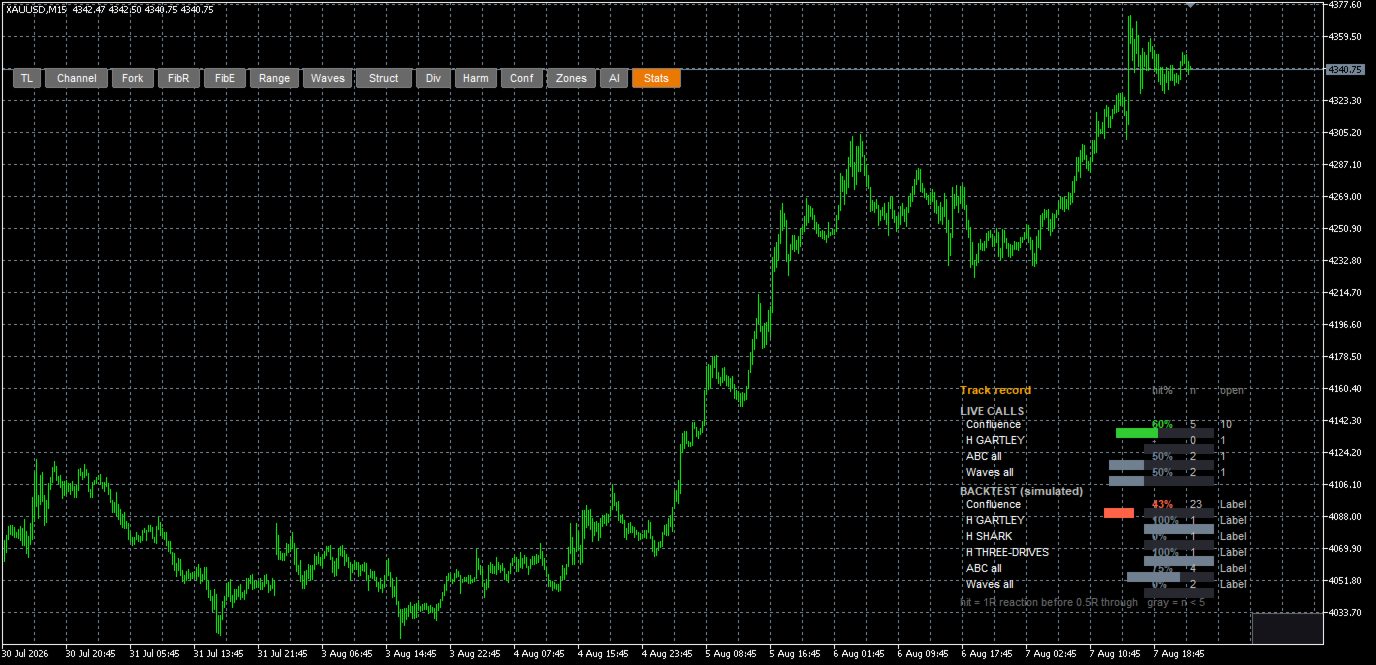
Statistics (research log)
For people who like to check things, the EA keeps a log of its own detections. Each detection (confluence band, divergence, harmonic band, wave-5 zone, ABC band) is recorded on a closed bar and then scored bar by bar with rules you can read in the panel:
- a zone is touched when a bar trades into it
- it reacted when price moves one zone-height (1R) beyond it, failed when price pushes half a zone-height through it, and expired after the age limit (expired entries are excluded from the share)
- for harmonic and ABC bands: reached when the band is hit, failed when the invalidation line is taken out first; both in the same bar count as failed
The panel shows resolved count, open count and the share that reacted per source, with entries replayed over history (without look-ahead) in a separate row from live entries. Nothing is edited after the fact. This is a research aid. It measures whether price reacted at a level, not what a trade would have made, and it says nothing about future results.
Optional Telegram integration
The EA works completely without any account or server: every detector, the statistics panel and the zone file run with the Telegram bot key input left empty (its default). If you also want a phone alert when a structure forms and an optional AI summary of the chart, paste the key from the author's Telegram bot (t.me/PatternSentryBot?start=mt5) into the Telegram bot key (optional) input of the Server link (optional) group and add https://gcznaaffmflukphvkusk.supabase.co/functions/v1 to Tools > Options > Expert Advisors > Allow WebRequest for listed URL. The integration is optional; the free tier of the bot is included. The AI summary gets the detected levels, open zones and recent bars; any zone it proposes that is not anchored to a detected level is rejected before you see it, and accepted zones are drawn on the chart.
Inputs
- Lookbacks (bars, semicolon-separated; first is primary, extra values draw variants), Backtest every N bars, Max zone age, Target R, Invalidation R
- Wave min height %, Max previous waves, Harmonic tolerance %, Harmonic stop beyond X %, Harmonic min band (ATR / ticks)
- HTF minutes (higher-timeframe levels for the confluence pool; 0 = auto)
- Max scan bars (default 5000), Auto refresh, Font size, colours per structure
- Server URL and Telegram bot key (optional, Telegram integration; last input group)
Setup
1. Attach to any chart and timeframe. Allow Algo Trading is not needed (no orders are sent).
2. Click the toolbar buttons you want. Stats opens the statistics panel.
3. Optional: Telegram integration as described above.
Notes
- Swing-based tools update as new pivots form; recorded zones are only ever resolved, never redrawn or deleted.
- Works on forex, metals, indices, crypto CFDs and exchange futures alike. The scoring uses the symbol's tick size.
- In the Strategy Tester the Telegram integration is unavailable (WebRequest is disabled there); everything else runs.
- Elliott counts and harmonic patterns are interpretations. A valid pattern by these rules is not the only valid reading of a chart.
PatternSentry is analysis software. It does not give investment advice, place trades or manage money. Trading involves substantial risk of loss. Statistics describe past price behavior and do not predict future results.