UT Bot Scanner Dashboard Filter All Pair Timeframe
- Göstergeler
- Sürüm: 1.0
- Etkinleştirmeler: 5

1. Overview
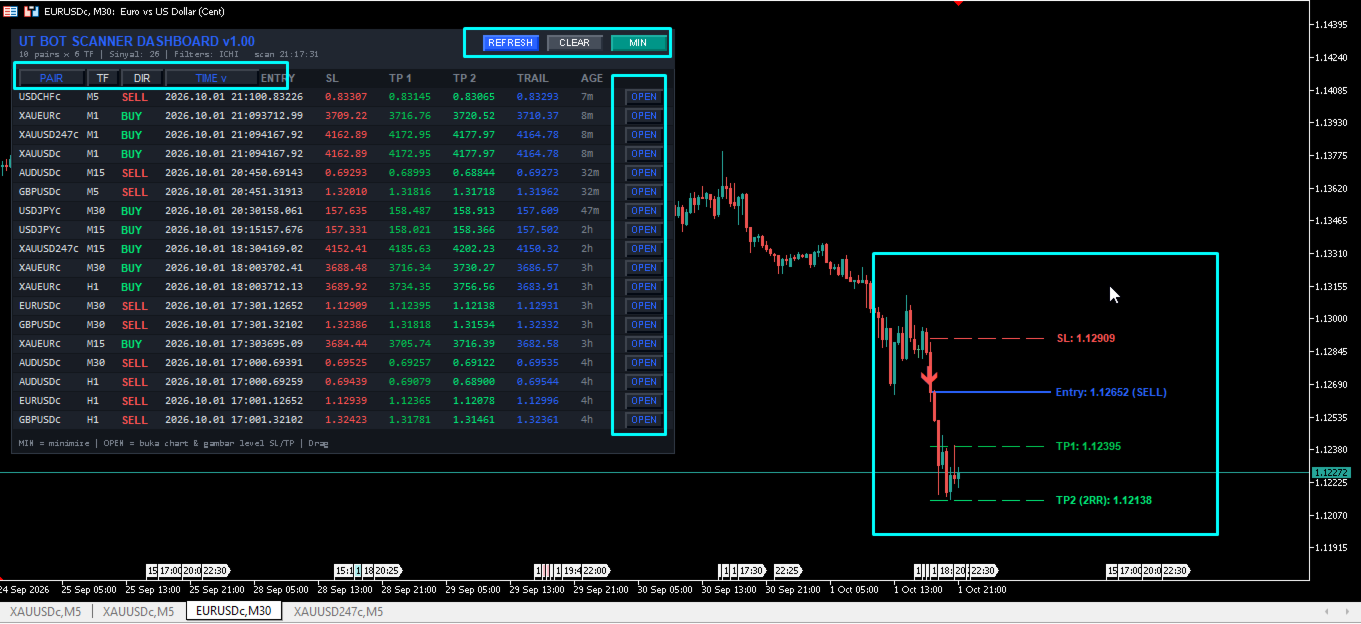
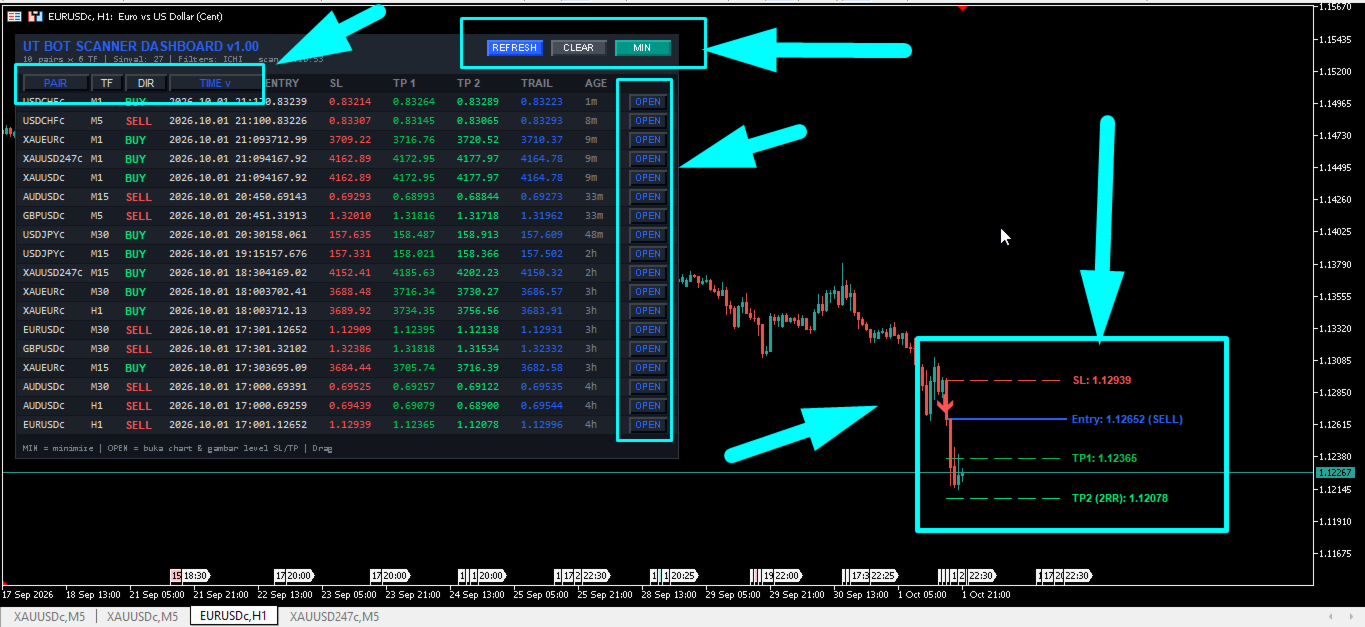
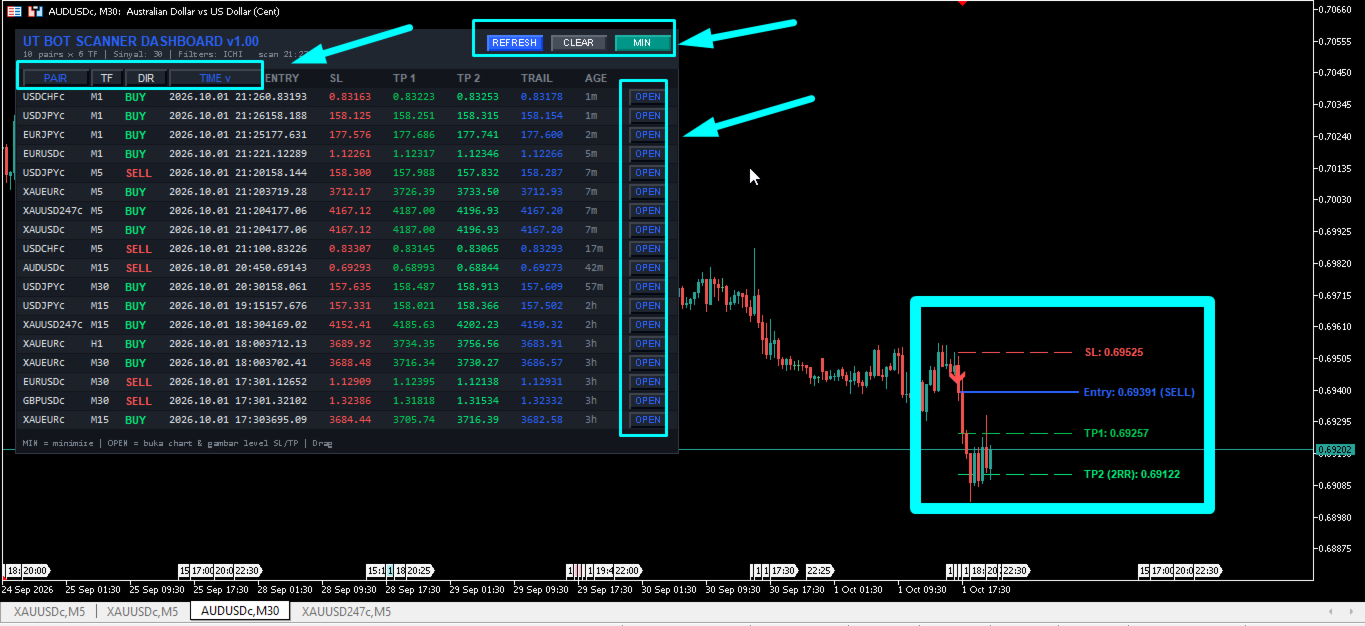
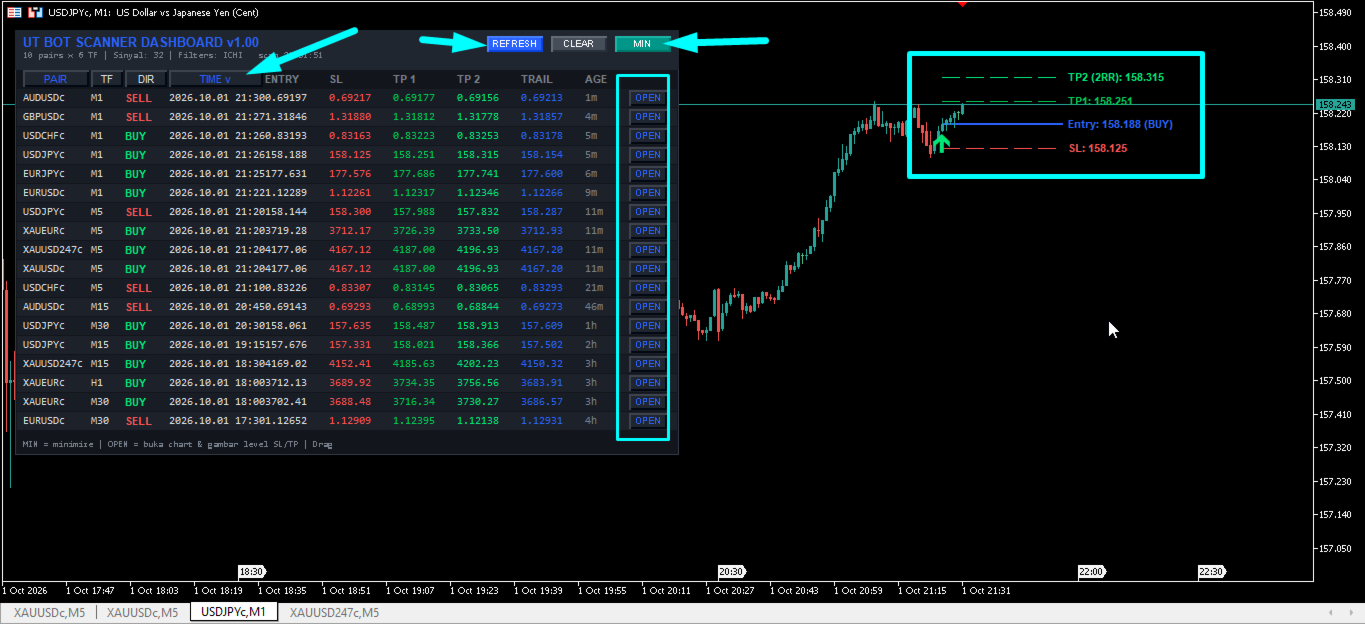
The UT Bot Scanner Dashboard is a multi-pair and multi-timeframe technical analysis scanner indicator developed for MetaTrader 5 (MT5). It is designed to assist traders in identifying price trend shifts and directional momentum setups across multiple financial instruments and timeframes simultaneously. The underlying engine utilizes the UT Bot trailing stop algorithm combined with a set of 17 optional confluence filters, dynamic Stop Loss (SL) distance calculations based on Average True Range (ATR), and Risk-to-Reward (RR) ratio Take Profit (TP) target projections. The software renders an interactive Graphical User Interface (GUI) panel on the active chart, displaying active signal parameters, bar age, entry price levels, SL/TP estimates, and interactive navigation controls to switch chart symbols effortlessly.
2. Technical Operating Principle and Signal Logic
2.1 Base Algorithmic Logic
The scanner evaluates market volatility using Average True Range (ATR) values to compute a dynamic trailing stop line. The sensitivity of the trailing stop is governed by a Key Value multiplier. For each bar, the algorithm calculates a position loss buffer defined as:
Loss Buffer = Key Value * ATR Value
The trailing stop line dynamically adjusts based on price direction:
- In an upward trend, the trailing stop is calculated as the maximum of the previous trailing level and the current bar close price minus the Loss Buffer.
- In a downward trend, the trailing stop is calculated as the minimum of the previous trailing level and the current bar close price plus the Loss Buffer.
2.2 Signal State Machine and Repaint Characteristics
Signal evaluation is conducted strictly on completed candles (Bar 1). The dynamic price activity on the active open candle (Bar 0) is excluded from signal state confirmation to eliminate false signals and structural changes after bar completion.
- Repaint Status: 100% Non-Repainting. Sinyal triggers are evaluated once a candle officially closes. Once confirmed at Bar 1 close, signal markers, table entries, and alert triggers remain permanently fixed on historical charts.
2.3 Entry Logic Requirements
A BUY signal condition is met on Bar 1 when:
1. The close price of the previous bar was below the trailing stop line, AND the close price of Bar 1 rises strictly above the trailing stop line (Bullish Breakout Crossover).
2. All active technical filter requirements enabled in the indicator parameters return a TRUE boolean condition for bullish alignment.
A SELL signal condition is met on Bar 1 when:
1. The close price of the previous bar was above the trailing stop line, AND the close price of Bar 1 falls strictly below the trailing stop line (Bearish Breakout Crossover).
2. All active technical filter requirements enabled in the indicator parameters return a TRUE boolean condition for bearish alignment.
2.4 Mechanics of Technical Confluence Filters
The scanner incorporates 17 distinct visual and quantitative filter modules that can be activated individually or in combination:
- Ichimoku Senkou Span B Filter: Validates macro trend direction. BUY requires close price above Senkou Span B; SELL requires close price below Senkou Span B.
- RSI Cross Filter: Identifies momentum turns from extreme zones. BUY requires RSI crossing above the oversold boundary (e.g., 30); SELL requires RSI crossing below the overbought boundary (e.g., 70).
- ADX Filter: Measures directional trend strength. Validates signals only when the ADX main line exceeds the configured minimum threshold level (e.g., 20.0).
- Single Moving Average (MA) Filter: Filters trades according to baseline trend direction. BUY requires close price above the MA; SELL requires close price below the MA.
- RSI 75 Filter: Evaluates long-term Relative Strength Index values. BUY requires RSI(75) above 50.0; SELL requires RSI(75) below 50.0.
- Double Moving Average Filter: Uses fast and slow MA alignment. BUY requires Fast MA above Slow MA; SELL requires Fast MA below Slow MA.
- Awesome Oscillator (AO) Filter: Assesses market momentum. Supports volume thresholds, histogram color changes, and zero-line cross validation.
- Parabolic SAR Filter: Confirms parabolic trend alignment. BUY requires close price above the SAR point; SELL requires close price below the SAR point.
- Heiken Ashi Filter: Confirms candle body momentum. BUY requires Heiken Ashi close to be greater than Heiken Ashi open; SELL requires Heiken Ashi close to be less than Heiken Ashi open.
- CCI Trend Filter: Evaluates Commodity Channel Index direction relative to the zero baseline. BUY requires CCI > 0; SELL requires CCI < 0.
- CCI Overbought/Oversold Filter: Identifies deep cyclical extremes. BUY requires CCI exceeding the overbought threshold; SELL requires CCI dropping below the oversold threshold.
- RVI Trend Filter: Evaluates Relative Vigor Index main line direction relative to zero baseline. BUY requires RVI > 0; SELL requires RVI < 0.
- RVI Signal Filter: Identifies signal line crossovers. BUY requires RVI main line above signal line; SELL requires RVI main line below signal line.
- MACD Signal Filter: Identifies histogram momentum. BUY requires MACD main line above signal line; SELL requires MACD main line below signal line.
- MACD Zero Filter: Evaluates MACD baseline orientation. BUY requires MACD main line above 0; SELL requires MACD main line below 0.
- Support & Resistance (S/R) Zone Filter: Scans recent high/low swing levels over a lookback period. BUY requires price to test support zone boundaries; SELL requires price to test resistance zone boundaries.
- Fibonacci Retracement Filter: Uses automated Swing High and Swing Low calculations via ZigZag mechanics. Validates signals when price interacts with configured Fibonacci golden ratio zones (e.g., 38.2% to 61.8%).
3. Key Features and Graphical Interface
- Multi-Pair Scanning Engine: Simultaneously processes up to 10 market instruments selected from Market Watch or customized input strings.
- Multi-Timeframe Matrix: Scans across up to 6 timeframes (M1, M5, M15, M30, H1, H4, D1, W1, MN1) in a single integrated view.
- Automated SL/TP Calculation: Generates ATR-based Stop Loss distances alongside Risk-to-Reward ratio targets (TP1 at 1:1 RR, TP2 at 1:2 RR).
- Interactive Dashboard Panel: Features real-time sorting by Signal Time, Pair Name, Timeframe, or Direction. Displays signal entry price, SL, TP1, TP2, trailing stop value, signal age, and chart navigation buttons.
- Quick Chart Switcher: Clicking the "OPEN" button next to any signal updates the main chart to that instrument and timeframe instantly, rendering technical levels on chart.
- On-Chart Level Visualizer: Draws colored trendlines and label annotations for Entry, Stop Loss, TP1, and TP2, alongside custom arrow signal markers.
- Comprehensive Notification System: Provides pop-up terminal alerts, custom audio alerts, push notifications to mobile devices, and SMTP email alerts.
4. Operation Recommendations and Technical Setup
- Asset Class Compatibility: Applicable to Forex pairs, Commodities (XAUUSD, WTI), Equity Indices, and Cryptocurrencies. Test spread tolerances before live deployment.
- Timeframe Recommendations: Compatible with all timeframe periods (M1 through MN1). Scalping setups perform efficiently on M5 and M15; Day Trading setups align with M30 and H1; Swing setups perform on H4 and D1.
- Terminal & Host Hardware Requirements: To optimize CPU usage during multi-pair scanning, utilize the built-in handle caching mechanism and set InpBarsCopy to 100 bars. A Virtual Private Server (VPS) with low latency is recommended for continuous background scanning and mobile push notification delivery.
- Broker Account Configuration: Compatible with ECN, STP, Low Spread, Hedging, and Netting trading account configurations on MT5 terminals.
5. Input Parameters Documentation
5.1 Scanner Settings
- InpSymbols (Default: "EURUSD,GBPUSD,USDJPY,AUDUSD,USDCAD,USDCHF,NZDUSD,EURJPY,GBPJPY,XAUUSD") -> Comma-separated list of instrument symbols to scan.
- InpTimeframes (Default: "M1,M5,M15,M30,H1,H4") -> Comma-separated list of timeframe periods to scan.
- InpUseWatch (Default: true) -> Enables scanning of all active pairs present in Market Watch window.
- InpMaxSymbols (Default: 10) -> Maximum number of market symbols to analyze simultaneously (Integer).
- InpScanSec (Default: 7) -> Background timer interval for full scanner execution pass (Seconds).
- InpBarsCopy (Default: 100) -> Number of historical bars retrieved per symbol/timeframe for indicator buffer calculations (Bars).
- InpLookback (Default: 100) -> Maximum historical bar depth evaluated when searching for active signals (Bars).
- InpDirection (Default: 0) -> Directional signal filter (0 = Scan Both BUY & SELL, 1 = Scan BUY Only, 2 = Scan SELL Only).
5.2 UT Bot Entry Settings
- InpKeyValue (Default: 1.0) -> Trailing stop sensitivity factor multiplying the ATR value (Double).
- InpATRPeriod (Default: 1) -> Averaging period used to compute ATR for UT Bot trailing stop calculation (Bars).
5.3 ATR SL & TP Settings
- InpSLTP_ATRPeriod (Default: 14) -> Averaging period of ATR used for dynamic Stop Loss distance calculation (Bars).
- InpATRMultSL (Default: 1.5) -> Stop Loss distance multiplier applied to calculated ATR value (Multiplier).
- InpTP1_RR (Default: 1.0) -> Risk-to-Reward multiplier for Take Profit Target 1 (e.g., 1.0 = 1:1 RR).
- InpTP2_RR (Default: 2.0) -> Risk-to-Reward multiplier for Take Profit Target 2 (e.g., 2.0 = 1:2 RR).
5.4 Filter Mode Settings
Ichimoku Senkou Span B Filter:
- UseSenkouFilter (Default: true) -> Enables or disables Ichimoku Senkou Span B trend filter (Boolean).
- IchimokuTenkan (Default: 9) -> Calculation period for Tenkan-sen conversion line (Bars).
- IchimokuKijun (Default: 26) -> Calculation period for Kijun-sen base line (Bars).
- IchimokuSenkou (Default: 52) -> Calculation period for Senkou Span B leading line (Bars).
- IchimokuDisplacement (Default: 26) -> Cloud forward displacement offset parameter (Bars).
RSI Cross Filter:
- Use_RSI_Cross_Filter (Default: false) -> Enables or disables RSI oversold/overbought boundary crossover filter (Boolean).
- RSI_Length (Default: 14) -> Calculation period for RSI indicator line (Bars).
- RSI_Price_Source (Default: PRICE_CLOSE) -> Applied price constant used for RSI calculation.
- Oversold (Default: 30.0) -> Lower threshold boundary level for RSI oversold crossover signal (Index value).
- Overbought (Default: 70.0) -> Upper threshold boundary level for RSI overbought crossover signal (Index value).
ADX Filter:
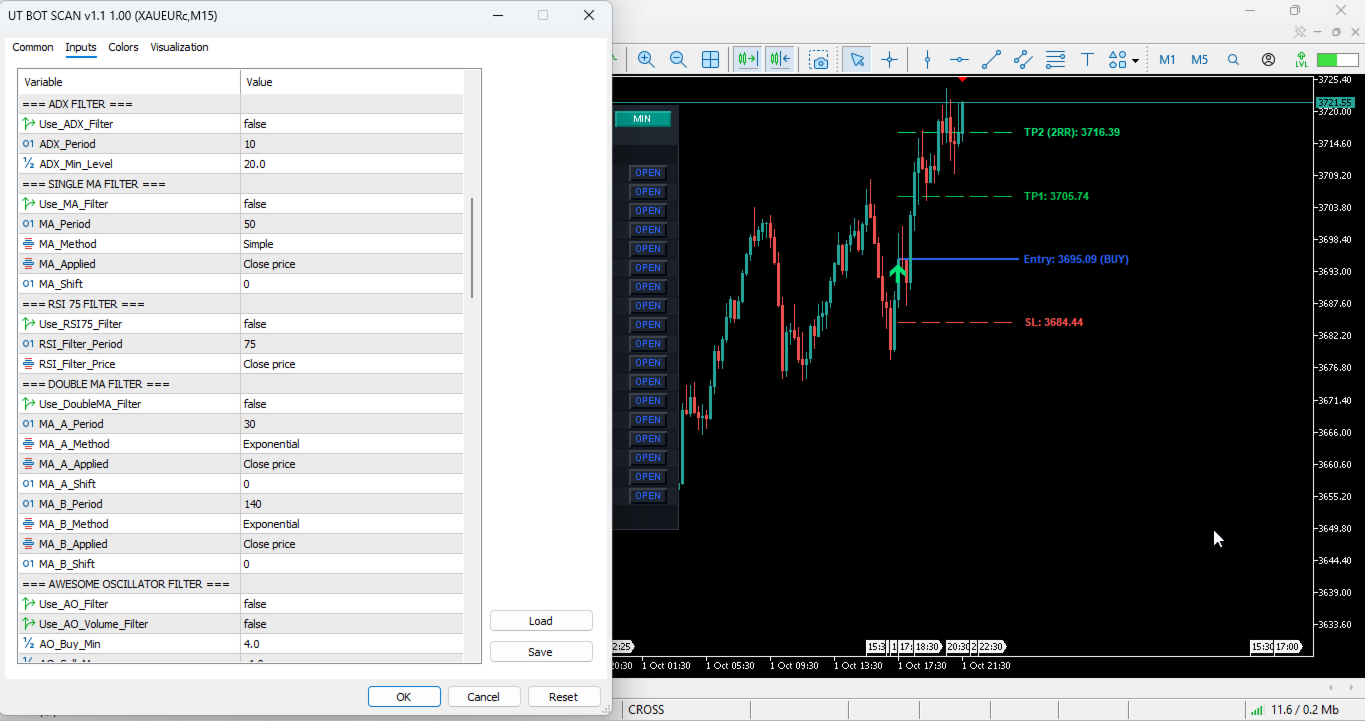
- Use_ADX_Filter (Default: false) -> Enables or disables Average Directional Index trend strength filter (Boolean).
- ADX_Period (Default: 10) -> Calculation period for ADX main line (Bars).
- ADX_Min_Level (Default: 20.0) -> Minimum required ADX threshold value to validate trend presence (Index value).
Single MA Filter:
- Use_MA_Filter (Default: false) -> Enables or disables Single Moving Average direction filter (Boolean).
- MA_Period (Default: 50) -> Averaging period for baseline Moving Average (Bars).
- MA_Method (Default: MODE_SMA) -> Smoothing method applied to Moving Average calculation.
- MA_Applied (Default: PRICE_CLOSE) -> Applied price data source used in Moving Average calculation.
- MA_Shift (Default: 0) -> Horizontal offset shift applied to Moving Average line (Bars).
RSI 75 Filter:
- Use_RSI75_Filter (Default: false) -> Enables or disables long-term RSI 75 baseline filter (Boolean).
- RSI_Filter_Period (Default: 75) -> Calculation period for long-term RSI indicator (Bars).
- RSI_Filter_Price (Default: PRICE_CLOSE) -> Applied price data source used in RSI 75 calculation.
Double MA Filter:
- Use_DoubleMA_Filter (Default: false) -> Enables or disables Fast/Slow Double Moving Average crossover alignment filter (Boolean).
- MA_A_Period (Default: 30) -> Averaging period for Fast Moving Average line A (Bars).
- MA_A_Method (Default: MODE_EMA) -> Smoothing method applied to Moving Average line A.
- MA_A_Applied (Default: PRICE_CLOSE) -> Applied price data source for Moving Average line A.
- MA_A_Shift (Default: 0) -> Horizontal offset shift for Moving Average line A (Bars).
- MA_B_Period (Default: 140) -> Averaging period for Slow Moving Average line B (Bars).
- MA_B_Method (Default: MODE_EMA) -> Smoothing method applied to Moving Average line B.
- MA_B_Applied (Default: PRICE_CLOSE) -> Applied price data source for Moving Average line B.
- MA_B_Shift (Default: 0) -> Horizontal offset shift for Moving Average line B (Bars).
Awesome Oscillator Filter:
- Use_AO_Filter (Default: false) -> Enables or disables Awesome Oscillator momentum filter (Boolean).
- Use_AO_Volume_Filter (Default: false) -> Enables minimum volume strength boundary check on AO values (Boolean).
- AO_Buy_Min (Default: 4.0) -> Minimum positive AO threshold value required for BUY signal validation (Points value).
- AO_Sell_Max (Default: -4.0) -> Maximum negative AO threshold value required for SELL signal validation (Points value).
- Use_AO_Color_Filter (Default: false) -> Enables validation based on AO histogram bar color direction (Boolean).
- Use_AO_Zero_Filter (Default: false) -> Enables validation based on AO placement relative to zero baseline (Boolean).
Parabolic SAR Filter:
- Use_SAR_Filter (Default: false) -> Enables or disables Parabolic SAR trend alignment filter (Boolean).
- SAR_Step (Default: 0.02) -> Price step increment factor for Parabolic SAR calculation (Factor).
- SAR_Maximum (Default: 0.2) -> Maximum acceleration factor cap for Parabolic SAR calculation (Factor).
Heiken Ashi Filter:
- Use_HeikenAshi_Filter (Default: false) -> Enables or disables Heiken Ashi candle body color trend filter (Boolean).
CCI Trend Filter:
- Use_CCI_Filter (Default: false) -> Enables or disables Commodity Channel Index baseline trend filter (Boolean).
- CCI_Period (Default: 50) -> Calculation period for CCI trend indicator line (Bars).
- CCI_Applied (Default: PRICE_CLOSE) -> Applied price data source used in CCI calculation.
CCI OB & OS Filter:
- Use_CCI_OBOS_Filter (Default: false) -> Enables or disables CCI overbought/oversold extreme level filter (Boolean).
- CCI_OBOS_Period (Default: 14) -> Calculation period for CCI OB/OS indicator (Bars).
- CCI_OBOS_Applied (Default: PRICE_CLOSE) -> Applied price data source used in CCI OB/OS calculation.
- CCI_Overbought (Default: 100.0) -> Upper boundary threshold required for BUY signal validation (Index value).
- CCI_Oversold (Default: -100.0) -> Lower boundary threshold required for SELL signal validation (Index value).
RVI Trend Filter:
- Use_RVI_Filter (Default: false) -> Enables or disables Relative Vigor Index baseline trend filter (Boolean).
- RVI_Period (Default: 75) -> Calculation period for RVI main line (Bars).
RVI Signal Filter:
- Use_RVI_Signal_Filter (Default: false) -> Enables or disables RVI main line and signal line crossover filter (Boolean).
- RVI_Signal_Period (Default: 20) -> Calculation period for RVI signal line (Bars).
MACD Signal Filter:
- Use_MACD_Filter (Default: false) -> Enables or disables MACD main line and signal line crossover filter (Boolean).
- MACD_FastEMA (Default: 12) -> Fast Exponential Moving Average period for MACD calculation (Bars).
- MACD_SlowEMA (Default: 26) -> Slow Exponential Moving Average period for MACD calculation (Bars).
- MACD_SignalSMA (Default: 9) -> Signal line Simple Moving Average period for MACD calculation (Bars).
- MACD_Applied (Default: PRICE_CLOSE) -> Applied price data source used in MACD calculation.
MACD Lev 0 Filter:
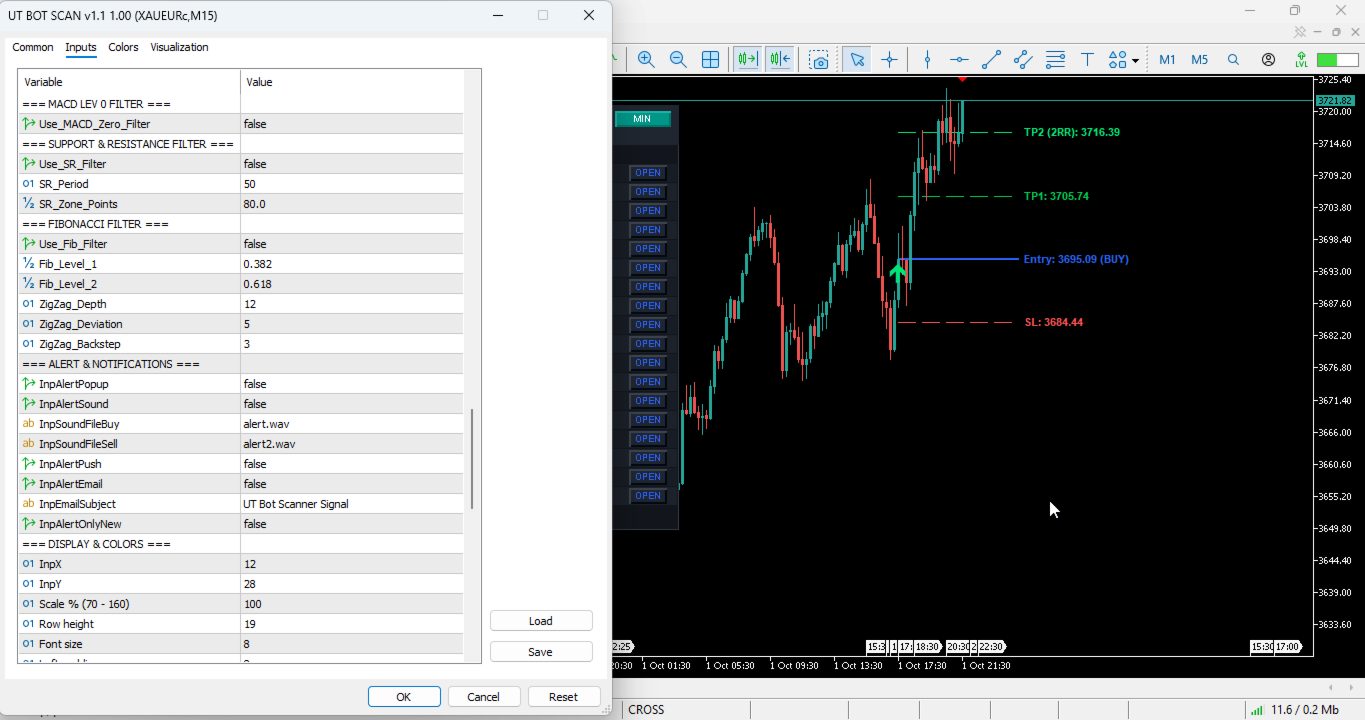
- Use_MACD_Zero_Filter (Default: false) -> Enables or disables MACD zero line orientation filter (Boolean).
Support & Resistance Filter:
- Use_SR_Filter (Default: false) -> Enables or disables price level interaction filter with recent S/R zones (Boolean).
- SR_Period (Default: 50) -> Historical lookback period analyzed to establish highest high and lowest low levels (Bars).
- SR_Zone_Points (Default: 80) -> Proximity tolerance zone around support/resistance levels (Points).
Fibonacci Filter:
- Use_Fib_Filter (Default: false) -> Enables or disables Fibonacci retracement zone interaction filter (Boolean).
- Fib_Level_1 (Default: 0.382) -> Primary Fibonacci retracement level ratio boundary (e.g., 0.382 = 38.2%).
- Fib_Level_2 (Default: 0.618) -> Secondary Fibonacci retracement level ratio boundary (e.g., 0.618 = 61.8%).
- ZigZag_Depth (Default: 12) -> Depth parameter controlling swing point detection for Fibonacci anchor placement (Bars).
- ZigZag_Deviation (Default: 5) -> Minimum price change threshold required to establish new swing leg (Points).
- ZigZag_Backstep (Default: 3) -> Minimum bar step back requirement between swing pivots (Bars).
5.5 Alert & Notifications Settings
- InpAlertPopup (Default: false) -> Enables pop-up dialog notifications inside terminal on signal detection (Boolean).
- InpAlertSound (Default: false) -> Enables audio alert playback upon new signal confirmation (Boolean).
- InpSoundFileBuy (Default: "alert.wav") -> Audio file name played when a BUY signal occurs (Filename string).
- InpSoundFileSell (Default: "alert2.wav") -> Audio file name played when a SELL signal occurs (Filename string).
- InpAlertPush (Default: false) -> Sends instant push notifications to registered MetaQuotes ID mobile app (Boolean).
- InpAlertEmail (Default: false) -> Transmits signal summary report emails via configured terminal SMTP server (Boolean).
- InpEmailSubject (Default: "UT Bot Scanner Signal") -> Text subject line attached to outbound email reports (String).
- InpAlertOnlyNew (Default: false) -> Restricts alerts to trigger strictly once per newly confirmed bar signal (Boolean).
5.6 UI & Display Settings
- InpX (Default: 12) -> X-axis coordinate offset positioning the dashboard panel from top-left corner (Pixels).
- InpY (Default: 28) -> Y-axis coordinate offset positioning the dashboard panel from top-left corner (Pixels).
- InpScale (Default: 100) -> Global scaling ratio controlling dashboard UI element sizes (Range: 70% to 180%).
- InpRowH (Default: 19) -> Height of individual data table rows within dashboard panel (Pixels).
- InpFont (Default: 8) -> Base font size used for text labels inside table cells (Points).
- InpPadX (Default: 8) -> Horizontal internal padding inside dashboard frame (Pixels).
- InpWPair (Default: 68) -> Column width reserved for symbol pair names (Pixels).
- InpWTF (Default: 34) -> Column width reserved for timeframe labels (Pixels).
- InpWArah (Default: 44) -> Column width reserved for direction indicators (Pixels).
- InpWTime (Default: 96) -> Column width reserved for signal timestamp display (Pixels).
- InpWEntry (Default: 64) -> Column width reserved for entry price values (Pixels).
- InpWSL (Default: 64) -> Column width reserved for Stop Loss values (Pixels).
- InpWTP1 (Default: 64) -> Column width reserved for Take Profit Target 1 values (Pixels).
- InpWTP2 (Default: 64) -> Column width reserved for Take Profit Target 2 values (Pixels).
- InpWTrail (Default: 64) -> Column width reserved for trailing stop values (Pixels).
- InpWUmur (Default: 42) -> Column width reserved for signal age metrics (Pixels).
- InpWOpen (Default: 44) -> Column width reserved for interactive chart opening buttons (Pixels).
- InpShowEmpty (Default: false) -> Toggles display of symbol/timeframe rows containing no active signal (Boolean).
- InpMaxRows (Default: 18) -> Maximum number of visible data rows displayed simultaneously on dashboard (Integer).
- InpSortBy (Default: SORT_TIME) -> Initial table sorting criteria (0 = Time, 1 = Pair, 2 = Timeframe, 3 = Direction).
- InpSortNewest (Default: true) -> Enables descending sorting order (newest signals or highest priority listed first).
5.7 On-Chart Visuals & Color Settings
- InpDrawOnChart (Default: true) -> Enables drawing of visual entry, SL, and TP lines on active chart window (Boolean).
- InpShowArrow (Default: true) -> Enables rendering of BUY/SELL arrow markers on active chart window (Boolean).
- InpShowLevels (Default: true) -> Enables drawing of price level trendlines and label annotations (Boolean).
- InpExtendBars (Default: 30) -> Horizontal ray extension length for on-chart level lines beyond signal candle (Bars).
- InpArrowCodeBuy (Default: 233) -> Wingdings character code used for rendering BUY signal arrows (Character code).
- InpArrowCodeSell (Default: 234) -> Wingdings character code used for rendering SELL signal arrows (Character code).
- InpArrowSize (Default: 2) -> Visual thickness size setting applied to drawn arrow markers (Integer scale).
- InpArrowDistance (Default: 15) -> Vertical offset spacing between candle high/low and drawn arrow marker (Points).
- InpColBg (Default: C'18,22,28') -> Background color of main dashboard panel frame.
- InpColHead (Default: C'32,38,48') -> Background color of dashboard header bar and interactive buttons.
- InpColRow (Default: C'24,28,36') -> Primary background color for even table rows.
- InpColRow2 (Default: C'28,33,42') -> Secondary background color for odd table rows.
- InpColText (Default: C'220,225,230') -> Default text font color used for regular table information.
- InpColBull (Default: C'0,230,118') -> Primary accent color representing bullish BUY signals and positive status.
- InpColBear (Default: C'255,82,82') -> Primary accent color representing bearish SELL signals and warning status.
- InpColMute (Default: C'120,128,140') -> Subtle text color applied to inactive labels, headers, and secondary metrics.
- InpColAccent (Default: C'41,98,255') -> Primary interface highlight color used for active titles and control elements.
- InpColEntry (Default: C'41,98,255') -> Color applied to on-chart entry price trendlines and text labels.
- InpColSL (Default: C'255,82,82') -> Color applied to on-chart Stop Loss price trendlines and text labels.
- InpColTP1 (Default: C'0,200,83') -> Color applied to on-chart Take Profit Target 1 trendlines and text labels.
- InpColTP2 (Default: C'0,230,118') -> Color applied to on-chart Take Profit Target 2 trendlines and text labels.
6. Risk Disclaimer
Trading foreign exchange, commodities, indices, and derivative financial instruments carries a high level of risk and may not be suitable for all investors. Potential investors must carefully evaluate their financial status, investment experience, and risk tolerance prior to engaging in live market trading. Historical performance, automated signal metrics, backtest calculations, and visual analytical setups generated by technical indicators do not guarantee future financial results. This software product operates exclusively as a technical analysis dashboard and visual execution utility designed to assist traders in market monitoring; it does not constitute financial, legal, or investment advice. Users are strongly advised to test the indicator functionality thoroughly on demo simulated trading accounts before deploying the software on real capital accounts.