Stochastic Scanner Dashboard All Pair Timeframe

OVERVIEW
Stochastic Scanner Dashboard is a professional analytical utility and multi-symbol, multi-timeframe signal indicator designed for MetaTrader. The primary objective of this tool is to simultaneously monitor multiple financial instruments and timeframes to identify potential market entries based on the Stochastic Oscillator. It eliminates the need to open multiple charts by consolidating all active signals, price levels, and dynamic Risk/Reward calculations into a single interactive graphical user interface (GUI). Additionally, the system is integrated with the MultiFilterSuite, a highly customizable 14-tier validation engine that allows users to filter Stochastic signals against moving averages, momentum oscillators, price action patterns, and volatility metrics to ensure strict entry conditions.

OPERATING PRINCIPLE & SIGNAL LOGIC
The core algorithm relies on the traditional Stochastic Oscillator formula, measuring the closing price relative to the high-low range over a specified period. To ensure technical stability and prevent chart anomalies, the indicator operates strictly on closed bars.
Signal Validity & Repaint Behavior: The system analyzes historical price arrays specifically at index 1 (the last completed bar) and index 2 (the preceding closed bar). Because it does not evaluate the open, running candle (Bar 0) for signal confirmation, all generated signals are completely non-repainting. Once a signal is locked and displayed on the dashboard, it will not shift, disappear, or recalculate.
Entry Logic Scenarios (Configurable):
1. Signal Cross (ENTRY_CROSS_SIGNAL): A BUY signal triggers when the Stochastic Main line crosses above the Signal line from below. A SELL signal triggers when the Main line crosses below the Signal line from above.
2. Level Cross (ENTRY_LEVEL_OBOS): A BUY signal occurs when the Main line breaks out of the Oversold zone (crossing the Oversold level upwards). A SELL signal occurs when the Main line breaks down from the Overbought zone (crossing the Overbought level downwards).
3. Cross In Zone (ENTRY_CROSS_IN_ZONE): A BUY signal triggers when the Main line crosses the Signal line upwards, and both lines are currently positioned below the Oversold threshold. A SELL signal triggers when the downward crossover occurs while both lines are above the Overbought threshold.
Stop Loss and Take Profit Calculation: Risk management is dynamically calculated using the Average True Range (ATR). Stop Loss is placed at the entry price minus/plus the ATR value multiplied by a user-defined ratio. Take Profit 1 is plotted at a standard 1:1 Risk-to-Reward (RR) ratio, and Take Profit 2 is plotted at a 2:1 RR ratio by default. If the ATR buffer is temporarily unavailable, the system safely falls back to the high-low range of the signal candle.

MULTIFILTERSUITE LOGIC (SECONDARY VALIDATION)
If enabled, the initial Stochastic signal must sequentially pass the active filters in the MultiFilterSuite module before triggering an alert.
1. RSI Cross: Validates if the Relative Strength Index has recently crossed the oversold/overbought boundaries on the signal bar.
2. ADX Trend: Confirms that the Average Directional Index value is above a strict minimum threshold, indicating strong trend momentum.
3. Single MA: A directional filter requiring the closing price to be strictly above (for BUY) or below (for SELL) a specified Moving Average.
4. Ichimoku Senkou Span B: Uses the Ichimoku Cloud's leading span as a dynamic support/resistance filter. Price must be on the correct side of the span.
5. RSI 75: A midpoint momentum filter confirming that the RSI value is above 50 for bullish signals and below 50 for bearish signals.
6. Double MA: Validates trend by checking the crossover status of a Fast Moving Average against a Slow Moving Average.
7. Awesome Oscillator (AO): Validates momentum through three optional modes: minimum volume bar size, histogram color (momentum acceleration), and zero-line positioning.
8. Parabolic SAR: Ensures the current price is trending favorably compared to the Parabolic Stop and Reverse plotted dots.
9. Heiken Ashi: Computes synthetic Heiken Ashi open and close prices, requiring the HA candle body to match the intended signal direction.
10. CCI Trend: Confirms the Commodity Channel Index is positioned above the zero line (BUY) or below the zero line (SELL).
11. CCI OB/OS: Filters signals by requiring the CCI to exceed the extreme overbought (+100) or oversold (-100) levels.
12. RVI Trend & Signal: Uses the Relative Vigor Index to confirm market energy, either by checking the zero-line or the RVI main-to-signal line crossover.
13. MACD: Evaluates the Moving Average Convergence Divergence histogram volume or the main MACD line position relative to the zero baseline.
14. Support/Resistance & Fibonacci: Identifies recent swing highs and lows using a ZigZag algorithm. Calculates specific Fibonacci retracement zones and standard price boundaries, validating the entry only if the price action respects these structural levels.

KEY FEATURES
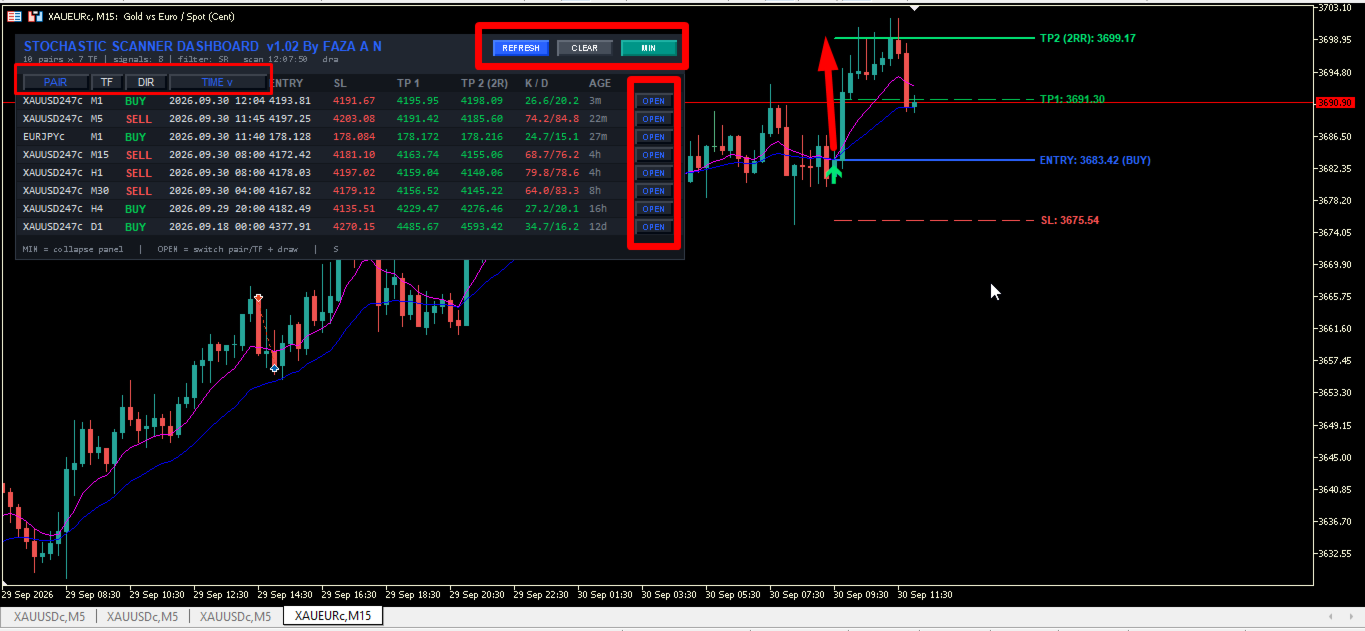
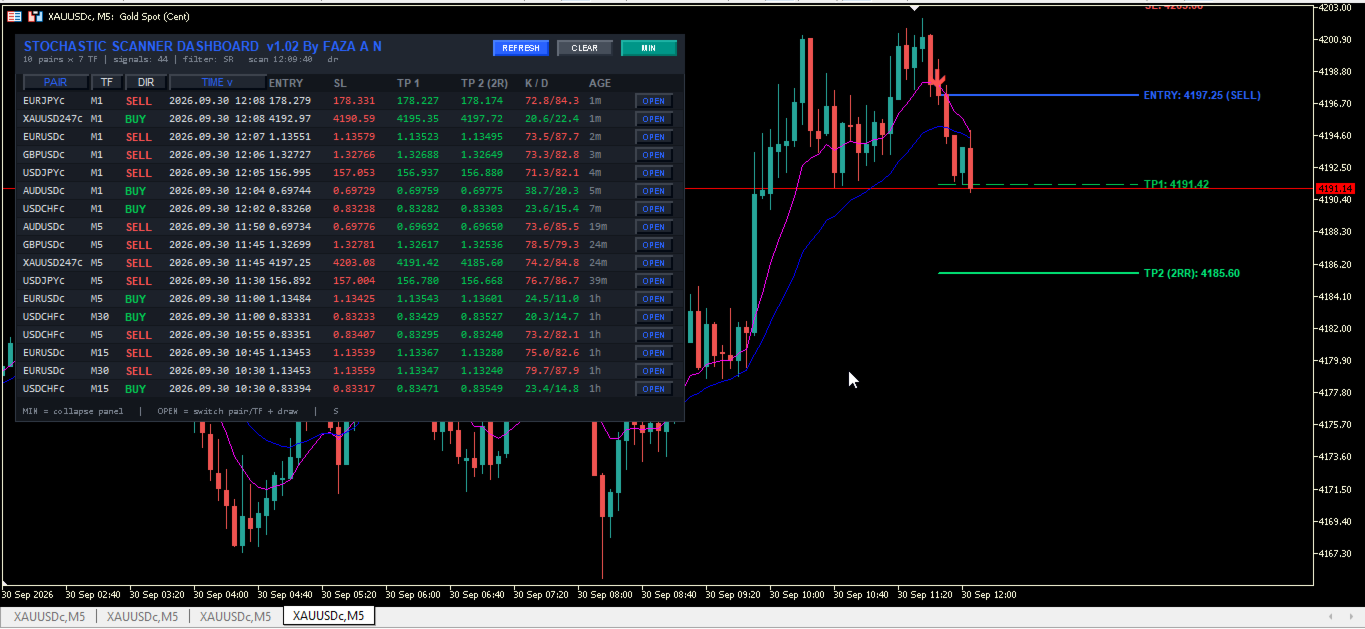
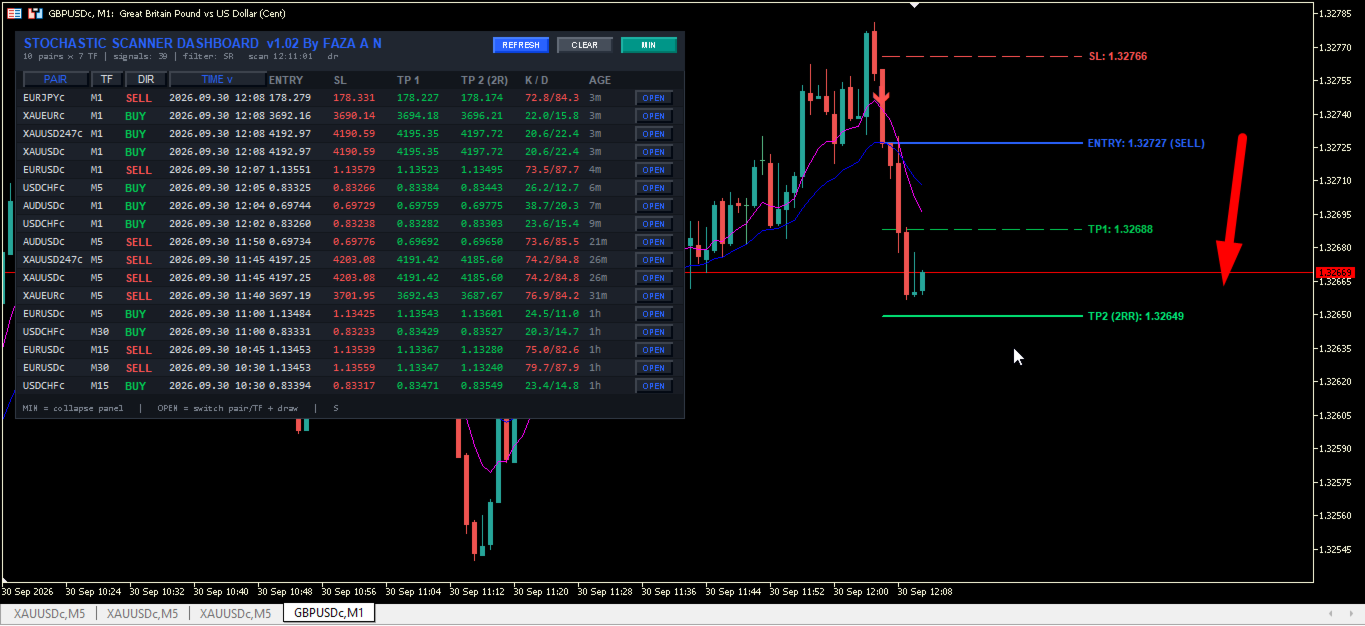
- Interactive GUI Dashboard: A movable, scalable panel displaying real-time data columns: Pair, Timeframe, Direction, Signal Time, Entry Price, SL, TP1, TP2, K/D Values, and Signal Age.
- Chart Redirection: Clicking the 'OPEN' button on any dashboard row instantly switches the current chart to the selected symbol and timeframe, drawing the specific setup lines (Entry, SL, TP).
- GUI Color Indicators: Bullish signals are highlighted in green, bearish signals in red, and inactive elements in neutral gray, allowing immediate visual recognition.
- Advanced Sorting Engine: Users can click table headers to sort active signals dynamically by Pair Name, Timeframe, Trade Direction, or chronological Signal Time.
- System Efficiency: Includes maximum bar limits and scan intervals to regulate CPU and memory consumption.
- Comprehensive Notification System: Supports terminal pop-up alerts, localized sound execution, push notifications to mobile devices, and SMTP email forwarding.

OPERATION / SETUP RECOMMENDATIONS
- Supported Instruments: Applicable to all major, minor, and exotic currency pairs, as well as highly liquid commodities and indices.
- Supported Timeframes: Functions across all standard timeframes. Recommended for M15, M30, H1, H4, and D1 for optimal structural stability.
- Broker Environment: A low spread, low latency ECN broker account is recommended, especially if scanning lower timeframes (M1, M5) where spread impacts the ATR-based Stop Loss.
- Terminal Optimization: If running on a low-specification Virtual Private Server (VPS), limit the 'InpMaxSymbols' and 'InpTimeframes' parameters to prevent terminal memory overload during the periodic dashboard refresh cycles.

INPUT PARAMETERS LIST
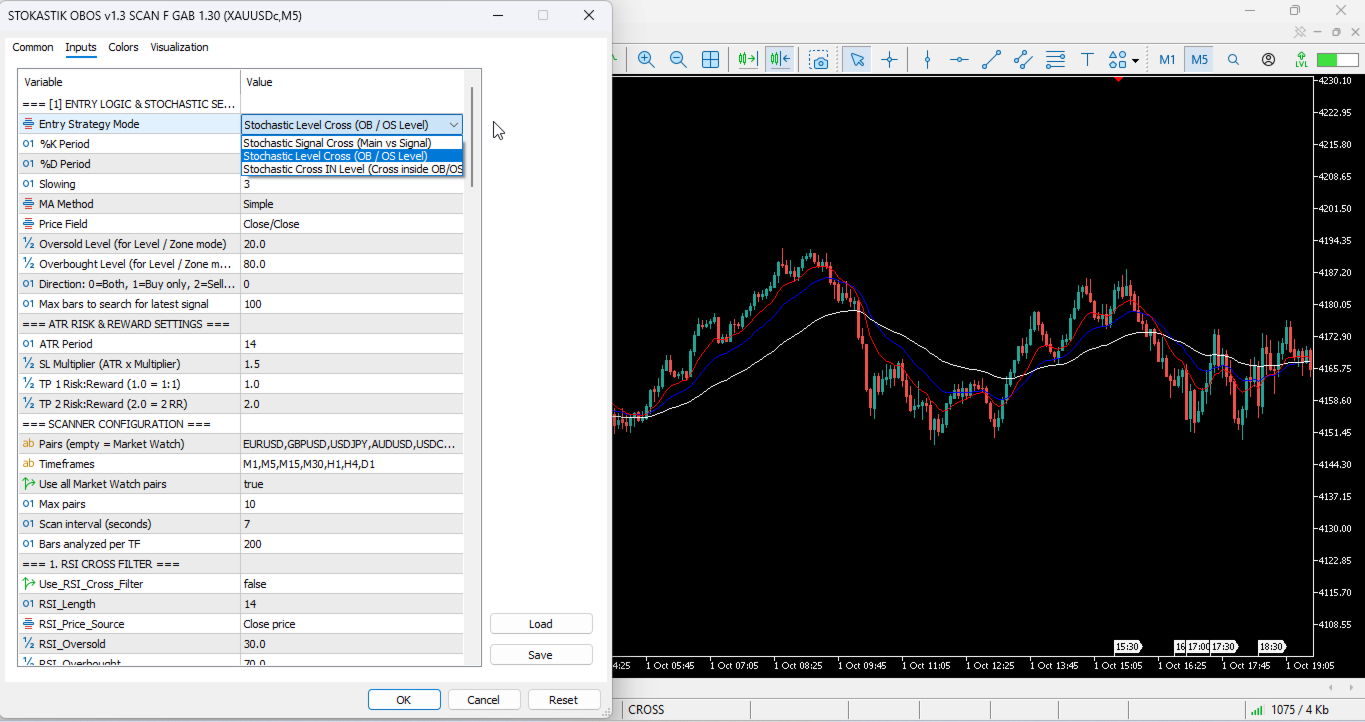
=== [1] ENTRY LOGIC & STOCHASTIC SETTINGS ===
InpEntryMode (Default: 1) -> Sets the mathematical condition for the signal (Signal Cross, Level Cross, or Cross in Zone).
InpKPeriod (Default: 10) -> The lookback period for calculating the Stochastic %K line.
InpDPeriod (Default: 3) -> The period used for calculating the Stochastic %D signal line.
InpSlowing (Default: 3) -> The smoothing parameter applied to the stochastic oscillator.
InpMethod (Default: MODE_SMA) -> The moving average method used for internal smoothing.
InpPrice (Default: STO_CLOSECLOSE) -> The specific candlestick price fields applied in the calculation.
LevelOversold (Default: 20.0) -> The lower boundary threshold used for identifying oversold conditions.
LevelOverbought (Default: 80.0) -> The upper boundary threshold used for identifying overbought conditions.
InpDirection (Default: 0) -> Restricts scanning direction (0=Both directions, 1=Buy signals only, 2=Sell signals only).
InpLookback (Default: 100) -> The maximum number of historical bars scanned to find the most recent valid signal.
=== ATR RISK & REWARD SETTINGS ===
InpATRPeriod (Default: 14) -> The lookback period for the Average True Range volatility calculation.
InpATRMulSL (Default: 1.5) -> The multiplier applied to the ATR value to calculate the exact Stop Loss distance.
InpTP1_RR (Default: 1.0) -> The Risk-to-Reward ratio for the first Take Profit target (1.0 equals 1:1).
InpTP2_RR (Default: 2.0) -> The Risk-to-Reward ratio for the secondary Take Profit target (2.0 equals 1:2).
=== SCANNER CONFIGURATION ===
InpSymbols (Default: EURUSD,GBPUSD...) -> A comma-separated list of symbols to be monitored by the scanner engine.
InpTimeframes (Default: M1,M5,M15...) -> A comma-separated list of standard timeframes to be scanned.
InpUseWatch (Default: true) -> If true, the system ignores the InpSymbols list and automatically scans all symbols visible in the Market Watch window.
InpMaxSymbols (Default: 10) -> The absolute maximum number of pairs the scanner is allowed to load into memory.
InpScanSec (Default: 7) -> The interval in seconds defining how frequently the dashboard recalculates signals.
InpBarsCopy (Default: 200) -> The total number of historical price bars downloaded and buffered per timeframe.
=== ALERT SETTINGS ===
InpAlertPopup (Default: false) -> Enables native MT4/MT5 terminal pop-up window notifications.
InpAlertSound (Default: false) -> Enables audio alerts using local WAV files.
InpSoundFile (Default: alert.wav) -> Defines the specific filename of the audio alert to be played.
InpAlertPush (Default: false) -> Enables sending push notifications directly to the MetaQuotes mobile application.
InpAlertEmail (Default: false) -> Enables signal forwarding via SMTP email.
InpEmailSubject (Default: Stochastic Scanner Signal) -> Defines the custom subject line header for email alerts.
InpAlertOnlyNew (Default: false) -> Restricts alerts to only trigger once per new unique signal timestamp.
=== DISPLAY & LAYOUT SETTINGS ===
InpX (Default: 12) -> The horizontal X-axis pixel coordinate for placing the dashboard panel.
InpY (Default: 28) -> The vertical Y-axis pixel coordinate for placing the dashboard panel.
InpScale (Default: 100) -> The global interface scaling percentage modifier (ranging from 80 to 160).
InpRowH (Default: 18) -> The vertical height allocated to each individual signal row in pixels.
InpFont (Default: 8) -> The core font size used for all textual data inside the panel.
InpPadX (Default: 8) -> The internal left padding applied to text elements within their columns.
InpWPair (Default: 68) -> The pixel width allocated to the Pair Name column.
InpWTF (Default: 34) -> The pixel width allocated to the Timeframe column.
InpWArah (Default: 44) -> The pixel width allocated to the Direction (BUY/SELL) column.
InpWTime (Default: 100) -> The pixel width allocated to the Timestamp column.
InpWEntry (Default: 64) -> The pixel width allocated to the Entry Price column.
InpWSL (Default: 64) -> The pixel width allocated to the Stop Loss level column.
InpWTP1 (Default: 64) -> The pixel width allocated to the Take Profit 1 level column.
InpWTP2 (Default: 64) -> The pixel width allocated to the Take Profit 2 level column.
InpWStoch (Default: 64) -> The pixel width allocated to the K/D values column.
InpWUmur (Default: 44) -> The pixel width allocated to the Signal Age column.
InpWOpen (Default: 44) -> The pixel width allocated to the Chart Open action button column.
InpShowEmpty (Default: false) -> Forces the dashboard to display rows even if no valid signal is currently detected.
InpMaxRows (Default: 17) -> Limits the maximum number of signal rows rendered visually on the screen.
=== SORTING CONFIGURATION ===
InpSortBy (Default: SORT_TIME) -> Selects the default sorting behavior on initialization (Time, Pair, Timeframe, or Direction).
InpSortNewest (Default: true) -> If true, chronological sorting will place the most recent signals at the top of the list.
=== ON-CHART VISUAL SETTINGS ===
InpDrawOnChart (Default: true) -> Allows the indicator to render graphical setup lines directly onto the main price chart.
InpShowArrow (Default: true) -> Renders directional entry arrows at the specific signal trigger bar.
InpShowLevels (Default: true) -> Draws horizontal threshold lines representing Entry, SL, TP1, and TP2.
InpExtendBars (Default: 25) -> Determines how many future bars the horizontal setup lines will project forward.
InpArrowCodeBuy (Default: 233) -> The Wingdings font code used to render the BUY directional arrow.
InpArrowCodeSell (Default: 234) -> The Wingdings font code used to render the SELL directional arrow.
InpArrowSize (Default: 2) -> The visual thickness and size scaling of the rendered arrows.
InpArrowDistance (Default: 15) -> The pixel offset distance separating the arrow from the candlestick high/low.
=== COLOR PALETTE ===
InpColBg -> The background color applied to the main dashboard panel container.
InpColHead -> The color applied to the dashboard title bar and column headers.
InpColRow -> The primary background color used for alternating data rows.
InpColRow2 -> The secondary background color used for alternating data rows to improve readability.
InpColText -> The standard font color applied to neutral textual data.
InpColBull -> The specific font color applied to indicate bullish conditions and BUY text.
InpColBear -> The specific font color applied to indicate bearish conditions and SELL text.
InpColMute -> A desaturated font color used for secondary information such as age and status text.
InpColAccent -> The highlight color used for active sorting headers and chart interaction buttons.
InpColArrowBuy -> The graphical color assigned to the on-chart BUY execution arrows.
InpColArrowSell -> The graphical color assigned to the on-chart SELL execution arrows.
InpColEntry -> The line color assigned to the on-chart Entry level projection.
InpColSL -> The line color assigned to the on-chart Stop Loss projection.
InpColTP1 -> The line color assigned to the on-chart Take Profit 1 projection.
InpColTP2 -> The line color assigned to the on-chart Take Profit 2 projection.
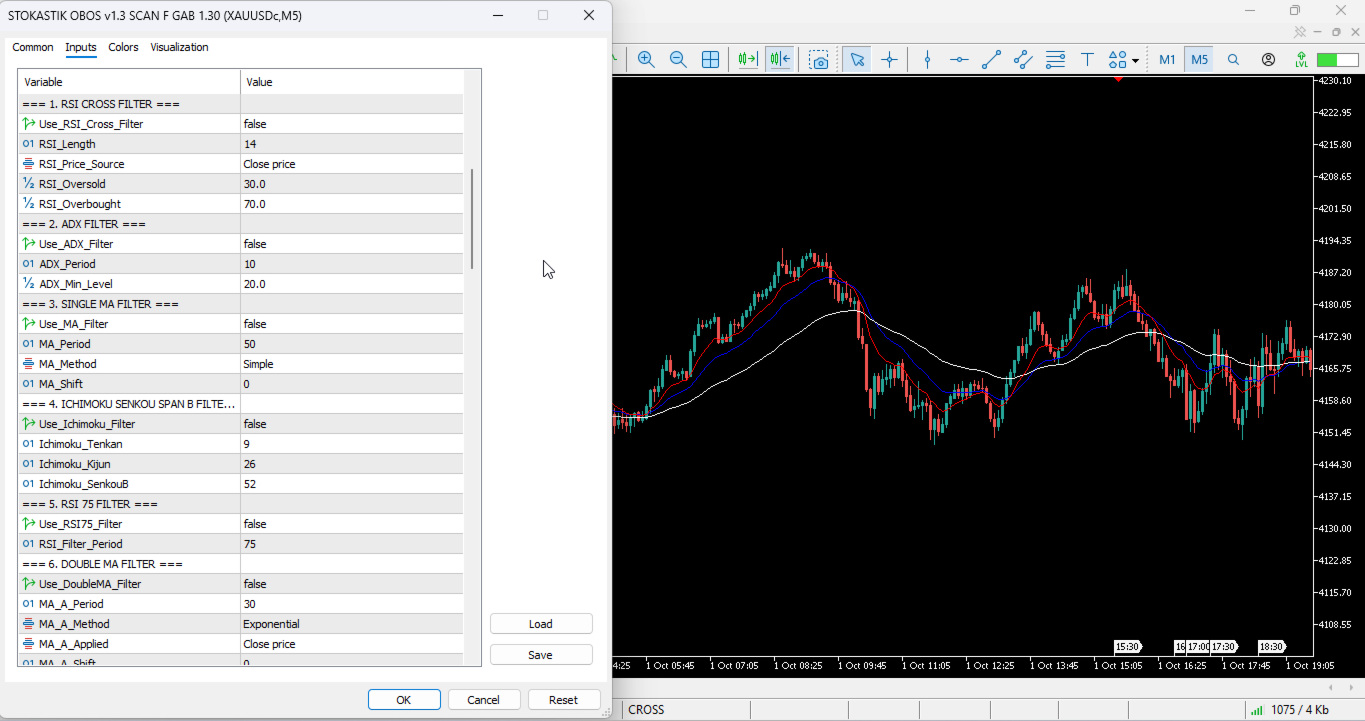
=== 1. RSI CROSS FILTER ===
Use_RSI_Cross_Filter (Default: false) -> Activates the RSI zone crossover validation logic.
RSI_Length (Default: 14) -> Defines the data period for the RSI calculation.
RSI_Price_Source (Default: PRICE_CLOSE) -> Sets the candlestick data point for RSI calculation.
RSI_Oversold (Default: 30.0) -> The lower boundary level defining the RSI oversold zone.
RSI_Overbought (Default: 70.0) -> The upper boundary level defining the RSI overbought zone.
=== 2. ADX FILTER ===
Use_ADX_Filter (Default: false) -> Activates the Average Directional Index momentum filter.
ADX_Period (Default: 10) -> Defines the data period for the ADX calculation.
ADX_Min_Level (Default: 20.0) -> The minimum absolute ADX value required to validate an active trend presence.
=== 3. SINGLE MA FILTER ===
Use_MA_Filter (Default: false) -> Activates the baseline Moving Average directional filter.
MA_Period (Default: 50) -> The calculation period for the Moving Average line.
MA_Method (Default: MODE_SMA) -> The smoothing algorithm applied (Simple, Exponential, Smoothed, Linear Weighted).
MA_Shift (Default: 0) -> The forward or backward bar offset shift applied to the MA line.
=== 4. ICHIMOKU SENKOU SPAN B FILTER ===
Use_Ichimoku_Filter (Default: false) -> Activates the Ichimoku cloud support/resistance filtering system.
Ichimoku_Tenkan (Default: 9) -> The lookback period for the Tenkan-sen calculation.
Ichimoku_Kijun (Default: 26) -> The lookback period for the Kijun-sen calculation.
Ichimoku_SenkouB (Default: 52) -> The core lookback period used to project the Senkou Span B baseline.
=== 5. RSI 75 FILTER ===
Use_RSI75_Filter (Default: false) -> Activates the long-term RSI 50-midline directional filter.
RSI_Filter_Period (Default: 75) -> The extended calculation period used for the RSI midline check.
=== 6. DOUBLE MA FILTER ===
Use_DoubleMA_Filter (Default: false) -> Activates a dual Moving Average crossover check for trend validation.
MA_A_Period (Default: 30) -> The data period for the Fast Moving Average calculation.
MA_A_Method (Default: MODE_EMA) -> The smoothing algorithm used for the Fast Moving Average.
MA_A_Applied (Default: PRICE_CLOSE) -> The price data point applied to the Fast Moving Average.
MA_A_Shift (Default: 0) -> The bar offset shift applied to the Fast Moving Average.
MA_B_Period (Default: 140) -> The data period for the Slow Moving Average calculation.
MA_B_Method (Default: MODE_EMA) -> The smoothing algorithm used for the Slow Moving Average.
MA_B_Applied (Default: PRICE_CLOSE) -> The price data point applied to the Slow Moving Average.
MA_B_Shift (Default: 0) -> The bar offset shift applied to the Slow Moving Average.
=== 7. AWESOME OSCILLATOR FILTER ===
Use_AO_Filter (Default: false) -> Activates the Awesome Oscillator module.
Use_AO_Volume_Filter (Default: false) -> Requires the AO value to exceed specific minimum thresholds.
AO_Buy_Min (Default: 4.0) -> The minimum positive AO value required to permit BUY signals.
AO_Sell_Max (Default: -4.0) -> The maximum negative AO value required to permit SELL signals.
Use_AO_Color_Filter (Default: false) -> Requires the AO histogram to show accelerating momentum (higher high or lower low).
Use_AO_Zero_Filter (Default: false) -> Requires the AO histogram to be structurally above 0 for BUYs and below 0 for SELLs.
=== 8. PARABOLIC SAR FILTER ===
Use_SAR_Filter (Default: false) -> Activates the Parabolic Stop and Reverse price action filter.
SAR_Step (Default: 0.02) -> The acceleration factor incremental step for the SAR calculation.
SAR_Maximum (Default: 0.2) -> The absolute maximum acceleration value allowed for the SAR calculation.
=== 9. HEIKEN ASHI FILTER ===
Use_HeikenAshi_Filter (Default: false) -> Activates the synthetic Heiken Ashi directional candle body filter.
=== 10. CCI TREND FILTER ===
Use_CCI_Filter (Default: false) -> Activates the Commodity Channel Index zero-line crossover filter.
CCI_Period (Default: 50) -> Defines the data period for the CCI trend calculation.
CCI_Applied (Default: PRICE_CLOSE) -> Sets the price field applied to the CCI trend calculation.
=== 11. CCI OB & OS FILTER ===
Use_CCI_OBOS_Filter (Default: false) -> Activates the Commodity Channel Index extreme level validation filter.
CCI_OBOS_Period (Default: 14) -> Defines the data period for the CCI extremes calculation.
CCI_OBOS_Applied (Default: PRICE_CLOSE) -> Sets the price field applied to the CCI extremes calculation.
CCI_Overbought (Default: 100.0) -> The upper boundary marking the CCI overbought threshold.
CCI_Oversold (Default: -100.0) -> The lower boundary marking the CCI oversold threshold.
=== 12. RVI FILTERS ===
Use_RVI_Filter (Default: false) -> Activates the Relative Vigor Index zero-line trend validation filter.
RVI_Period (Default: 75) -> The data calculation period for the RVI trend line.
Use_RVI_Signal_Filter (Default: false) -> Activates the RVI Main to RVI Signal line crossover filter.
RVI_Signal_Period (Default: 20) -> The specific data period utilized for the RVI crossover check.
=== 13. MACD FILTERS ===
Use_MACD_Filter (Default: false) -> Activates the MACD histogram directional validation filter (Main minus Signal).
MACD_FastEMA (Default: 12) -> The fast exponential moving average period for MACD.
MACD_SlowEMA (Default: 26) -> The slow exponential moving average period for MACD.
MACD_SignalSMA (Default: 9) -> The simple moving average period acting as the MACD signal line.
MACD_Applied (Default: PRICE_CLOSE) -> The price data vector used to compute the MACD metrics.
Use_MACD_Zero_Filter (Default: false) -> Requires the main MACD line to be strictly above or below the zero baseline.
=== 14. SR & FIBONACCI FILTERS ===
Use_SR_Filter (Default: false) -> Activates the dynamic Support and Resistance boundary validation filter.
SR_Period (Default: 50) -> The historical bar lookback period used to identify the highest highs and lowest lows.
SR_Zone_Points (Default: 80) -> The proximity tolerance zone measured in points for valid Support/Resistance rejection.
Use_Fib_Filter (Default: false) -> Activates the structural Fibonacci retracement zone filter.
Fib_Level_1 (Default: 0.382) -> The primary Fibonacci retracement ratio boundary.
Fib_Level_2 (Default: 0.618) -> The secondary Fibonacci retracement ratio boundary.
ZigZag_Depth (Default: 12) -> The required depth parameter for the underlying ZigZag swing identification.
ZigZag_Deviation (Default: 5) -> The minimal price deviation parameter to register a valid ZigZag leg.
ZigZag_Backstep (Default: 3) -> The required backstep parameter to establish a confirmed ZigZag pivot.

Risk Disclaimer:
Trading foreign exchange, commodities, and other financial instruments involves significant risk and may not be suitable for all investors. Past performance does not guarantee future results. This software is an analytical and operational tool designed to assist traders in technical analysis; it does not guarantee financial profit. Always thoroughly test the product on a demo account to understand its operational behavior before considering deployment in live trading environments.
Önerilen ürünler
RSI Currency Strength Meter is a powerful and elegant multi-currency indicator that measures the real-time relative strength of the 8 major currencies using RSI logic. By calculating the smoothed performance of each currency across its major pairs and applying the RSI formula, it delivers clean and responsive strength lines that make it easy to spot which currencies are truly strong or weak at any moment. This indicator is particularly useful for visualizing currency correlations and divergence
Binary Options Assistant (BOA) Multi Currency Dashboard for Binary Options (MT5) . You can use any of the BOA Signals Indicators with the dashboard. Just change the BOA Signals Indicator Name in the dashboard settings to the indicator you want to get signals from. For example: CHILL. BLAZE:  BOA_BLAZE_Indicator_v1   Strategy :   BLW Online Trading Binary Options Strategy (3 Moving Average) LAVA:  BOA_LAVA_Indicator_v1   Strategy:   Lady Trader Binary Options Strategy (Bollinger Bands & Stochas
Join Deriv link on profile>>> GET THIS FULL COPY AND GET ANOTHER FREE INDICATOR ONE OF THE BEST AND USEFULL INDICATORS IN THE WORLD ..This is the one of the best usefull indicators which has chosen to be used by top traders in the world. AUTOMATIC SUPPORT AND RESISTANCE This way of trading is also called Supply and demand, On this way of trading you can see auto colours appear where the market changes direction buying or selling Direction. ALL KIND OF PAIRS METALS AND INDICIES ARE INCLUDED A
CosmiCLab SMC FIBO CosmiCLab SMC FIBO is a professional trading indicator designed for traders who use Smart Money Concepts (SMC), market structure analysis and Fibonacci retracement levels. The indicator automatically detects market swings and builds Fibonacci levels based on the latest impulse movement. It also identifies market structure changes such as BOS (Break of Structure) and CHOCH (Change of Character), helping traders understand the current market direction. CosmiCLab SMC FIBO also pr
Price Magnet — Price Density and Attraction Levels Indicator Price Magnet is a professional analytical tool designed to identify key support and resistance levels based on statistical Price Density. The indicator analyzes a specified historical period and detects price levels where the market spent the most time. These zones act as “magnets,” attracting price action or forming a structural base for potential reversals. Unlike traditional Volume Profile tools, Price Magnet focuses on price-time d
Noize Absorption Index - is the manual trading system that measures the difference of pressure between bears forces and bulls forces. Green line - is a noize free index that showing curent situation. Zero value of index shows totally choppy/flat market.Values above zero level shows how powerfull bullish wave is and values below zero measures bearish forces.Up arrow appears on bearish market when it's ready to reverse, dn arrow appears on weak bullish market, as a result of reverse expectation.
Caicai L&S Yield Histogram Important Notice: This indicator is an integral tool of the automated EA Caicai Long and Short Pair Trading . This indicator visually displays the percentage deviation (Yield %) of a pair's current spread relative to its own historical mean. It is an excellent tool for quickly visualizing the gross financial potential of a market distortion in Long & Short operations. Main Features: Percentage Visualization: Understand the size of the distortion in palpable percentage
RBreaker
Zhong Long Wu
RBreaker Gold Indicators is a short-term intraday trading strategy for gold futures that combines trend following and intraday reversal approaches. It not only captures profits during trending markets but also enables timely profit-taking and counter-trend trading during market reversals. This strategy has been ranked among the top ten most profitable trading strategies by the American magazine   Futures Truth   for 15 consecutive years. It boasts a long lifecycle and remains widely used and st
GoldPro Max
Taher Ahmed Mohamed Taha Elshafei
GOLDPRO MAX Advanced Multi-Timeframe and Smart Money Market Analysis for MetaTrader 5 GoldPro Max is a professional market analysis indicator for MetaTrader 5 designed to help traders study market direction, price structure, liquidity, market imbalance and potential trading areas from multiple perspectives. The indicator combines Multi-Timeframe Analysis, Smart Money Concepts, Market Structure, Liquidity Analysis, Order Blocks, Fair Value Gaps, Premium and Discount analysis, Smart Analytical Eng
Fabii Half Trend Baseline
Fabien Georges Andre Guillemaud
Üst zaman diliminin trendine karşı işlem yapmayı bırakın. İki baseline, tek grafik. Repaint yok. Her parite, her zaman dilimi. 2 dakikada grafiğinizde. Strategy Tester içinde ücretsiz demo. Get more indicators here Baselines, volatility filters and oscillators. No repaint. Neden ihtiyacınız var Grafiğinizde bir çizgi yeşile döndüğü için işleme girersiniz. Sonra üst zaman dilimini açarsınız ve daha büyük trendin ters yönde olduğunu görürsünüz. Sinyal gerçekti. Ama arkasındaki trend sizin taraf
Enhanced Elliott Wave Pro – Advanced Market Structure & Wave Analysis   Enhanced Elliott Wave Pro is a lightweight, institutional-grade MT5 indicator that eliminates chart clutter by detecting and displaying only the current, active market structure: the 1-2-3-4-5 Impulse wave and the subsequent A-B-C Correction.   Built with classic Prechter wave rules and ATR-adaptive pivot detection, it delivers clean, real-time wave counts without bogging down your terminal.   ――――――――――――――――――――――――――――
Stratos Pali mt5
Michela Russo
4.5 (8)
Stratos Pali Indicator is a revolutionary tool designed to enhance your trading strategy by accurately identifying market trends. This sophisticated indicator uses a unique algorithm to generate a complete histogram, which records when the trend is Long or Short. When a trend reversal occurs, an arrow appears, indicating the new direction of the trend. Important Information Revealed Leave a review and contact me via mql5 message to receive My Top 5 set files for Stratos Pali at no cost ! Down
Confluence Meter: 26 göstergeden tek bir birleşik derecelendirme Confluence Meter , 26 popüler göstergenin sinyallerini hesaplar ve bunları "sat / nötr / al" şeklinde basit bir derecelendirmede toplar. Onlarca pencere açmanıza ve değerleri elle karşılaştırmanıza gerek yoktur. Panele bir kez bakmak, seçili zaman diliminde piyasanın hangi yöne eğilimli olduğunu görmeye yeter. MT4-version:  https://www.mql5.com/en/market/product/199466 Our products: https://www.mql5.com/en/users/trendhunter/seller
HMA Trend Professional MT5
Pavel Zamoshnikov
4.25 (4)
Improved version of the free HMA Trend indicator (for MetaTrader 4) with statistical analysis. HMA Trend is a trend indicator based on the Hull Moving Average (HMA) with two periods. HMA with a slow period identifies the trend, while HMA with a fast period determines the short-term movements and signals in the trend direction. The main differences from the free version: Ability to predict the probability of a trend reversal using analysis of history data. Plotting statistical charts for analyzi
# DRAWDOWN INDICATOR V4.0 - The Essential Tool to Master Your Trading ## Transform Your Trading with a Complete Real-Time Performance Overview In the demanding world of Forex and CFD trading, **knowing your real-time performance** isn't a luxury—it's an **absolute necessity**. The **Drawdown Indicator V4.0** is much more than a simple indicator: it's your **professional dashboard** that gives you a clear, precise, and instant view of your trading account status. --- ## Why This Indicator
MT5 için "HTF Hareketli Ortalamalar Çaprazı" Kripto Forex Göstergesi. - MT5 için güçlü HTF Hareketli Ortalamalar Çaprazı göstergesiyle işlem yöntemlerinizi geliştirin. HTF, daha yüksek zaman aralığı anlamına gelir. - Bu gösterge, Fiyat Hareketi girişleri olan Trend Yatırımcıları için mükemmeldir. - Mevcut grafiğinize daha yüksek zaman aralığından Hızlı ve Yavaş Hareketli Ortalamalar eklemenizi sağlar --> bu profesyonel bir yöntemdir. - HTF Hareketli Ortalamalar Çaprazı, mobil ve PC için yerleşi
Genel Bakış Candle Timer Countdown Pro, mevcut mumun kapanışına kadar olan süreyi pürüzsüz ve doğru bir şekilde geri sayım olarak gösterir ve dairesel ilerleme yayı ile görsel destek sağlar. Özellikler Kesintisiz geri sayım Dairesel ilerleme halkası 6 konum seçeneği 3 renk modu Son geri sayım vurgusu Bağlantı durumu algılama Yeni mum uyarıları Düşük CPU kullanımı Kurulum MQL5 Market’ten indirin Grafiğe ekleyin Ayarları yapılandırın Uyumluluk MetaTrader 5 Build 2500+ Tüm semboller Tüm zaman dilim
TRI Visualizer
Yoshimi Mon 三 Ura
TRI Visualizer MT5 – Thermodynamic Market Analysis Overview The TRI (Thermal Range Indicator) Visualizer Enhanced is a rare market analysis indicator that goes beyond conventional technical analysis, applying principles of thermodynamics from physics. It interprets market price fluctuations as “thermodynamic energy,” enabling the highly accurate detection of subtle market changes that are often overlooked. Innovative Mechanisms 1. Dual Calculation Engines Classic TRI Mode Formula: |Close
Level Volume Pro
John Samfel Bucton Josol
HAT IT DOES   MONTHLY HIGH & LOW — AUTO-DRAWN EVERY MONTH Draws the High and Low of every month for the current year (or any year you set). Each level extends as a horizontal ray into the future so you always see where price is reacting to historical monthly extremes. Color-coded (blue = high, red = low), labeled (JAN HIGH, FEB LOW etc.), fully customizable width and style. Toggle individual months on or off.   WEEKLY HIGH & LOW
ONNYX INDICATOR sürüm 1.14 MetaTrader 5 için onaylanmış ve yeniden boyanmayan sinyallere sahip arz-talep göstergesidir. Onaylı salınımları belirler, bölge genişliğini ATR ile ayarlar, kaliteyi yüzde olarak gösterir ve kapanmış mumlarda BUY/SELL okları çizer. TEMEL ÖZELLİKLER - Bölge içinde yüzde kalite puanı bulunan arz-talep bölgeleri. - Mum kapanışından sonra büyütülmüş BUY/SELL okları. - İsteğe bağlı EMA trend filtresi ve mum reddi onayı. - Trend, fiyat seviyeleri ve piyasa bağlamı paneli. -
Divergence Matrix Pro for MetaTrader 5 Divergence Matrix Pro is a confirmed multi-oscillator divergence indicator for MetaTrader 5. It detects regular and hidden divergence between price and selected oscillators, then presents the confirmed structure through divergence lines, pivot labels, action markers, an optional current-timeframe Matrix Panel and optional alerts. The indicator is an analysis and confirmation tool. It does not open or close trades, and the signal score is not a win rate or a
NQX Smooth Trend Flip Weekly Bias, MetaTrader 5 için bir sinyal göstergesidir: yumuşatılmış trend dönüşü sinyalleri (yalnızca haftalık eğilim yönünde sinyal verir). Bir hareketin ardından yumuşatılmış mumların renk değiştirmesini tespit eden özel NQX mantığı. Yalnızca haftalık eğilim yönünde sinyal verir. Önerilen girişi, kısa bir stopu ve uzak hedefleri (3:1, 5:1, 10:1, swing'de 20:1'e kadar) çizer; kararı siz verirsiniz. Grafikte neler çizer - Kapanmış sinyal mumunun üzerinde bir ok (kapanmış
The Trend Duration Forecast MT5 indicator is designed to estimate the probable lifespan of a bullish or bearish trend. Using a Hull Moving Average (HMA) to detect directional shifts, it tracks the duration of each historical trend and calculates an average to forecast how long the current trend is statistically likely to continue. This allows traders to visualize both real-time trend strength and potential exhaustion zones with exceptional clarity. KEY FEATURES Dynamic Trend Detection:   Utiliz
NQX Oscillator Hook London
Marcel De Oliveira Farias
NQX Oscillator Hook London, MetaTrader 5 için bir sinyal göstergesidir: osilatör kancası sinyalleri (yalnızca Londra seansı sırasında sinyal verir (gün içi grafikler)). Aşırı bir bölgeden çıkan osilatör kancasını tespit eden özel NQX mantığı. Yalnızca Londra seansı sırasında sinyal verir (gün içi grafikler). Önerilen girişi, kısa bir stopu ve uzak hedefleri (3:1, 5:1, 10:1, swing'de 20:1'e kadar) çizer; kararı siz verirsiniz. Grafikte neler çizer - Kapanmış sinyal mumunun üzerinde bir ok (kapanm
Pro Gold System Indicator
PEDRO JOAQUIM GONCALVES GOMES
ADVANCED FUNCTIONALITIES: Trend Score (0-100) with visual bar Intelligent signals with adjustable strength (1-10) Risk management with automatic TP/SL Audible and visual alerts Price zones with smooth filling Multi-indicator analysis (RSI, ATR, BB, EMAs) DESIGN FEATURES Modern Visual: Smooth and well-spaced lines (EMA with 2-3px width) Vibrant and professional colors (Sky Blue, Orange, Gold) Modern arrows (code 233/234) for buy/sell signals Configurable dark/light theme Adjustable transparency f
Trend Follower — a trend map for MetaTrader 5 Trend Follower does not tell you where to buy or sell. It shows where the market is: uptrend, downtrend or consolidation, and whether the current trend is gaining or losing strength. You read the map and make the decision. HOW TO READ IT Green   — uptrend. Red — downtrend. Shade   — a full, strong color means the trend is in force. When momentum fades, the color fades step by step; in a consolidation it is at its palest. When the trend accelerates a
Ichimoku Kinko Hyo is a purpose-built trend trading charting system that has been successfully used in nearly every tradable market. It is unique in many ways, but its primary strength is its use of multiple data points to give the trader a deeper, more comprehensive view into price action. This deeper view, and the fact that Ichimoku is a very visual system, enables the trader to quickly discern and filter "at a glance" the low-probability trading setups from those of higher probability. This i
The  SuperTrend Advance Trading  is a widely-used technical indicator based on  SuperTrend Strategy + Price Action + EMA . How it works: -  Buy/Sell Signals  can be generated when the trend reverses, the conditions of Price action, TrendLine and EMA are met. - After the  Signal  appears, be patient and wait until the candle closes, at that time place the order as soon as possible. You may have time to review your entry, consider whether it is a good entry or not. - Carefully review the entry, up
Trend pullback EA for XAUUSD: 8/13/21/34/55 EMA ribbon alignment + MACD histogram turn after a pullback. Exits when the ribbon disorders. GoldLab MACD Ribbon is an Expert Advisor that combines an EMA ribbon with the MACD histogram to join established trends after a pullback. It was designed for XAUUSD (Gold) and also runs on forex pairs and other CFDs. Every trade has a stop-loss. How it trades Trend: the EMA ribbon (8, 13, 21, 34, 55) must be fully aligned - every faster EMA above the slower on
Heiken_Ashi_Bars - MT5 için Gelişmiş Trend Görselleştirici Genel Bakış Heiken_Ashi_Bars , piyasa gürültüsünü filtrelemek ve temel trendi vurgulamak için tasarlanmış güçlü, görsel olarak sezgisel bir özel göstergedir (indicator). Geleneksel mum grafikler genellikle düzensiz olabilir. Bu gösterge fiyat verilerinin ortalamasını alarak fiyat hareketini pürüzsüzleştirir, böylece trend devamlılıklarını, geri dönüşleri ve karlı giriş bölgelerini tespit etmeyi çok daha kolay hale getirir. Temel Özellikl
Bu ürünün alıcıları ayrıca şunları da satın alıyor
Trend Sniper X
Sarvarbek Abduvoxobov
4.86 (44)
Trend Sniper X , tüccarların trend yönünü ve olası dönüş noktalarını netlik ve hassasiyetle belirlemelerine yardımcı olan MetaTrader 5 için çoklu zaman dilimli bir trend takip göstergesidir. MT4 için: https://www.mql5.com/en/market/product/193245 Fiyat Bilgisi: Mevcut fiyat tanıtım amaçlıdır ve gelecek güncellemeler ile yeni özellikler yayınlandıkça değişebilir. Bonus Fırsatı: Bu indikatör için ÜCRETSİZ Oto-Trade Assistant EA'yı almak için lütfen satın aldıktan sonra yazara mesaj gönderin. Code
Şehre yeni bir Kral geldi - Gösterge + Emir Yönetimi göstergeleri (TP1 + TP2 + TP3) + Opsiyonel Telegram Sinyal Gönderici DAHİL (ÜCRETSİZ) (TAM TRADING ve SİNYAL SİSTEMİ) Altın için en iyi EA’mız: Gold Slayer Bu gösterge; gelişmiş bir strateji, özelleştirilebilir emir yönetimine sahip bir trading sistemi ve envelope uzantılarını birleştiren bir mean reversion sistemi içerir. Ayrıca RSI gibi birçok akıllı onay filtresiyle desteklenerek yüksek olasılıklı dönüş girişlerini AL ve SAT sinyalleriyle y
Smart Trend Trading System — MetaTrader 5 Satın aldıktan sonra Smart Universal Expert Advisor'ı ÜCRETSİZ edinmek ve beraberinde çevrimiçi kurs, PDF kılavuzu ve özel gruba erişim almak için MQL5 üzerinden bana mesaj gönderin. STTS; trend yönünü, giriş ve çıkış sinyallerini, dönüş bölgelerini ve önemli fiyat seviyelerini doğrudan grafiğinizde bir araya getirir. Sistemi manuel işlemler için kullanabilir veya ayrı bir uyumlu EA’yı bağlayarak seçtiğiniz ayarlarla otomatik işlem gerçekleştirebilirsini
Zoryk Gold
Reda El Koutbane
4.78 (18)
ZORYK — MetaTrader 5 İçin Gelişmiş XAUUSD Sinyal Sistemi Bu hissi biliyorsunuz. Altını analiz etmek için uzun zaman harcarsınız. Doğru giriş noktasını beklersiniz. Sonunda işlemi açarsınız ve fiyat hemen aleyhinize hareket etmeye başlar. İşlemi çok erken kapatırsınız, Stop Loss seviyesini değiştirirsiniz veya birkaç saniye tereddüt edersiniz. Daha sonra piyasa, başlangıçta beklediğiniz hedefe tam olarak ulaşır; ancak siz artık işlemin içinde değilsinizdir. Sorun her zaman yön değildi. Asıl sorun
Entry Points Pro, emri vermeden önce nereden gireceğinizi, stopu nereye koyacağınızı ve hangi lotla işlem yapacağınızı gösterir. FİYAT Şu anda 149 USD ve bu fiyattan satılan son kopya. Sonrasında fiyat 199 USD'ye çıkacak, nihai fiyat ise 349 USD. Paramı piyasalarda işlem yaparak kazanıyorum ve bunu gösteriyorum, bu yüzden bu indikatörü herkese satmak zorunda değilim. Bu, kendi kafasıyla düşünen traderlar için bir araç, sihirli bir düğme değil. Ok mum kapanışında belirir ve repaint olmaz. İki ay
İşlem avantajınızı görüş alanınıza alın! M5 Sniper , MeanFX tarafından geliştirilen yeni bir indikatördür. Hassas işlem sinyallerini adaptif TP/SL seviyeleriyle birleştirir — bunun sonucunda mümkün olan en iyi istatistiksel işlemleri oluşturur! Fiyat her 5 satın alımda bir artar, bir sonraki fiyat 69$ olacaktır. Satın aldıktan sonra ipuçları/rehber ve bonus EA almak için bana mesaj gönderin. Onu öne çıkaran nedir? Kanıtlanmış istatistiksel performans Gold XAUUSD üzerinde ( neredeyse her varlıkta
SuperScalp Pro
Van Minh Nguyen
4.54 (37)
SuperScalp Pro - Professional Multi-Layer Confluence Scalping System SuperScalp Pro, klasik Supertrend sistemini birden fazla akıllı doğrulama filtresiyle geliştiren ileri düzey bir scalping göstergesidir. Yanlış sinyalleri önemli ölçüde azaltırken başarı olasılığı daha yüksek Buy/Sell işlem fırsatlarını belirlemenize yardımcı olur. Buy ve Sell okları doğrudan grafik üzerinde net bir şekilde görüntülenir. ATR tabanlı Stop Loss ve Take Profit seviyeleri de gerçek zamanlı olarak otomatik hesaplanı
Gold Trend Coach MT5
Cristhian Alexander Gaibor Cuasquer
4.2 (10)
Gold Trend Coach, MetaTrader 5 için altın (XAUUSD) trend göstergesidir: mum kapanışında onaylanan (repaint yok) alış ve satış sinyalleri, stop loss ve üç take profit, sizi girişten TP3'e kadar yönlendiren bir koç, çoklu zaman dilimi paneli ve telefonunuza ve Telegram'a uyarılar. Londra ve New York seanslarında M1 ve M5 scalping ve M15 gün içi işlem için yapıldı. BONUS: Gold Trend Coach için ÜCRETSİZ otomatik işlem EA. Satın aldıktan sonra bana yazın, göstergenin sinyallerini kendisi işleyen EA'y
GoldenX Entry MT5
VividMind Digital Solutions
5 (17)
GoldenX Entry, adaptif Smart Entry Trend algoritmasına, sinyal skorlaması sistemine, piyasa rejimi algılayıcısına ve volatilite filtresine sahip bir MT5 indikatörüdür. Her sinyal; hesaplanmış bir giriş seviyesi, üç adet Take-Profit seviyesi (TP1, TP2, TP3) ve bir Stop-Loss seviyesi içerir. Farklı piyasa koşullarına uyum sağlamak için tasarlanmış çok katmanlı analitik yapı üzerine kuruludur ve yerleşik optimizasyon aracı ile istatistik takip sistemini birleştirir. Risk-ödül (RR) metrikleri ve geç
SMC Intraday Formula
VividMind Digital Solutions
5 (26)
Önce dürüst olalım. Hiçbir gösterge tek başına sizi kârlı yapmaz. Eğer biri size aksini söylüyorsa, size bir hayal satıyordur. Mükemmel al/sat okları gösteren her gösterge, kusursuzmuş gibi görünecek şekilde yapılabilir — sadece geçmişin doğru bir bölümünü yakınlaştırıp kazanan işlemleri ekran görüntüsü almanız yeterlidir. Biz bunu yapmıyoruz.  SMC Intraday Formula bir araçtır. Piyasa yapısını sizin için okur, en yüksek olasılıklı fiyat bölgelerini belirler ve şu anda akıllı paranın izinin nası
Gann Made Easy , bay teorisini kullanarak ticaretin en iyi ilkelerine dayanan, profesyonel ve kullanımı kolay bir Forex ticaret sistemidir. WD Gann. Gösterge, Zararı Durdur ve Kâr Al Seviyeleri dahil olmak üzere doğru SATIN AL ve SAT sinyalleri sağlar. PUSH bildirimlerini kullanarak hareket halindeyken bile işlem yapabilirsiniz. Satın alma işleminden sonra, alım satım talimatlarını ve harika ek göstergeleri ücretsiz olarak almak için lütfen benimle iletişime geçin! Muhtemelen Gann ticaret yöntem
Ultra Indicator
Ihor Otkydach
5 (1)
ULTRA, “hepsi bir arada” prensibiyle çalışan bir teknik göstergedir; piyasayı bağımsız olarak analiz eder, işlem sinyalleri üretir, stop-loss emirlerinin verileceği seviyeleri gösterir ve kârı garantilemek ya da zararı en aza indirmek için işlemlerin ne zaman kapatılması gerektiğini önerir. Başka bir deyişle, piyasayı nasıl analiz edeceğinizi bilmeseniz, seviyeleri (stop-loss'unuzu nereye koyacağınızı) belirleyemeseniz ya da para yönetimi konusunda zorluk yaşasanız da fark etmez. ULTRA tüm bunla
Boba Analysis Suite
Trade Ready Solutions LLC
5 (2)
Boba Analysis Suite Boba Analysis Suite, MetaTrader 5 için geliştirilmiş bir analiz göstergesidir. Piyasa yapısını, önemli fiyat bölgelerini ve genel piyasa bağlamını tek bir grafik görünümünde bir araya getirir. Trader ve trading eğitmeni olarak edinilen uygulamalı deneyimden yola çıkarak geliştirilmiştir. Piyasanın yönünü değerlendirme, önemli seviyeleri belirleme ve birden fazla zaman dilimini birlikte inceleme gibi adımlardan oluşan sistematik bir analiz sürecini destekler. Piyasa Bağlamını
Sonraki Güncelleme — Sürüm 2.52 Çok Yakında! [YENİ] Piyasa Analizinizi ve İşlem Sürecinizi Geliştirmek İçin Tasarlanmış 4 Büyük Yeni Özelliğe Hazır Olun İşlem ihtiyaçlarınızı karşılamak üzere tasarlanmış 4 yeni özellikle piyasa analizini bir üst seviyeye taşıyoruz. İşte yeni özellikler: 1. TRADE OVERVIEW DASHBOARD 2. CONFLUENCE AT ZONE 3. STRONG & WEAK HIGH/LOW 4. OTE 1. TRADE OVERVIEW DASHBOARD Piyasanın genel görünümünü daha kolay anlamanıza yardımcı olan, işlem kararlarınızı desteklemek için
M1 Sniper MT5
Oleg Rodin
5 (7)
M1 SNIPER   kullanımı kolay bir işlem göstergesi sistemidir. M1 zaman dilimi için tasarlanmış bir ok göstergesidir. Gösterge, M1 zaman diliminde scalping için bağımsız bir sistem olarak kullanılabilir ve mevcut işlem sisteminizin bir parçası olarak kullanılabilir. Bu işlem sistemi özellikle M1'de işlem yapmak için tasarlanmış olsa da, diğer zaman dilimleriyle de kullanılabilir. Başlangıçta bu yöntemi XAUUSD ve BTCUSD ticareti için tasarladım. Ancak bu yöntemi diğer piyasalarda işlem yaparken de
FiboSniper Pro
Van Minh Nguyen
5 (4)
FiboSniper Pro – Multi-Filter Fibonacci System with Auto SL/TP and Control Panel FiboSniper Pro, seçilmiş Buy ve Sell sinyalleri üretmek için dinamik Fibonacci Envelopes ile birden fazla doğrulama filtresini birleştiren teknik bir göstergedir. Fibonacci seviyeleri Moving Average ve ATR temel alınarak hesaplanır ve ardından ADX, EMA, RSI, ATR, Volume, Time ve Candle yapısı ile filtrelenir. Gösterge, ATR tabanlı otomatik Stop Loss ve Take Profit seviyelerini doğrudan grafik üzerinde görüntüler ve
Auto Optimized SpeedAngle , sürekli İleriye Dönük Optimizasyon (Walk-Forward Optimization, WFO) yoluyla eğri uydurmayı (curve-fitting) ortadan kaldıran kurumsal düzeyde bir momentum vektörleme sistemidir. Piyasa rejimleri değiştiğinde etkinliğini yitiren statik girdilere güvenmek yerine, gösterge, örneklem dışı (Out-of-Sample, OOS) doğrulama kullanarak parametrelerini dinamik olarak yeniden kalibre eder ve böylece gösterilen sinyallerin geçmişteki rastgele anomalileri değil, gerçek bir istatisti
Adaptive Price Action Engine Göstergeyi al, EA'sı (Uzman Danışman) bedava gelsin Kendi Kendini Optimize Eden Multi-Timeframe Trend ve Mum Formasyonu Analizi Piyasalar sürekli değişir ve her Price Action formasyonu her piyasa koşulunda aynı değere sahip değildir. Adaptive Price Action Engine , değişen piyasa koşullarına uyum sağlamak amacıyla trend yapısını, Multi-Timeframe analizini, mum formasyonlarını ve istatistiksel optimizasyonu tek bir analiz sistemi içerisinde birleştirir. İki Adaptif Mod
Crystal Heikin Ashi Signals
Muhammad Jawad Shabir
5 (5)
Crystal Heikin Ashi Signals—Professional Trend & Signal Detection Indicator Advanced Heikin Ashi Visualization with Intelligent Signal System for Manual & Automated Trading Final Price: $149 ---------> Price goes up $10 after every 10 sales . Limited slots available — act fast . Overview User Guide PDF Crystal Heikin Ashi Signals is a professional-grade MetaTrader 5 indicator that combines pure Heikin Ashi candle visualization with an advanced momentum-shift detection system. Designed for both m
Scalper Vault, gün içi işlemlerde istikrar yakalamak isteyen yatırımcılar için tasarlanmış, güçlü ve tam donanımlı bir alım satım sistemidir. Bu yüksek hassasiyetli gösterge; hem Forex hem de İkili Opsiyon yatırımcıları için kurumsal düzeyde analizler sunan, bağımsız ve eksiksiz bir alım satım sistemi işlevi görür. SATIN ALIM İŞLEMİNDEN SONRA BENİMLE İLETİŞİME GEÇİN; ALIM SATIM İPUÇLARIMI VE HARİKA BİR BONUSU ALIN! Tahmin yürütme zorunluluğunu ve karmaşık manuel analiz süreçlerini ortadan kaldı
Trend Catcher ind mt5
Ramil Minniakhmetov
5 (18)
TREND YAKALAYICI GÖSTERGE Trend Yakalayıcı Gösterge, yazarın tescilli ve özelleştirilmiş uyarlanabilir trend analiz göstergelerinin bir kombinasyonunu kullanarak piyasa fiyat hareketlerini analiz eder. Kısa vadeli gürültüyü filtreleyerek ve temel momentum gücüne, volatilite genişlemesine ve fiyat yapısı davranışına odaklanarak gerçek piyasa yönünü belirler. Ayrıca, hareketli ortalamalar, RSI ve volatilite filtreleri gibi yumuşatma ve trend filtreleme özelleştirilmiş göstergelerinin bir kombina
Atomic Analyst MT5
Issam Kassas
4.5 (64)
Atomic Analyst — MetaTrader 5 Satın aldıktan sonra Smart Universal Expert Advisor'ı ÜCRETSİZ edinmek ve beraberinde çevrimiçi kurs, PDF kılavuzu ve özel gruba erişim almak için MQL5 üzerinden bana mesaj gönderin. Atomic Analyst; fiyat hareketini, trend yönünü, giriş ve çıkış sinyallerini, Stop Loss ve birden fazla Take Profit seviyesini doğrudan grafiğinizde bir araya getirir. SİNYALİ GÖRÜN. İŞLEM KOŞULLARINI ANLAYIN. Atomic Analyst, analizini anlaşılır görsel bilgiler halinde sunar: • Olası gir
Unix Scalper
Issam Kassas
4 (4)
Unix Scalper — MetaTrader 5 Satın aldıktan sonra Smart Universal Expert Advisor'ı ÜCRETSİZ edinmek ve beraberinde çevrimiçi kurs, PDF kılavuzu ve özel gruba erişim almak için MQL5 üzerinden bana mesaj gönderin. İşlem fırsatını belirleyin. Planı görün. Nasıl işlem yapacağınıza karar verin. UNIX Scalper; piyasa analizini, BUY/SELL/WAIT kararlarını ve Entry, Stop Loss, TP1 ve TP2 seviyelerini düzenli bir panelde bir araya getirir. SİNYALİ VE PLANI GÖRÜN • Net kararlar: BUY, SELL veya WAIT. • Belir
SIO Oscillator: Kendi Kendini Optimize Eden Yarı Varyans Dengesizlik Osilatörü İndikatörü satın alın, ona dayalı Uzman Danışmanı (EA) ÜCRETSİZ edinin. Çoğu osilatör, tüm fiyat hareketlerini aynı şekilde değerlendirir. SIO ise yükseliş ve düşüş baskısını birbirinden ayırır ve aralarındaki dengesizliği ölçerek piyasayı gerçekte kimin kontrol ettiğini gösterir: alıcılar mı, satıcılar mı. Dengesizlik bir uç noktaya ulaştığında SIO, giriş, Stop Loss ve Take Profit seviyeleriyle birlikte net bir sinya
Volatility Master for MetaTrader is a real-time dashboard tool that scans up to  50 symbols  to identify high-volatility , trending markets instantly. With bullish/bearish signals, customizable alerts, and a user-friendly interface, it helps you avoid range-bound conditions and focus on high-probability trades. Clarity leads to confidence. Trade confidently and protect your capital effectively with this powerful dashboard. We don't offer free or bonus indicators in exchange of reviews from you.
Smc Pro ToolKit
Talal N Z Aljarusha
5 (14)
SMC PRO TOOLKIT — SMART MONEY ANALYSIS & STRUCTURED TRADE PLANNING SMC Pro ToolKit is a professional Smart Money Concepts analysis workspace for MetaTrader 5. It combines market structure, multi-timeframe analysis, institutional price zones, setup evaluation, confirmation tools, volume context, alerts, and risk planning inside one organized chart environment. One workspace. Multiple layers of confirmation. One structured trading plan. OPEN COMPLETE USER GUIDE MULTI-CONDITION SETUP ENGINE At
Çoklu Para Birimi Güç ve Momentum Göstergesi MT5 Dynamic Forex28 Navigator, uzun süredir popüler olan göstergelerimizin gelişmiş halidir ve üç aracın gücünü tek bir araçta birleştirir: Advanced Currency Strength28 Indicator (700 değerlendirme) Advanced Currency IMPULSE with ALERT (530 değerlendirme) CS28 Combo Signals (güncel bonus) İki önceki gösterge MQL5 Market'te birlikte 1.200'den fazla değerlendirme aldı ve 2016'dan bu yana MT4 topluluğunun vazgeçilmez araçlarından biri. Dynamic Forex28 Na
AriFocus
Temirlan Kdyrkhan
AriFocus - Non-Repainting Buy/Sell Signals AriFocus - one clear signal. AriFocus marks buy and sell signals directly on the chart and suggests a stop-loss level for each one. Every signal is confirmed on bar close and never repaints. - Buy/sell arrows, confirmed on bar close - Suggested stop-loss level for every signal - Trend band and candle coloring to show direction at a glance - 10 ready-made presets, or your own settings (14 calculation methods) - Pop-up, push and email alerts with entr
Neuro Poseidon MT5
Daria Rezueva
4.68 (53)
Neuro Poseidon is a new indicator by Daria Rezueva. It combines precise trading signals with adaptive TP/SL levels - creating best possible trades as a result! Message me and get  Neuro Poseidon Assistant  as a gift to automize your trading process! What makes it stand out? 1. Proven profitability on all assets and timeframes 2. Only confirmed BUY and SELL signals present on the chart 3. Adaptive TP & SL levels generated by the software for each trade 4. Easy to understand - suitable for al
Protect against whipsaws: revolutionize your swing trading approach Swing Trading is the first indicator designed to detect swings in the direction of the trend and possible reversal swings. It uses the baseline swing trading approach, widely described in trading literature. The indicator studies several price and time vectors to track the aggregate trend direction and detects situations in which the market is oversold or overbought and ready to correct. [ Installation Guide | Update Guide | Tro
Yazarın diğer ürünleri
Parabolic SAR Multi-Filter System MT5: Algorithmic Trend Reversal Engine 1. PRODUCT OVERVIEW & OPERATIONAL ARCHITECTURE Parabolic SAR Multi-Filter System MT5 is a professional multi-component technical analysis indicator engineered for the MetaTrader 5 terminal. The indicator combines J. Welles Wilder's classic Parabolic Time/Price System with an advanced modular filtering architecture comprising 17 distinct secondary validation engines. The primary objective of this software is to eliminate f
1. OVERVIEW Harmonic Dashboard is a specialized multi-symbol and multi-timeframe analytical indicator designed for MetaTrader 5 (MT5). The software systematically scans financial instruments across multiple timeframes to identify six classical harmonic chart patterns: Gartley, Bat, Butterfly, Crab, Cypher, and Shark. The application consolidates multi-asset scanner results, trend filter validation metrics, price level projections, and interactive chart navigation controls into a single graphic
Overview MACD Signal with Multi Filters is an advanced technical analysis indicator engineered for MetaTrader 5 (MT5). The software combines the classic Moving Average Convergence Divergence (MACD) oscillator architecture with a modular 14-filter confirmation engine (MultiFilterSuite). It is developed to assist manual traders, quantitative analysts, and algorithmic system developers in identifying momentum shifts, trend continuations, and structural turning points while filtering out sideways ma
Overview The MA Cross Scanner Pro is an advanced, highly optimized multi-symbol and multi-timeframe analytical dashboard engineered specifically for the MetaTrader 5 terminal. Designed for technical analysts, systemic traders, and quantitative researchers, this utility serves as a comprehensive market surveillance engine. Its primary objective is to continuously monitor a customized array of financial instruments across numerous timeframes simultaneously, detecting precise moving average crosso
Hull Trend Arrows MT5 with Multi-Filter Suite - Technical Documentation 1. Overview and Analytical Purpose Hull Trend Arrows MT5 with Multi-Filter Suite is an algorithmic technical indicator for MetaTrader 5. It integrates the low-lag calculation engine of the Hull Moving Average (HMA) with fourteen modular confirmation filters to identify directional momentum transitions, calculate inflection points, and display non-repainting entry signals on the chart. Standard moving averages introduce sign
FREE
HA Signal MultiFilter MT5 - Technical Operational Manual & Architecture Guide 1. SYSTEM OVERVIEW & ARCHITECTURAL FOUNDATION HA Signal MultiFilter MT5 is a specialized analytical indicator developed for MetaTrader 5 terminal to identify directional momentum expansions and structural trend continuations[cite: 2]. By synthesizing smoothed Heiken Ashi candlestick price discovery with a modular 15-layer secondary confirmation filter suite, the system extracts high-probability market shifts while fil
FREE
Product Overview: Relative Vigor Index Multi-Filter Technical System The Relative Vigor Index (RVI) Multi-Filter Indicator is a comprehensive technical analysis engine developed for the MetaTrader 5 terminal. Designed to identify cyclical momentum shifts, trend continuations, and structural market turning points, this analytical system couples the classic Relative Vigor Index formula with an advanced multi-layered confirmation matrix consisting of 17 distinct technical filters. Rather than rely
FREE
CCI MultiFilter Overbought Oversold Signal Pro MT5 Technical Specification & Operational Manual  1. Overview and System Identity CCI MultiFilter Overbought Oversold Signal Pro MT5 is an institutional-grade technical analysis indicator engineered natively for MetaTrader 5. Developed for quantitative analysts, systematic manual traders, and multi-asset operators, the system provides an objective algorithmic framework to identify cyclical market extremes, momentum shifts, and structural trend cont
Multi-Pattern Signal Suite with Universal 14-Filter Framework for MetaTrader 5 1. Product Overview Multi-Pattern Signal Suite is an advanced technical analysis indicator engineered for the MetaTrader 5 terminal. The indicator detects high-probability candlestick formations comprising PinBar, Candle Rejection, and Marubozu (Full Body Candle) patterns. To eliminate market noise and false breakout formations, the core price action engine is integrated with the Universal MultiFilterSuite framework:
Overview: ADX Signal MultiFilter is an advanced technical analysis indicator for MetaTrader 5 designed to identify directional breakout momentum and trend acceleration phases. Built around the mathematical framework of J. Welles Wilder's Directional Movement system (ADX, +DI, and -DI), the tool monitors dynamic momentum shifts where directional movement lines break through user-defined threshold levels. To resolve the common challenge of false breakout signals during ranging or choppy market con
Bollinger Band Breakout MultiFilter PRO Signal MT5 1. Overview and Operational Purpose Bollinger Band Signal MultiFilter MT5 is an analytical technical indicator developed for the MetaTrader 5 terminal, designed to detect volatility expansion breakouts while filtering market noise through an extensive modular array of quantitative secondary filters. In dynamic market environments, classic envelope breakouts frequently encounter false continuations during low-momentum ranges or trend exhaustion
Breakout Divergence RSI MultiFilter is a modular technical analysis indicator for MetaTrader 5 designed to identify Regular and Hidden RSI Divergences alongside confirmed trendline breakout continuation opportunities. Equipped with an algorithmic multi-layer filtering engine comprising 16 technical filter systems, this indicator provides an analytical bridge between momentum divergence recognition and structural price action confirmation. 1. TECHNICAL OVERVIEW AND ARCHITECTURE Breakout Diverge
Pro CHO Chaikin Oscillator X Zero Signals Filter Chaikin Oscillator Signal MultiFilter for MetaTrader 5 Product Overview Chaikin Oscillator Signal MultiFilter is a professional-grade technical analysis indicator engineered specifically for the MetaTrader 5 trading platform. The system is designed to identify directional momentum transitions and institutional volume flow dynamics by tracking the Chaikin Oscillator algorithmic model in synchronization with a comprehensive 14-filter confirmation
### Product Overview The Engulfing Dual-Engine and Multi-Filter Confirmation Indicator for MetaTrader 5 is a specialized technical analysis analytical tool engineered to identify directional engulfing candlestick patterns across global financial markets. Developed for quantitative analysts, discretionary traders, and algorithmic strategy designers, the software categorizes engulfing structures into two distinct computational classifications: Standard Retail Engulfing and Advanced Institutional E

1. Overview and Indicator Identity Fractal Breakout MultiFilter MT5 is an institutional-grade technical indicator engineered natively for MetaTrader 5 that identifies high-probability structural breakout opportunities based on multi-bar fractal geometries and confirms them through an institutional suite of fourteen independent analytical filters. The primary purpose of this analytical tool is to eliminate subjective chart interpretation by mathematically locating confirmed price swing highs and
Product Overview: Heiken Ashi Multi-Filter Suite MT5 The Heiken Ashi Multi-Filter Suite is an analytical trading indicator developed natively for MetaTrader 5, designed to provide directional price smoothing, structural reversal detection, and rule-based signal confirmation. By merging modified Heiken Ashi bar calculations with a modular 14-indicator filtering engine, the tool eliminates transient market noise and provides traders with disciplined visual signals. The indicator is built around t
MultiFilter MA High Low Cross Buy Sell Arrows MT5 - Professional Technical Manual 1. Product Overview & System Architecture MultiFilter MA High Low Cross Buy Sell Arrows MT5 is an advanced technical indicator engineered for the MetaTrader 5 trading terminal. Designed for professional technical analysts, manual chartists, and systematic discretionary traders, this software identifies high-probability directional momentum expansions and trend resumption points by tracking price interactions acro
MultiFilter MA Crossover Signals Trend Alerts MT5 TECHNICAL SPECIFICATION & MANUAL Overview: MultiFilter MA Crossover Signals Trend Alerts MT5 is an analytical technical indicator engineered for MetaTrader 5, developed to identify systematic trend transitions through dual moving average crossovers combined with a 17-module quantitative filtering matrix. A primary weakness of conventional moving average systems is vulnerability to whipsaws, false breakouts, and erratic market noise during low-vo
Momentum KU v1.41 Technical Documentation and Operational Manual 1. Overview and Purpose Momentum KU v1.41 is an analytical technical indicator engineered natively for the MetaTrader 5 (MT5) platform. The primary objective of the software is to detect directional momentum transitions across financial assets and provide multi-layered signal validation through an integrated architecture of seventeen independent technical filter subsystems. Momentum KU executes as an on-chart visual utility, plott
NLMS Volatility Trail MultiFilter MT5 - Operational Manual & Technical Specification 1. Overview and Core Purpose NLMS Volatility Trail MultiFilter MT5 is an algorithmic market analysis indicator designed for MetaTrader 5, providing adaptive trend identification, dynamic trailing envelopes, and multi-layered signal filtering. The system is built upon digital signal processing theory, dynamic volatility channels, and a modular matrix of secondary filters. At its computational core operates the
================================================================================ PRO PARABOLIC RSI MULTIFILTER SIGNAL PREMIUM MT5 (OFFICIAL PRODUCT SPECIFICATION) ================================================================================ Pro Parabolic RSI MultiFilter Signal Premium MT5 is a professional-grade technical trading suite engineered for MetaTrader 5, combining high-precision Relative Strength Index (RSI) dynamics with the trailing acceleration mechanism of the Parabolic SAR (St
PARABOLIC RSI SCANNER DASHBOARD ALL PAIR TIMEFRAME - TECHNICAL MANUAL 1. OVERVIEW & SYSTEM ARCHITECTURE The Parabolic RSI Scanner Dashboard All Pair Timeframe is a multi-asset, multi-timeframe analytical utility developed for the MetaTrader 5 terminal. The software calculates a synthetic technical indicator by mapping J. Welles Wilder's Parabolic Stop and Reverse (SAR) tracking logic directly onto the Relative Strength Index (RSI) momentum data series. Rather than tracking price fluctuations,
MultiCandle Pattern Pro with Universal Filter Suite v2.0 is a professional technical analysis indicator engineered for MetaTrader 5 (MT5). The software automates the identification of sequential multi-candle price action formations across liquid financial markets, focusing specifically on 4-Candle (4C), 5-Candle (5C), and 6-Candle (6C) structures. Rather than depending on isolated single-candle setups that are vulnerable to erratic market noise, the system analyzes structured multi-bar sequence
Product: Pro RSI Signal Overbought Oversold Multi Filters MT5 Category: Technical Indicator / Oscillators & Momentum Platform: MetaTrader 5 Overview Pro RSI Signal Overbought Oversold Multi Filters is a technical momentum analysis indicator developed natively for the MetaTrader 5 platform. The tool reproduces and expands upon the standard TradingView Relative Strength Index architecture, providing an authentic analytical bridge between modern charting environments and the MetaTrader trading te
Overview The RSI Scanner Dashboard is a comprehensive technical analysis utility and multi-symbol, multi-timeframe monitoring indicator designed for the MetaTrader terminal. The primary objective of this tool is to scan market instruments continuously to identify specific Relative Strength Index (RSI) crossover conditions based on defined overbought and oversold thresholds. By aggregating data across user-defined currency pairs and timeframes into a single graphical user interface (GUI), this d
RVI Dual Mode with Universal Multi-Filter Framework for MetaTrader 5 Product Overview and Technical Scope RVI Dual Mode with Universal Multi-Filter Framework is a modular technical analysis indicator engineered specifically for MetaTrader 5. Built upon the volatility-adjusted momentum mathematics of Donald Dorsey's Relative Volatility Index (RVI), this analytical tool provides systematic directional signal generation while addressing whipsaws during consolidating markets. Rather than relying on
Overview RVI Scanner Dashboard Pro is a multi-symbol and multi-timeframe analytical utility engineered for MetaTrader. In financial markets, tracking multiple instruments across various timeframes simultaneously creates significant cognitive load. This dashboard solves this by aggregating decentralized market data into a cohesive Graphical User Interface (GUI). Its primary objective is to monitor continuous data feeds to detect momentum shifts and potential trend reversals based on the Relative
Senkou Span B Dynamic Rejection and Multi-Filter Confluence Framework for MetaTrader 5 Overview The Senkou Span B Dynamic Rejection Indicator is a modular technical analysis system designed for the MetaTrader 5 platform. It identifies institutional price interactions around the Senkou Span B equilibrium line of the Ichimoku Kinko Hyo model. Senkou Span B represents the 52-period midpoint value projected into the market structure, serving as a primary indicator of medium-to-long term support, r
1. Overview Stochastic Multi-Filter Suite is a specialized technical indicator engineered natively for the MetaTrader 5 (MT5) trading platform. The software integrates George Lane's classical Stochastic Oscillator engine with a modular 14-filter algorithmic confirmation framework designated as the MultiFilter Suite. Developed specifically for systematic technical analysts, multi-asset discretionary traders, and quantitative chartists, the indicator transforms standard momentum oscillators into
Pro Traders Dynamic Index TDI rsi BB Signal Filter - Technical Specification and User Manual 1. Product Overview and Structural Architecture Pro Traders Dynamic Index TDI rsi BB Signal Filter is a multi-layered technical analysis indicator developed natively for the MetaTrader 5 trading platform. The architecture integrates the mathematical models of the classic Traders Dynamic Index (TDI), an adaptive dual-speed Relative Strength Index (RSI) dynamic line engine, baseline volatility envelope ch
Filtrele:
Değerlendirme yok
Değerlendirmeye yanıt