UT Bot Scanner Dashboard Filter All Pair Timeframe

1. Overview

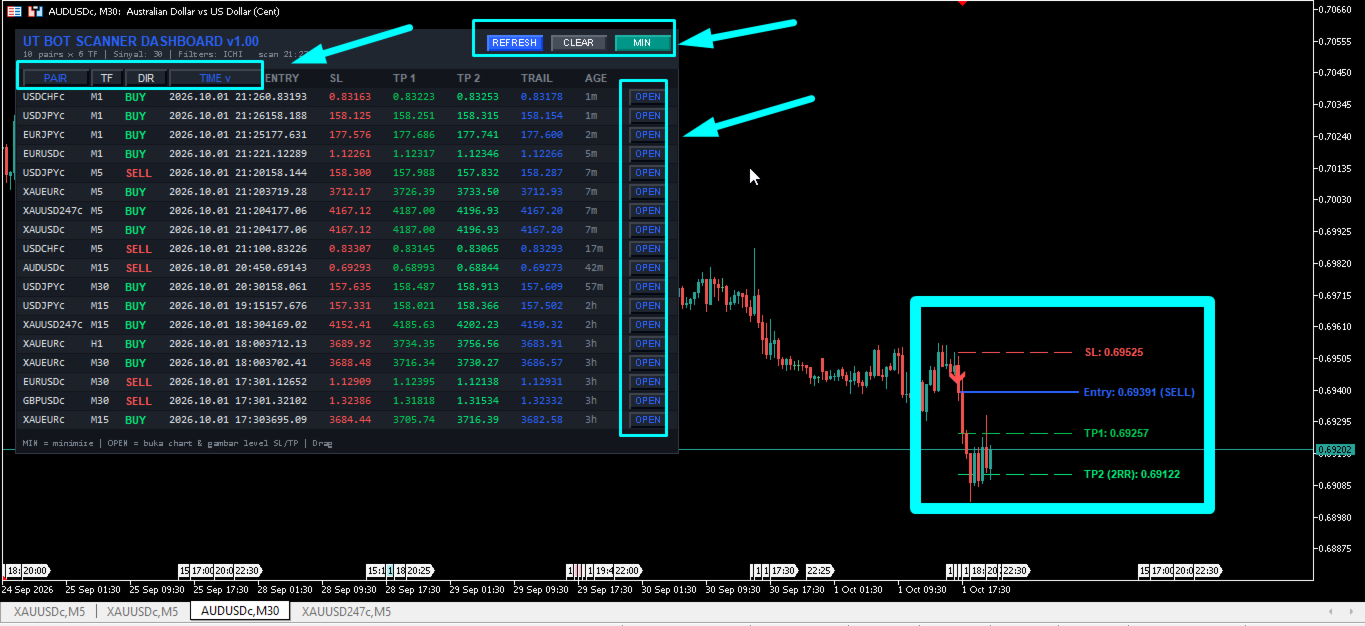
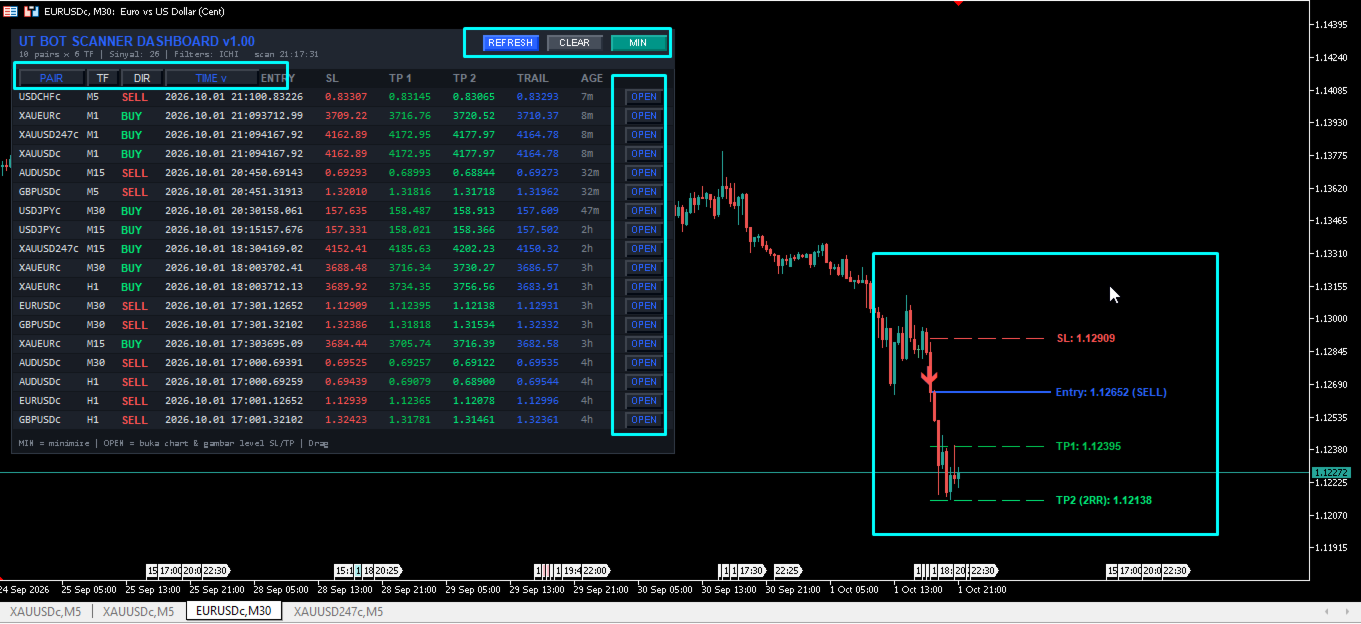
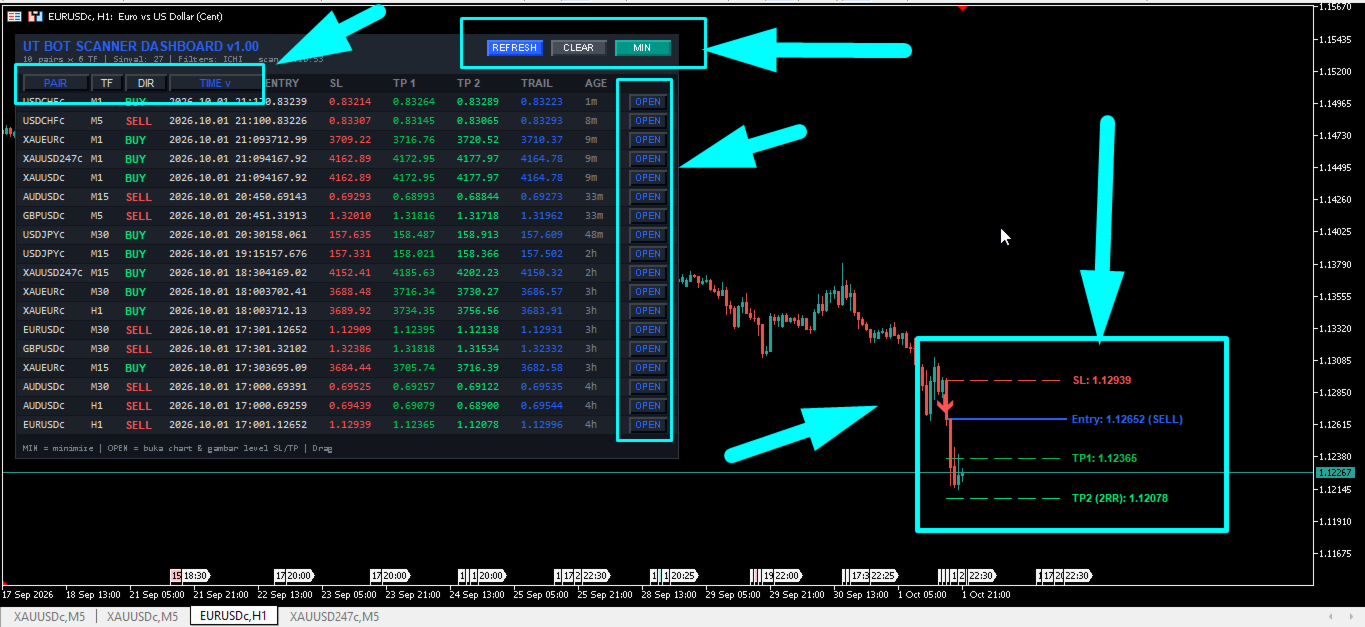
The UT Bot Scanner Dashboard is a multi-pair and multi-timeframe technical analysis scanner indicator developed for MetaTrader 5 (MT5). It is designed to assist traders in identifying price trend shifts and directional momentum setups across multiple financial instruments and timeframes simultaneously. The underlying engine utilizes the UT Bot trailing stop algorithm combined with a set of 17 optional confluence filters, dynamic Stop Loss (SL) distance calculations based on Average True Range (ATR), and Risk-to-Reward (RR) ratio Take Profit (TP) target projections. The software renders an interactive Graphical User Interface (GUI) panel on the active chart, displaying active signal parameters, bar age, entry price levels, SL/TP estimates, and interactive navigation controls to switch chart symbols effortlessly.


2. Technical Operating Principle and Signal Logic

2.1 Base Algorithmic Logic

The scanner evaluates market volatility using Average True Range (ATR) values to compute a dynamic trailing stop line. The sensitivity of the trailing stop is governed by a Key Value multiplier. For each bar, the algorithm calculates a position loss buffer defined as:

Loss Buffer = Key Value * ATR Value

The trailing stop line dynamically adjusts based on price direction:

- In an upward trend, the trailing stop is calculated as the maximum of the previous trailing level and the current bar close price minus the Loss Buffer.

- In a downward trend, the trailing stop is calculated as the minimum of the previous trailing level and the current bar close price plus the Loss Buffer.


2.2 Signal State Machine and Repaint Characteristics

Signal evaluation is conducted strictly on completed candles (Bar 1). The dynamic price activity on the active open candle (Bar 0) is excluded from signal state confirmation to eliminate false signals and structural changes after bar completion.

- Repaint Status: 100% Non-Repainting. Sinyal triggers are evaluated once a candle officially closes. Once confirmed at Bar 1 close, signal markers, table entries, and alert triggers remain permanently fixed on historical charts.


2.3 Entry Logic Requirements

A BUY signal condition is met on Bar 1 when:

1. The close price of the previous bar was below the trailing stop line, AND the close price of Bar 1 rises strictly above the trailing stop line (Bullish Breakout Crossover).

2. All active technical filter requirements enabled in the indicator parameters return a TRUE boolean condition for bullish alignment.


A SELL signal condition is met on Bar 1 when:

1. The close price of the previous bar was above the trailing stop line, AND the close price of Bar 1 falls strictly below the trailing stop line (Bearish Breakout Crossover).

2. All active technical filter requirements enabled in the indicator parameters return a TRUE boolean condition for bearish alignment.


2.4 Mechanics of Technical Confluence Filters

The scanner incorporates 17 distinct visual and quantitative filter modules that can be activated individually or in combination:

- Ichimoku Senkou Span B Filter: Validates macro trend direction. BUY requires close price above Senkou Span B; SELL requires close price below Senkou Span B.

- RSI Cross Filter: Identifies momentum turns from extreme zones. BUY requires RSI crossing above the oversold boundary (e.g., 30); SELL requires RSI crossing below the overbought boundary (e.g., 70).

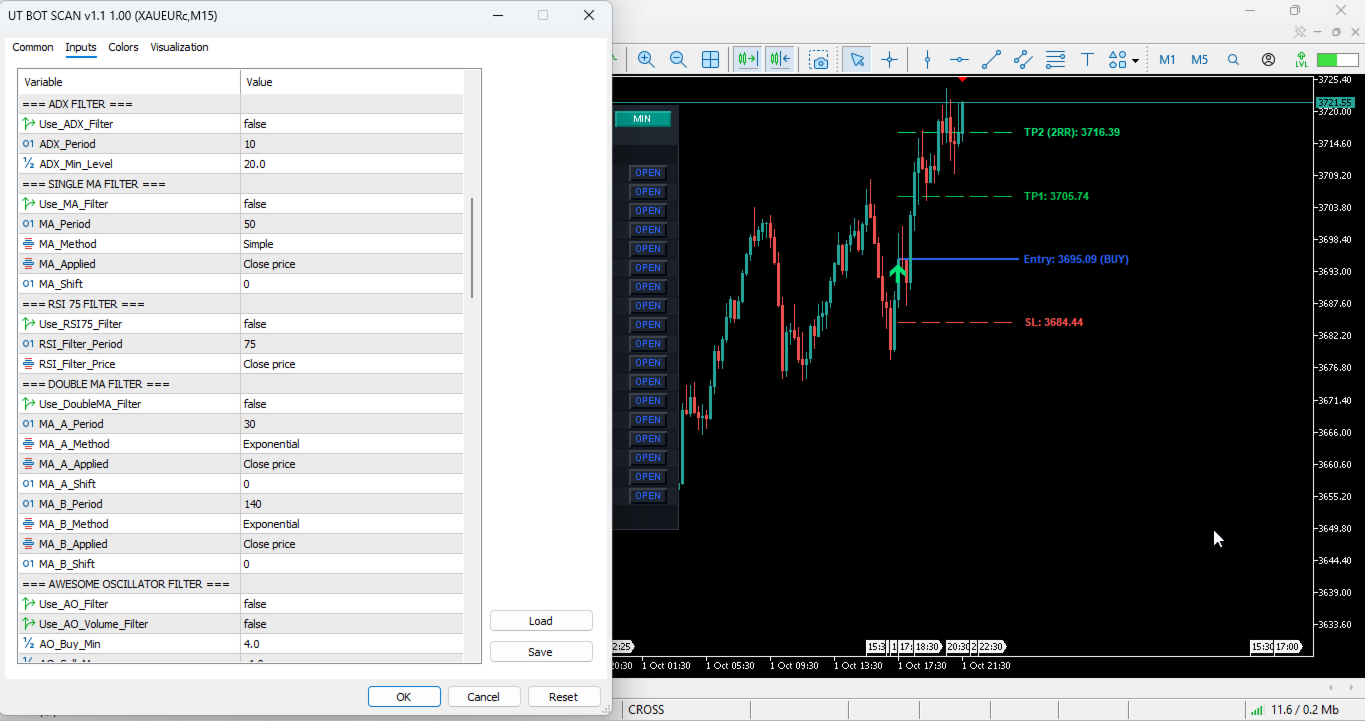
- ADX Filter: Measures directional trend strength. Validates signals only when the ADX main line exceeds the configured minimum threshold level (e.g., 20.0).

- Single Moving Average (MA) Filter: Filters trades according to baseline trend direction. BUY requires close price above the MA; SELL requires close price below the MA.

- RSI 75 Filter: Evaluates long-term Relative Strength Index values. BUY requires RSI(75) above 50.0; SELL requires RSI(75) below 50.0.

- Double Moving Average Filter: Uses fast and slow MA alignment. BUY requires Fast MA above Slow MA; SELL requires Fast MA below Slow MA.

- Awesome Oscillator (AO) Filter: Assesses market momentum. Supports volume thresholds, histogram color changes, and zero-line cross validation.

- Parabolic SAR Filter: Confirms parabolic trend alignment. BUY requires close price above the SAR point; SELL requires close price below the SAR point.

- Heiken Ashi Filter: Confirms candle body momentum. BUY requires Heiken Ashi close to be greater than Heiken Ashi open; SELL requires Heiken Ashi close to be less than Heiken Ashi open.

- CCI Trend Filter: Evaluates Commodity Channel Index direction relative to the zero baseline. BUY requires CCI > 0; SELL requires CCI < 0.

- CCI Overbought/Oversold Filter: Identifies deep cyclical extremes. BUY requires CCI exceeding the overbought threshold; SELL requires CCI dropping below the oversold threshold.

- RVI Trend Filter: Evaluates Relative Vigor Index main line direction relative to zero baseline. BUY requires RVI > 0; SELL requires RVI < 0.

- RVI Signal Filter: Identifies signal line crossovers. BUY requires RVI main line above signal line; SELL requires RVI main line below signal line.

- MACD Signal Filter: Identifies histogram momentum. BUY requires MACD main line above signal line; SELL requires MACD main line below signal line.

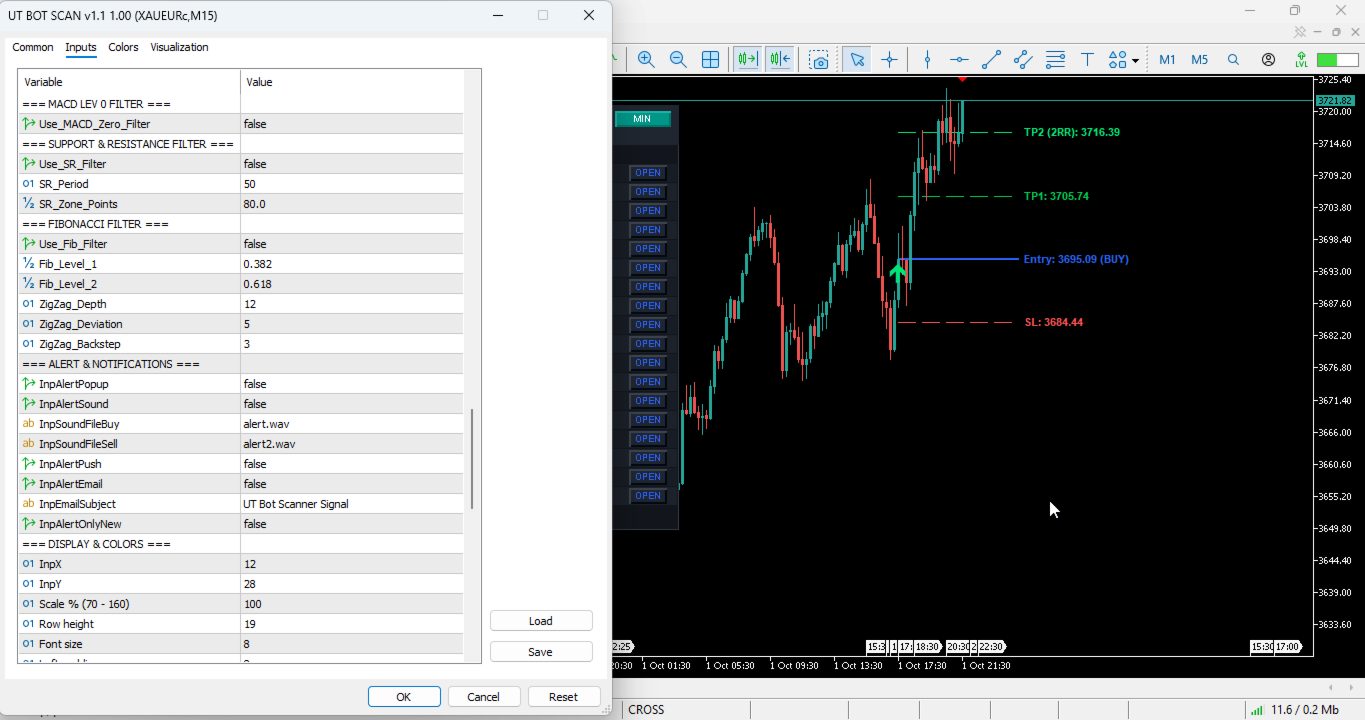
- MACD Zero Filter: Evaluates MACD baseline orientation. BUY requires MACD main line above 0; SELL requires MACD main line below 0.

- Support & Resistance (S/R) Zone Filter: Scans recent high/low swing levels over a lookback period. BUY requires price to test support zone boundaries; SELL requires price to test resistance zone boundaries.

- Fibonacci Retracement Filter: Uses automated Swing High and Swing Low calculations via ZigZag mechanics. Validates signals when price interacts with configured Fibonacci golden ratio zones (e.g., 38.2% to 61.8%).


3. Key Features and Graphical Interface

- Multi-Pair Scanning Engine: Simultaneously processes up to 10 market instruments selected from Market Watch or customized input strings.

- Multi-Timeframe Matrix: Scans across up to 6 timeframes (M1, M5, M15, M30, H1, H4, D1, W1, MN1) in a single integrated view.

- Automated SL/TP Calculation: Generates ATR-based Stop Loss distances alongside Risk-to-Reward ratio targets (TP1 at 1:1 RR, TP2 at 1:2 RR).

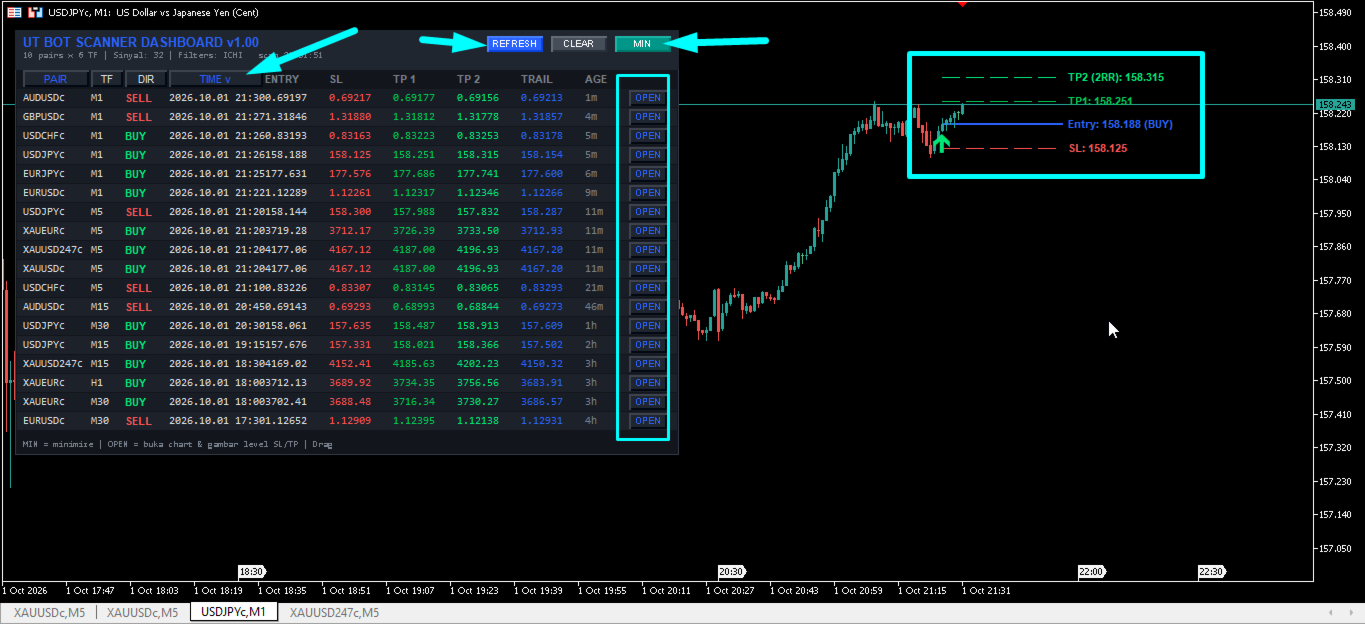
- Interactive Dashboard Panel: Features real-time sorting by Signal Time, Pair Name, Timeframe, or Direction. Displays signal entry price, SL, TP1, TP2, trailing stop value, signal age, and chart navigation buttons.

- Quick Chart Switcher: Clicking the "OPEN" button next to any signal updates the main chart to that instrument and timeframe instantly, rendering technical levels on chart.

- On-Chart Level Visualizer: Draws colored trendlines and label annotations for Entry, Stop Loss, TP1, and TP2, alongside custom arrow signal markers.

- Comprehensive Notification System: Provides pop-up terminal alerts, custom audio alerts, push notifications to mobile devices, and SMTP email alerts.


4. Operation Recommendations and Technical Setup

- Asset Class Compatibility: Applicable to Forex pairs, Commodities (XAUUSD, WTI), Equity Indices, and Cryptocurrencies. Test spread tolerances before live deployment.

- Timeframe Recommendations: Compatible with all timeframe periods (M1 through MN1). Scalping setups perform efficiently on M5 and M15; Day Trading setups align with M30 and H1; Swing setups perform on H4 and D1.

- Terminal & Host Hardware Requirements: To optimize CPU usage during multi-pair scanning, utilize the built-in handle caching mechanism and set InpBarsCopy to 100 bars. A Virtual Private Server (VPS) with low latency is recommended for continuous background scanning and mobile push notification delivery.

- Broker Account Configuration: Compatible with ECN, STP, Low Spread, Hedging, and Netting trading account configurations on MT5 terminals.


5. Input Parameters Documentation


5.1 Scanner Settings

- InpSymbols (Default: "EURUSD,GBPUSD,USDJPY,AUDUSD,USDCAD,USDCHF,NZDUSD,EURJPY,GBPJPY,XAUUSD") -> Comma-separated list of instrument symbols to scan.

- InpTimeframes (Default: "M1,M5,M15,M30,H1,H4") -> Comma-separated list of timeframe periods to scan.

- InpUseWatch (Default: true) -> Enables scanning of all active pairs present in Market Watch window.

- InpMaxSymbols (Default: 10) -> Maximum number of market symbols to analyze simultaneously (Integer).

- InpScanSec (Default: 7) -> Background timer interval for full scanner execution pass (Seconds).

- InpBarsCopy (Default: 100) -> Number of historical bars retrieved per symbol/timeframe for indicator buffer calculations (Bars).

- InpLookback (Default: 100) -> Maximum historical bar depth evaluated when searching for active signals (Bars).

- InpDirection (Default: 0) -> Directional signal filter (0 = Scan Both BUY & SELL, 1 = Scan BUY Only, 2 = Scan SELL Only).


5.2 UT Bot Entry Settings

- InpKeyValue (Default: 1.0) -> Trailing stop sensitivity factor multiplying the ATR value (Double).

- InpATRPeriod (Default: 1) -> Averaging period used to compute ATR for UT Bot trailing stop calculation (Bars).


5.3 ATR SL & TP Settings

- InpSLTP_ATRPeriod (Default: 14) -> Averaging period of ATR used for dynamic Stop Loss distance calculation (Bars).

- InpATRMultSL (Default: 1.5) -> Stop Loss distance multiplier applied to calculated ATR value (Multiplier).

- InpTP1_RR (Default: 1.0) -> Risk-to-Reward multiplier for Take Profit Target 1 (e.g., 1.0 = 1:1 RR).

- InpTP2_RR (Default: 2.0) -> Risk-to-Reward multiplier for Take Profit Target 2 (e.g., 2.0 = 1:2 RR).


5.4 Filter Mode Settings


Ichimoku Senkou Span B Filter:

- UseSenkouFilter (Default: true) -> Enables or disables Ichimoku Senkou Span B trend filter (Boolean).

- IchimokuTenkan (Default: 9) -> Calculation period for Tenkan-sen conversion line (Bars).

- IchimokuKijun (Default: 26) -> Calculation period for Kijun-sen base line (Bars).

- IchimokuSenkou (Default: 52) -> Calculation period for Senkou Span B leading line (Bars).

- IchimokuDisplacement (Default: 26) -> Cloud forward displacement offset parameter (Bars).


RSI Cross Filter:

- Use_RSI_Cross_Filter (Default: false) -> Enables or disables RSI oversold/overbought boundary crossover filter (Boolean).

- RSI_Length (Default: 14) -> Calculation period for RSI indicator line (Bars).

- RSI_Price_Source (Default: PRICE_CLOSE) -> Applied price constant used for RSI calculation.

- Oversold (Default: 30.0) -> Lower threshold boundary level for RSI oversold crossover signal (Index value).

- Overbought (Default: 70.0) -> Upper threshold boundary level for RSI overbought crossover signal (Index value).


ADX Filter:

- Use_ADX_Filter (Default: false) -> Enables or disables Average Directional Index trend strength filter (Boolean).

- ADX_Period (Default: 10) -> Calculation period for ADX main line (Bars).

- ADX_Min_Level (Default: 20.0) -> Minimum required ADX threshold value to validate trend presence (Index value).


Single MA Filter:

- Use_MA_Filter (Default: false) -> Enables or disables Single Moving Average direction filter (Boolean).

- MA_Period (Default: 50) -> Averaging period for baseline Moving Average (Bars).

- MA_Method (Default: MODE_SMA) -> Smoothing method applied to Moving Average calculation.

- MA_Applied (Default: PRICE_CLOSE) -> Applied price data source used in Moving Average calculation.

- MA_Shift (Default: 0) -> Horizontal offset shift applied to Moving Average line (Bars).


RSI 75 Filter:

- Use_RSI75_Filter (Default: false) -> Enables or disables long-term RSI 75 baseline filter (Boolean).

- RSI_Filter_Period (Default: 75) -> Calculation period for long-term RSI indicator (Bars).

- RSI_Filter_Price (Default: PRICE_CLOSE) -> Applied price data source used in RSI 75 calculation.


Double MA Filter:

- Use_DoubleMA_Filter (Default: false) -> Enables or disables Fast/Slow Double Moving Average crossover alignment filter (Boolean).

- MA_A_Period (Default: 30) -> Averaging period for Fast Moving Average line A (Bars).

- MA_A_Method (Default: MODE_EMA) -> Smoothing method applied to Moving Average line A.

- MA_A_Applied (Default: PRICE_CLOSE) -> Applied price data source for Moving Average line A.

- MA_A_Shift (Default: 0) -> Horizontal offset shift for Moving Average line A (Bars).

- MA_B_Period (Default: 140) -> Averaging period for Slow Moving Average line B (Bars).

- MA_B_Method (Default: MODE_EMA) -> Smoothing method applied to Moving Average line B.

- MA_B_Applied (Default: PRICE_CLOSE) -> Applied price data source for Moving Average line B.

- MA_B_Shift (Default: 0) -> Horizontal offset shift for Moving Average line B (Bars).


Awesome Oscillator Filter:

- Use_AO_Filter (Default: false) -> Enables or disables Awesome Oscillator momentum filter (Boolean).

- Use_AO_Volume_Filter (Default: false) -> Enables minimum volume strength boundary check on AO values (Boolean).

- AO_Buy_Min (Default: 4.0) -> Minimum positive AO threshold value required for BUY signal validation (Points value).

- AO_Sell_Max (Default: -4.0) -> Maximum negative AO threshold value required for SELL signal validation (Points value).

- Use_AO_Color_Filter (Default: false) -> Enables validation based on AO histogram bar color direction (Boolean).

- Use_AO_Zero_Filter (Default: false) -> Enables validation based on AO placement relative to zero baseline (Boolean).


Parabolic SAR Filter:

- Use_SAR_Filter (Default: false) -> Enables or disables Parabolic SAR trend alignment filter (Boolean).

- SAR_Step (Default: 0.02) -> Price step increment factor for Parabolic SAR calculation (Factor).

- SAR_Maximum (Default: 0.2) -> Maximum acceleration factor cap for Parabolic SAR calculation (Factor).


Heiken Ashi Filter:

- Use_HeikenAshi_Filter (Default: false) -> Enables or disables Heiken Ashi candle body color trend filter (Boolean).


CCI Trend Filter:

- Use_CCI_Filter (Default: false) -> Enables or disables Commodity Channel Index baseline trend filter (Boolean).

- CCI_Period (Default: 50) -> Calculation period for CCI trend indicator line (Bars).

- CCI_Applied (Default: PRICE_CLOSE) -> Applied price data source used in CCI calculation.


CCI OB & OS Filter:

- Use_CCI_OBOS_Filter (Default: false) -> Enables or disables CCI overbought/oversold extreme level filter (Boolean).

- CCI_OBOS_Period (Default: 14) -> Calculation period for CCI OB/OS indicator (Bars).

- CCI_OBOS_Applied (Default: PRICE_CLOSE) -> Applied price data source used in CCI OB/OS calculation.

- CCI_Overbought (Default: 100.0) -> Upper boundary threshold required for BUY signal validation (Index value).

- CCI_Oversold (Default: -100.0) -> Lower boundary threshold required for SELL signal validation (Index value).


RVI Trend Filter:

- Use_RVI_Filter (Default: false) -> Enables or disables Relative Vigor Index baseline trend filter (Boolean).

- RVI_Period (Default: 75) -> Calculation period for RVI main line (Bars).


RVI Signal Filter:

- Use_RVI_Signal_Filter (Default: false) -> Enables or disables RVI main line and signal line crossover filter (Boolean).

- RVI_Signal_Period (Default: 20) -> Calculation period for RVI signal line (Bars).


MACD Signal Filter:

- Use_MACD_Filter (Default: false) -> Enables or disables MACD main line and signal line crossover filter (Boolean).

- MACD_FastEMA (Default: 12) -> Fast Exponential Moving Average period for MACD calculation (Bars).

- MACD_SlowEMA (Default: 26) -> Slow Exponential Moving Average period for MACD calculation (Bars).

- MACD_SignalSMA (Default: 9) -> Signal line Simple Moving Average period for MACD calculation (Bars).

- MACD_Applied (Default: PRICE_CLOSE) -> Applied price data source used in MACD calculation.


MACD Lev 0 Filter:

- Use_MACD_Zero_Filter (Default: false) -> Enables or disables MACD zero line orientation filter (Boolean).


Support & Resistance Filter:

- Use_SR_Filter (Default: false) -> Enables or disables price level interaction filter with recent S/R zones (Boolean).

- SR_Period (Default: 50) -> Historical lookback period analyzed to establish highest high and lowest low levels (Bars).

- SR_Zone_Points (Default: 80) -> Proximity tolerance zone around support/resistance levels (Points).


Fibonacci Filter:

- Use_Fib_Filter (Default: false) -> Enables or disables Fibonacci retracement zone interaction filter (Boolean).

- Fib_Level_1 (Default: 0.382) -> Primary Fibonacci retracement level ratio boundary (e.g., 0.382 = 38.2%).

- Fib_Level_2 (Default: 0.618) -> Secondary Fibonacci retracement level ratio boundary (e.g., 0.618 = 61.8%).

- ZigZag_Depth (Default: 12) -> Depth parameter controlling swing point detection for Fibonacci anchor placement (Bars).

- ZigZag_Deviation (Default: 5) -> Minimum price change threshold required to establish new swing leg (Points).

- ZigZag_Backstep (Default: 3) -> Minimum bar step back requirement between swing pivots (Bars).


5.5 Alert & Notifications Settings

- InpAlertPopup (Default: false) -> Enables pop-up dialog notifications inside terminal on signal detection (Boolean).

- InpAlertSound (Default: false) -> Enables audio alert playback upon new signal confirmation (Boolean).

- InpSoundFileBuy (Default: "alert.wav") -> Audio file name played when a BUY signal occurs (Filename string).

- InpSoundFileSell (Default: "alert2.wav") -> Audio file name played when a SELL signal occurs (Filename string).

- InpAlertPush (Default: false) -> Sends instant push notifications to registered MetaQuotes ID mobile app (Boolean).

- InpAlertEmail (Default: false) -> Transmits signal summary report emails via configured terminal SMTP server (Boolean).

- InpEmailSubject (Default: "UT Bot Scanner Signal") -> Text subject line attached to outbound email reports (String).

- InpAlertOnlyNew (Default: false) -> Restricts alerts to trigger strictly once per newly confirmed bar signal (Boolean).


5.6 UI & Display Settings

- InpX (Default: 12) -> X-axis coordinate offset positioning the dashboard panel from top-left corner (Pixels).

- InpY (Default: 28) -> Y-axis coordinate offset positioning the dashboard panel from top-left corner (Pixels).

- InpScale (Default: 100) -> Global scaling ratio controlling dashboard UI element sizes (Range: 70% to 180%).

- InpRowH (Default: 19) -> Height of individual data table rows within dashboard panel (Pixels).

- InpFont (Default: 8) -> Base font size used for text labels inside table cells (Points).

- InpPadX (Default: 8) -> Horizontal internal padding inside dashboard frame (Pixels).

- InpWPair (Default: 68) -> Column width reserved for symbol pair names (Pixels).

- InpWTF (Default: 34) -> Column width reserved for timeframe labels (Pixels).

- InpWArah (Default: 44) -> Column width reserved for direction indicators (Pixels).

- InpWTime (Default: 96) -> Column width reserved for signal timestamp display (Pixels).

- InpWEntry (Default: 64) -> Column width reserved for entry price values (Pixels).

- InpWSL (Default: 64) -> Column width reserved for Stop Loss values (Pixels).

- InpWTP1 (Default: 64) -> Column width reserved for Take Profit Target 1 values (Pixels).

- InpWTP2 (Default: 64) -> Column width reserved for Take Profit Target 2 values (Pixels).

- InpWTrail (Default: 64) -> Column width reserved for trailing stop values (Pixels).

- InpWUmur (Default: 42) -> Column width reserved for signal age metrics (Pixels).

- InpWOpen (Default: 44) -> Column width reserved for interactive chart opening buttons (Pixels).

- InpShowEmpty (Default: false) -> Toggles display of symbol/timeframe rows containing no active signal (Boolean).

- InpMaxRows (Default: 18) -> Maximum number of visible data rows displayed simultaneously on dashboard (Integer).

- InpSortBy (Default: SORT_TIME) -> Initial table sorting criteria (0 = Time, 1 = Pair, 2 = Timeframe, 3 = Direction).

- InpSortNewest (Default: true) -> Enables descending sorting order (newest signals or highest priority listed first).


5.7 On-Chart Visuals & Color Settings

- InpDrawOnChart (Default: true) -> Enables drawing of visual entry, SL, and TP lines on active chart window (Boolean).

- InpShowArrow (Default: true) -> Enables rendering of BUY/SELL arrow markers on active chart window (Boolean).

- InpShowLevels (Default: true) -> Enables drawing of price level trendlines and label annotations (Boolean).

- InpExtendBars (Default: 30) -> Horizontal ray extension length for on-chart level lines beyond signal candle (Bars).

- InpArrowCodeBuy (Default: 233) -> Wingdings character code used for rendering BUY signal arrows (Character code).

- InpArrowCodeSell (Default: 234) -> Wingdings character code used for rendering SELL signal arrows (Character code).

- InpArrowSize (Default: 2) -> Visual thickness size setting applied to drawn arrow markers (Integer scale).

- InpArrowDistance (Default: 15) -> Vertical offset spacing between candle high/low and drawn arrow marker (Points).

- InpColBg (Default: C'18,22,28') -> Background color of main dashboard panel frame.

- InpColHead (Default: C'32,38,48') -> Background color of dashboard header bar and interactive buttons.

- InpColRow (Default: C'24,28,36') -> Primary background color for even table rows.

- InpColRow2 (Default: C'28,33,42') -> Secondary background color for odd table rows.

- InpColText (Default: C'220,225,230') -> Default text font color used for regular table information.

- InpColBull (Default: C'0,230,118') -> Primary accent color representing bullish BUY signals and positive status.

- InpColBear (Default: C'255,82,82') -> Primary accent color representing bearish SELL signals and warning status.

- InpColMute (Default: C'120,128,140') -> Subtle text color applied to inactive labels, headers, and secondary metrics.

- InpColAccent (Default: C'41,98,255') -> Primary interface highlight color used for active titles and control elements.

- InpColEntry (Default: C'41,98,255') -> Color applied to on-chart entry price trendlines and text labels.

- InpColSL (Default: C'255,82,82') -> Color applied to on-chart Stop Loss price trendlines and text labels.

- InpColTP1 (Default: C'0,200,83') -> Color applied to on-chart Take Profit Target 1 trendlines and text labels.

- InpColTP2 (Default: C'0,230,118') -> Color applied to on-chart Take Profit Target 2 trendlines and text labels.


6. Risk Disclaimer

Trading foreign exchange, commodities, indices, and derivative financial instruments carries a high level of risk and may not be suitable for all investors. Potential investors must carefully evaluate their financial status, investment experience, and risk tolerance prior to engaging in live market trading. Historical performance, automated signal metrics, backtest calculations, and visual analytical setups generated by technical indicators do not guarantee future financial results. This software product operates exclusively as a technical analysis dashboard and visual execution utility designed to assist traders in market monitoring; it does not constitute financial, legal, or investment advice. Users are strongly advised to test the indicator functionality thoroughly on demo simulated trading accounts before deploying the software on real capital accounts.
추천 제품
숫자 시퀀스 중 하나를 "산불 시퀀스"라고 합니다. 가장 아름다운 새로운 시퀀스 중 하나로 인식되었습니다. 주요 특징은 이 시퀀스가 ​​가장 짧은 경우에도 선형 추세를 피한다는 것입니다. 이 지표의 기초를 형성한 것은 이 속성입니다. 금융 시계열을 분석할 때 이 지표는 가능한 모든 추세 옵션을 거부하려고 합니다. 그리고 그가 실패하는 경우에만 그는 추세의 존재를 인식하고 적절한 신호를 제공합니다. 이 접근 방식을 통해 새로운 트렌드가 시작되는 순간을 정확하게 결정할 수 있습니다. 그러나 거짓 긍정도 가능합니다. 숫자를 줄이기 위해 이 표시기에 추가 필터가 추가되었습니다. 새 막대가 열리면 신호가 생성됩니다. 어떤 경우에도 다시 그리기가 발생하지 않습니다. 표시 매개변수: Applied Price   - 적용된 가격 상수. Period Main   - 표시기의 기본 기간, 유효한 값은 5 - 60 이내입니다. Period Additional   - 추가 기간, 이 매개변수의 유효한
RBreaker
Zhong Long Wu
RBreaker Gold Indicators는 금 선물을 위한 단기 데이 트레이딩 전략으로, 추세 추종과 데이 내 반전의 두 가지 거래 방식을 결합합니다. 추세 장에서 수익을 포착할 수 있을 뿐만 아니라, 시장이 반전될 때 적시에 이익을 확정하고 추세에 맞춰 반대 포지션을 잡을 수 있습니다. 이 전략은 미국 잡지 Futures Truth에서 15년 연속으로 가장 수익성 높은 트레이딩 전략 상위 10위 안에 선정되었습니다. 긴 라이프사이클을 자랑하며, 현재까지 국내외에서 널리 사용되고 연구되고 있습니다. 본 지표는 2026년 금 선물의 움직임을 반영하여 14일 ATR 지표를 기반으로 돌파 계수 A, 관찰 계수 B, 반전 계수 R을 보다 합리적인 값으로 정의했습니다. 매우 훌륭한 지표이며, 안정적인 연간 수익성을 달성했습니다. 강력히 추천합니다~ 위 지표는 변동성이 높은 상품에 적합하며, 매개변수는 금 선물, 주가 지수 선물 등에 적합합니다. 다른 상품이 필요한 경우 돌파 계수 A
Passband Filter Pro Passband Filter Pro is a trend and cycle oscillator for MetaTrader 5. It is built on the Ehlers Super Passband Filter, a band pass filter that removes long term trend drift and short term noise so that only the dominant market cycle remains. The result is a clean oscillator with a color cloud that shows overbought and oversold conditions, cycle turns, and momentum on forex, gold, indices, stocks and crypto. Most traders enter too early or too late. Simple moving averages la
DAILY OH/OL SDEV QUANT MODEL - STATISTICAL TRADING WITH PRECISION RISK MANAGEMENT TRADE WITH MATHEMATICAL CERTAINTY - KNOW YOUR EXACT STOP-LOSS AND TAKE-PROFIT BEFORE YOU ENTER This indicator analyzes 5,000+ days of price history to give you: Exact entry levels (sigma bands locked at daily open) Exact stop-loss distance (from M
Noize Absorption Index
Ekaterina Saltykova
Noize Absorption Index - is the manual trading system that measures the difference of pressure between bears forces and bulls forces. Green line - is a noize free index that showing curent situation. Zero value of index shows totally choppy/flat market.Values above zero level shows how powerfull bullish wave is and values below zero measures bearish forces.Up arrow appears on bearish market when it's ready to reverse, dn arrow appears on weak bullish market, as a result of reverse expectation.
HMA Trend Professional MT5
Pavel Zamoshnikov
4.25 (4)
Improved version of the free HMA Trend indicator (for MetaTrader 4) with statistical analysis. HMA Trend is a trend indicator based on the Hull Moving Average (HMA) with two periods. HMA with a slow period identifies the trend, while HMA with a fast period determines the short-term movements and signals in the trend direction. The main differences from the free version: Ability to predict the probability of a trend reversal using analysis of history data. Plotting statistical charts for analyzi
TRI Visualizer
Yoshimi Mon 三 Ura
TRI Visualizer MT5 – Thermodynamic Market Analysis Overview The TRI (Thermal Range Indicator) Visualizer Enhanced is a rare market analysis indicator that goes beyond conventional technical analysis, applying principles of thermodynamics from physics. It interprets market price fluctuations as “thermodynamic energy,” enabling the highly accurate detection of subtle market changes that are often overlooked. Innovative Mechanisms 1. Dual Calculation Engines Classic TRI Mode Formula: |Close
Be notified of every color change of Heiken Ashi (HA) candles. The indicator will trigger past and new signals every time that HA candles change their colors. ( Note : this tool is based on the code of Heiken Ashi indicator developed by MetaQuotes Software Corp.) Features The signals are triggered at closing of last bar/opening of a new bar; Any kind of alerts can be enabled: Dialog Box, Email message, SMS notifications for smartphones and tablets, and Sound alerts; By default, up arrows are pl
Riko Trend mt5
Nadiya Mirosh
The Riko Trend indicator is a revolutionary trend trading and filtering solution with all the important features of a trend tool built into one tool! The Riko Trend indicator is good for any trader, suitable for any trader for both forex and binary options. You don’t need to configure anything, everything is perfected by time and experience, it works great during a flat and in a trend. The Riko Trend indicator is a technical analysis tool for financial markets that reflects the current price f
Structure King AI Signal
Shingala Gautamkumar
Structure King AI Signal Structure King AI Signal is a professional MetaTrader 5 trading indicator designed to help traders analyze market structure, trend direction, multi-timeframe confirmation and trade management from one clean dashboard. Key Features • Market Structure & Trend Analysis • BUY / SELL Signals • Multi-Timeframe (HTF) Confirmation • Entry Price Levels • Dynamic Stop Loss (SL) • TP1 / TP2 / TP3 Levels • ATR Volatility Analysis • ADX Trend Strength Filter • Adaptive Market Filter
Heiken Ashi Smoothed Strategy is a very simple but powerful system to get forex market trend direction. This indicator is actually 2 indicators in 1 pack, Heiken Ashi and Heiken Ashi Smoothed Moving Average both included. Because HA (Heiken Ashi) and HAS (Heiken Ashi Smoothed) are calculated in the same one system event with necessary buffers and loop only, so it is the FAST, OPTIMIZED and EFFICIENT HA having the combined indicator of MetaTrader 5. You can choose to display HA and HAS in the sam
C88 Projected Candle See the Bigger Picture Before the Candle Closes C88 Projected Candle is a professional market visualization indicator that projects the current higher timeframe candle directly onto your active chart. It helps traders understand the evolving market structure without constantly switching between timeframes. Whether you trade Price Action, ICT, Smart Money Concepts (SMC), or Volume Profile, this indicator provides a cleaner and more intuitive way to read market context. Key Fe
Crash 1000 Scalping Indicator for the Crash 1000 Deriv Synthetic Index. Introduction The Crash 1000 Scalping Indicator is a specialized tool designed for the Crash 1000 index on the Deriv Synthetic market. This indicator is particularly useful for scalping on the M1 timeframe, helping traders to identify precise entry and exit points for buy positions. It is designed to be non-repainting, providing clear signals with audible alerts and push notifications, and is compatible with mobile devices th
MT5용 Crypto_Forex 지표 PINBAR 패턴, 재도색 및 지연 없음. - "PINBAR 패턴" 지표는 가격 변동 거래에 매우 강력한 지표입니다. - 이 지표는 차트에서 다음과 같은 핀바를 감지합니다. - 상승 핀바 - 차트에 파란색 화살표 신호(그림 참조). - 하락 핀바 - 차트에 빨간색 화살표 신호(그림 참조). -   PC 및 모바일 알림 기능 포함. - "PINBAR 패턴" 지표는 지지/저항 레벨과 결합하기 매우 좋습니다. ................................................................................ 여기를 클릭하여 고품질 트레이딩 로봇과 지표를 확인하세요! MQL5 웹사이트에서만 제공되는 오리지널 상품입니다.
US30NinjaMT5
Satyaseelan Shankarananda Moodley
US30 Ninja is a 5 minute scalping indicator that will let know you when there is a trade set up (buy or sell). Once the indicator gives the trade direction, you can open a trade and use a 30 pip stop loss and a 30 pip to 50 pip take profit. Please trade at own own risk. This indicator has been created solely for the US30 market and may not yield positive results on any other pair. 
Antique Trend
Nadiya Mirosh
The Antique Trend Indicator is a revolutionary trend trading and filtering solution with all the important features of a trend tool built into one tool! The Antique Trend indicator is good for any trader, suitable for any trader both for Forex and binary options. There is no need to configure anything, everything has been perfected by time and experience, it works great during flats and trends. The Antique Trend indicator is a tool for technical analysis of financial markets, reflecting curren
Dynasty SMC/ICT Terminal — v3.0 "Neon-Ops Edition" An all-in-one Smart Money Concepts / ICT dashboard for MetaTrader 5. It's an indicator, not an auto-trading EA — it never places, modifies, or closes real orders. It scans price action for Order Blocks, Fair Value Gaps, market structure, harmonic patterns, and multi-timeframe momentum, blends everything into one calibratable Master Signal, and — if enabled — builds a fully automated on-chart trade plan with entry, stop loss, three take-profit ta
Premium level Pro
Dmitriy Kashevich
Premium level is a unique indicator with more than 80% accuracy of correct predictions! This indicator has been tested for more than two months by the best Trading Specialists! The author's indicator you will not find anywhere else! From the screenshots you can see for yourself the accuracy of this tool! 1 is great for trading binary options with an expiration time of 1 candle. 2 works on all currency pairs, stocks, commodities, cryptocurrencies Instructions: As soon as the red arrow app
Your Trend Friend
Luigi Nunes Labigalini
5 (1)
The trend is your friend! Look at the color of the indicator and trade on that direction. It does not  repaint. After each candle is closed, that's the color of the trend. You can focus on shorter faster trends or major trends, just test what's most suitable for the symbol and timeframe you trade. Simply change the "Length" parameter and the indicator will automatically adapt. You can also change the color, thickness and style of the lines. Download and give it a try! There are big movements w
Blahtech Market Profile MT5
Blahtech Limited
5 (10)
Was: $249  Now: $99   Market Profile defines a number of day types that can help the trader to determine market behaviour. A key feature is the Value Area, representing the range of price action where 70% of trading took place. Understanding the Value Area can give traders valuable insight into market direction and establish the higher odds trade. It is an excellent addition to any system you may be using. Inspired by Jim Dalton’s book “Mind Over Markets”, this indicator is designed to suit the
Visual CrossPulse Dynamics Indicator
AL MOOSAWI ABDULLAH JAFFER BAQER
Visual CrossPulse Dynamics: Trade with the Market's True Rhythm Unlock a new level of market insight with Visual CrossPulse Dynamics, a sophisticated trading indicator designed to adapt to ever-changing volatility and reveal the true direction of the trend. Are you tired of indicators that lag in fast-moving markets or give false signals during consolidation? The Visual CrossPulse Dynamics indicator solves this problem by using an advanced, adaptive algorithm that intelligently adjusts to the m
Pro Gold System Indicator
PEDRO JOAQUIM GONCALVES GOMES
ADVANCED FUNCTIONALITIES: Trend Score (0-100) with visual bar Intelligent signals with adjustable strength (1-10) Risk management with automatic TP/SL Audible and visual alerts Price zones with smooth filling Multi-indicator analysis (RSI, ATR, BB, EMAs) DESIGN FEATURES Modern Visual: Smooth and well-spaced lines (EMA with 2-3px width) Vibrant and professional colors (Sky Blue, Orange, Gold) Modern arrows (code 233/234) for buy/sell signals Configurable dark/light theme Adjustable transparency f
CosmiCLab FIBO
Kirils Subins
CosmiCLab SMC FIBO CosmiCLab SMC FIBO is a professional trading indicator designed for traders who use Smart Money Concepts (SMC), market structure analysis and Fibonacci retracement levels. The indicator automatically detects market swings and builds Fibonacci levels based on the latest impulse movement. It also identifies market structure changes such as BOS (Break of Structure) and CHOCH (Change of Character), helping traders understand the current market direction. CosmiCLab SMC FIBO also pr
An indicator of pattern #31 ("Long Island") from Encyclopedia of Chart Patterns by Thomas N. Bulkowski. The second gap is in the opposite direction. Parameters: Alerts - show alert when an arrow appears   Push - send a push notification when an arrow appears (requires configuration in the terminal) GapSize - minimum gap size in points ArrowType - a symbol from 1 to 17 ArrowVShift - vertical shift of arrows in points   ShowLevels - show levels ColUp - color of an upward line ColDn - color of a d
VWAP Analytics Advanced Suite for MetaTrader 5 Gain institutional-grade market insight with the VWAP Analytics Advanced Suite , a professional Volume Weighted Average Price indicator built exclusively for MetaTrader 5. This tool goes beyond a simple VWAP line; it is a complete analytical ecosystem designed to identify trend bias, measure market deviation, and provide high-probability entry and exit signals with precision timing. Whether you are a day trader, scalper, or swing trader, this su
Trend Master V2
Oratile Pitsoane
What Is Trend Master Pro? Trend Master Pro   is a professional-grade trend trading indicator built for MetaTrader 5. It was designed with one goal in mind — to keep you on the right side of the market at all times by combining three powerful technical tools into a single, clean, easy-to-read display directly on your price chart. Instead of cluttering your screen with multiple separate indicators, Trend Master Pro fuses an   EMA Ribbon trend filter , a   ZigZag swing point engine , and a   breako
GoldPro Max
Taher Ahmed Mohamed Taha Elshafei
GOLDPRO MAX Advanced Multi-Timeframe and Smart Money Market Analysis for MetaTrader 5 GoldPro Max is a professional market analysis indicator for MetaTrader 5 designed to help traders study market direction, price structure, liquidity, market imbalance and potential trading areas from multiple perspectives. The indicator combines Multi-Timeframe Analysis, Smart Money Concepts, Market Structure, Liquidity Analysis, Order Blocks, Fair Value Gaps, Premium and Discount analysis, Smart Analytical Eng
Stratos Pali mt5
Michela Russo
4.5 (8)
Stratos Pali Indicator is a revolutionary tool designed to enhance your trading strategy by accurately identifying market trends. This sophisticated indicator uses a unique algorithm to generate a complete histogram, which records when the trend is Long or Short. When a trend reversal occurs, an arrow appears, indicating the new direction of the trend. Important Information Revealed Leave a review and contact me via mql5 message to receive My Top 5 set files for Stratos Pali at no cost ! Down
- All of my indicators are just 30$ !! Limited offer. Contact me for extra bonus   indicator, instruction or any questions! - Lifetime update free - Non-repaint - Plus Free Filtering Indicator  - Related product: Gann Gold EA - I just sell my products in Elif Kaya Profile, any other websites are stolen old versions, So no any new updates or support. Advantages of  M1 Scalper Pro  Profitability: M1 Scalper Pro is highly profitable with a strict exit strategy. Frequent Opportunities: M1 Scalper
Maximum Trend Arrows OT MT5
Mulweli Valdaz Makulana
STRICTLY FOR BOOM INDEX ONLY!!!!! Here I bring the Maximum Trend Arrows OT1.0 MT5 indicator. This indicator is made up of a combination of different trend indicators for entries and exits, for entries an orange arrow will paint on the chart below the current market and a red flag for closing of trades and it produces buy arrows only. When the orange arrow appears, it will appear along with it's sound to notify you. The 1H timeframe is recommended, don't use it anywhere else than on the 1H timefr
이 제품의 구매자들이 또한 구매함
Trend Sniper X
Sarvarbek Abduvoxobov
4.87 (46)
Trend Sniper X 는 트레이더가 추세 방향과 잠재적 반전 지점을 명확하고 정확하게 포착할 수 있도록 도와주는 MetaTrader 5용 멀티 타임프레임 추세 추종 지표입니다. MT4용: https://www.mql5.com/en/market/product/193245 가격 정보: 현재 가격은 프로모션 할인가이며, 향후 업데이트 및 새로운 기능이 출시됨에 따라 변동될 수 있습니다. 보너스 혜택: 본 지표 전용 무료 자동매매 Assistant EA를 받으시려면 구매 후 작성자에게 메시지를 보내주시기 바랍니다. Code2Profit 채널 멀티 타임프레임 분석으로 시장을 마스터하세요! Trend Sniper X로 승률을 극대화하는 방법: 핵심 규칙 및 세션 팁 기술 사양 플랫폼 MetaTrader 5 지표 유형 멀티 타임프레임 추세 지표 운용 타임프레임 모든 차트 타임프레임 지원, 독립적으로 선택 가능한 상위 타임프레임(M1–MN1) 주요 상품 외환, 금(XAUUSD) 및 기타 C
새로운 왕의 등장 - 인디케이터 + 주문 관리 표시(TP1 + TP2 + TP3) + 선택형 텔레그램 시그널 전송 기능 포함 (무료) (완전한 트레이딩 및 시그널 시스템) 골드를 위한 최고의 EA: Gold Slayer 이 인디케이터는 고급 전략, 사용자 지정 가능한 주문 관리 시스템, 그리고 엔벨로프 확장을 결합한 평균 회귀(mean reversion) 시스템을 포함하고 있습니다. 또한 RSI와 같은 여러 지능형 확인 필터를 통해 높은 확률의 반전 진입 구간을 포착하여 BUY 및 SELL 시그널을 제공합니다. 단순히 거래 방법만 배우는 것이 아니라, 여러 포지션을 효과적으로 관리하고 이전에 수익 중인 오픈 포지션으로 손실 거래를 커버하는 방법까지 익힐 수 있습니다. M5 전용으로 설계 및 최적화되었으며, 유동성이 풍부해 시그널이 더 깔끔하고 신뢰도 높은 BTCUSD와 XAUUSD에서 뛰어난 성능을 발휘합니다. 이 인디케이터는 ATR 기반으로 자동 계산된 진입가, 손절가, 익절가와
Smart Trend Trading System — MetaTrader 5 구매 후 MQL5에서 저에게 메시지를 보내시면 Smart Universal Expert Advisor를 무료로 받으실 수 있으며, 온라인 강좌, PDF 매뉴얼 및 비공개 그룹 이용 권한도 함께 제공됩니다. STTS는 추세 방향, 진입·청산 신호, 반전 구간, 주요 가격 수준을 차트에 모아 보여줍니다. 시스템을 참고해 수동으로 거래하거나, 별도의 호환 EA를 연결하여 선택한 설정에 따라 자동으로 거래를 실행할 수 있습니다. 하나의 시스템, 네 가지 트레이딩 접근법 STTS의 트레이딩 접근법은 크게 네 가지로 나뉩니다. • 스캘핑 — 단기 신호와 시장 움직임을 살펴봅니다. • 추세 매매 — 방향을 평가하고 추세 안에서 기회를 찾습니다. • 반전 매매 — 잠재적인 전환 구간과 방향 변화를 파악합니다. • 거래량 매매 — 거래량 기반 정보로 시장 활동을 평가합니다. 진입·청산 화살표, 추세 정보, 지지·저항 수
Entry Points Pro for MT5
Yury Orlov
4.55 (154)
Entry Points Pro는 주문을 넣기 전에 어디에서 진입하고, 스탑을 어디에 두고, 어떤 랏으로 거래할지 보여 줍니다. 가격 지금 199 USD이며, 이 가격으로는 4카피입니다. 이후 가격은 249 USD, 최종 가격은 349 USD입니다. 저는 시장에서 트레이딩으로 돈을 벌고 그것을 보여 드립니다. 그래서 이 인디케이터를 모두에게 팔 필요가 없습니다. 스스로 생각하는 트레이더를 위한 도구이지, 마법 버튼이 아닙니다. 돌파가 없으면 거래도 없습니다. 회색 화살표는 취소된 신호입니다. 가격이 신호 캔들을 돌파하지 못했으므로 진입도 손실도 없습니다. 화살표는 캔들이 마감될 때 나타나며 리페인팅되지 않습니다. 설정은 두 가지: 예치금과 거래당 리스크. 결제 전에 확인하세요: 무료 데모는 MT5 전략 테스터에서 작동하며 2분이면 됩니다. 구매 후에는 제가 직접 설정을 도와 드리겠습니다. 2019년, 저는 이 지표가 무엇을 할 수 있는지 전 세계에 보여 주었습니다. 실계좌에서 지표의
Gann Made Easy MT5
Oleg Rodin
5 (13)
Gann Made Easy 는 mr.의 이론을 사용하여 최고의 거래 원칙을 기반으로 하는 전문적이고 사용하기 쉬운 Forex 거래 시스템입니다. W.D. 간. 이 표시기는 Stop Loss 및 Take Profit Levels를 포함하여 정확한 BUY 및 SELL 신호를 제공합니다. PUSH 알림을 사용하여 이동 중에도 거래할 수 있습니다. 구매 후 거래 방법 안내 및 유용한 추가 지표를 무료로 받으시려면 저에게 연락주세요! 아마도 Gann 거래 방법에 대해 이미 여러 번 들었을 것입니다. 일반적으로 Gann의 이론은 초보자 거래자뿐만 아니라 이미 거래 경험이 있는 사람들에게도 매우 복잡한 것입니다. Gann의 거래 방식은 이론적으로 적용하기 쉽지 않기 때문입니다. 나는 그 지식을 연마하고 Forex 지표에 최고의 원칙을 적용하기 위해 몇 년을 보냈습니다. 표시기는 적용하기가 매우 쉽습니다. 차트에 첨부하고 간단한 거래 권장 사항을 따르기만 하면 됩니다. 지표는 지속적으로 시장 분석
SuperScalp Pro
Van Minh Nguyen
4.54 (37)
SuperScalp Pro - Professional Multi-Layer Confluence Scalping System SuperScalp Pro는 기존 Supertrend에 여러 지능형 확인 필터를 추가하여 기능을 강화한 고급 스캘핑 지표입니다. 잘못된 신호를 크게 줄이면서 성공 가능성이 더 높은 Buy/Sell 거래 기회를 식별하는 데 도움을 줍니다. 명확한 Buy 및 Sell 화살표가 차트에 직접 표시되며, ATR 기반 Stop Loss 및 Take Profit 레벨도 실시간으로 자동 계산됩니다. 구매 후 MQL5 메시지로 저에게 연락하시면 SuperScalp Pro Auto Trader EA를 무료로 받으실 수 있으며, 사용자 가이드와 비공개 그룹 이용 권한도 제공됩니다. 권장 설정 파일 다운로드: [Set File] 전체 문서는 제품 블로그에서 확인할 수 있습니다: [User Guide] 업데이트를 받으려면 공식 채널에 참여하세요: [Official Channel]
M5 Sniper
MeanFX
5 (4)
당신의 트레이딩 우위를 한눈에 확인하세요! M5 Sniper 는 MeanFX의 새로운 지표입니다. 정확한 트레이딩 신호 와 적응형 TP/SL 레벨 을 결합하여, 결과적으로 가능한 최고의 통계적 트레이딩을 만들어냅니다! 5회 구매마다 가격이 인상되며, 다음 가격은 69$입니다. 구매 후 저에게 메시지를 보내주시면 팁/가이드와 보너스 EA를 제공해 드립니다. 무엇이 이 지표를 특별하게 만들까요? Gold XAUUSD에서 검증된 통계적 성과 ( 거의 모든 자산에서 작동 하며, 일관된 결과 없이 모든 것을 다루려고 하기보다는 하나의 타임프레임을 완전히 익히는 데 집중합니다) 각 심볼당 하루 1~8회의 트레이드 와 높은 승률을 제공하며, 모든 통계적 우위를 우리의 편으로 가져갑니다. 차트에는 확인된 BUY 및 SELL 신호만 표시됩니다. 각 트레이드에 대해 지표가 생성하는 적응형 TP 및 SL 레벨 평균 승률 75%+ 평균 Signal Ratio 최소 1.1+ 알람 및 알림이 휴대폰 으로도
SMC Intraday Formula
VividMind Digital Solutions
5 (26)
먼저 솔직하게 말하겠습니다. 어떤 인디케이터도 단독으로 당신을 수익성 있게 만들어주지 않습니다. 누군가 그렇게 말한다면, 그는 당신에게 꿈을 파는 것입니다. 완벽한 매수/매도 화살표를 보여주는 모든 인디케이터는 완벽하게 보이도록 만들 수 있습니다 — 단지 올바른 과거 구간을 확대하고 승리한 거래만 캡처하면 됩니다. 우리는 그렇게 하지 않습니다.  SMC Intraday Formula는 도구입니다. 시장 구조를 읽고, 가장 높은 확률의 가격 구간을 표시하며, 현재 스마트 머니의 흐름이 어떻게 보이는지 아주 단순한 언어로 보여줍니다. 최종 결정은 여전히 당신이 합니다. 실행도 당신이 합니다. 하지만 이제는 희망이 아니라 정확성으로 거래하게 됩니다. 우리는 이 인디케이터를 지난 약 3년 동안 골드(XAUUSD) 및 주요 외환 통화쌍의 데이 트레이딩 스캘핑에 사용해 왔습니다. M1, M5, M15, M30에서 우리의 핵심 도구입니다. 이 도구는 미래를 예측하려 하지 않습니다 — 지금 형성
Zoryk Gold
Reda El Koutbane
4.65 (20)
ZORYK — MetaTrader 5용 XAUUSD 전문 신호 및 트레이드 플래닝 시스템 이런 경험이 있을 것입니다. 골드를 분석하고 진입을 기다린 뒤 마침내 포지션을 열었지만 가격이 곧바로 반대 방향으로 움직입니다. 너무 일찍 청산하거나 Stop Loss를 옮기거나 몇 초 동안 망설입니다. 그 후 시장은 내가 없이도 처음 예상했던 목표까지 정확히 움직입니다. 문제는 항상 방향이 아니었습니다. 진짜 문제는 불확실성이었습니다. 정확한 진입 위치를 몰랐습니다. 어느 지점에서 원래의 트레이드 아이디어가 무효가 되는지 몰랐습니다. 가까운 수익을 확보해야 할지 더 큰 움직임을 기다려야 할지 판단하기 어려웠습니다. 현재 setup이 정말 강한지 아니면 단지 새로운 거래를 억지로 찾고 있는지도 확신하기 어려웠습니다. 골드는 매우 빠르게 움직입니다. 명확한 계획이 없다면 좋은 분석도 몇 초 만에 나쁜 결정으로 바뀔 수 있습니다. ZORYK는 이 문제를 해결하기 위해 개발되었습니다.
Ultra Indicator
Ihor Otkydach
5 (1)
ULTRA는 “올인원” 방식으로 작동하는 기술적 지표로, 시장을 독자적으로 분석하고, 매매 신호를 생성하며, 손절매 주문 설정 수준을 표시하고, 이익을 실현하거나 손실을 최소화하기 위해 포지션을 청산해야 할 시점을 제안합니다. 다시 말해, 시장을 분석하는 법을 모르거나, 가격 수준(손절매를 어디에 설정할지)을 파악하지 못하거나, 자금 관리에 어려움을 겪더라도 상관없습니다. ULTRA가 그 모든 것을 대신 해줄 테니까요! 구매자 특전 : ULTRA 지표를 구매하신 후, 저에게 비공개 메시지를 보내주시면 “ULTRA BOT”을 무료 선물로 드립니다. 이 도구는 해당 지표의 신호를 바탕으로 개설한 거래를 관리하는 데 도움을 주는 특별한 도구입니다(각 거래에 대해 손절매를 설정하고, 최상의 결과를 얻을 수 있도록 전략의 규칙에 따라 거래를 자동으로 청산해 줍니다).  또한 구매자분들께 다양한 자산에 바로 적용할 수 있는 설정값을 제공해 드리고 있으며, 이를 통해 지표가 최대 효율로 작동할
GoldenX Entry MT5
VividMind Digital Solutions
5 (17)
GoldenX Entry는 MT5용 인디케이터로, 적응형 Smart Entry Trend 알고리즘, 신호 스코어링 시스템, 시장 레짐 감지 기능, 그리고 변동성 필터를 포함합니다. 각 신호에는 계산된 진입 레벨, 3개의 익절(TP1, TP2, TP3) 레벨, 그리고 손절(Stop-Loss) 레벨이 포함됩니다. 이 인디케이터는 다양한 시장 환경에 적응하도록 설계된 다중 분석 레이어 구조 위에 구축되어 있으며, 내장 최적화기와 통계 추적 시스템을 결합합니다. 또한 Risk-to-Reward(RR) 지표와 과거 거래 행동 기반의 정량 분석을 제공합니다. 시작은 간단합니다 — 선택한 타임프레임에서 최적화기를 실행한 뒤 차트에서 바로 인디케이터를 사용하면 됩니다. 핵심 기능 GoldenX Entry는 하나의 차트에서 신호 엔진, 트레이드 관리 기능, 그리고 과거 통계 추적을 통합합니다: - 내장 최적화기: 최적화기는 차트에서 원클릭으로 실행됩니다. 200개의 파라미터 조합을 두 단계 탐색
Gold Trend Coach MT5
Cristhian Alexander Gaibor Cuasquer
4.27 (11)
MetaTrader 5용 골드(XAUUSD) 매수·매도 신호, 리페인팅 없음. 모든 신호에 손절가와 세 개의 익절가가 함께 나옵니다. BOS와 CHoCH를 활용한 Smart Money Concepts 필터로 구조를 거스르지 않고 구조를 따라 매매합니다. 패널의 실시간 멘토가 진입부터 TP3까지 모든 단계를 안내합니다. 알림은 휴대폰과 나만의 Telegram 채널로 바로 옵니다. 이것이 Gold Trend Coach입니다. 이제 혼자 매매하지 마세요. 구매 시 무료 구매자 키트 제공: 1. Telegram Alert Bridge: 신호가 차트 스크린샷, 일일 리포트와 함께 나만의 Telegram 채널로 전송됩니다. 2. 사용자 매뉴얼과 설정 가이드. 받는 방법: 키트는 다운로드 파일에 들어 있지 않습니다. 구매 후 MQL5 메시지로 연락 주시면 당일에 보내드립니다. $39, $45 런칭가 물량은 매진되었습니다. 지금은 다음 10카피까지 $59, 이후 $79입니다. 먼저, 솔직한 이야
Boba Analysis Suite
Trade Ready Solutions LLC
5 (2)
Boba Analysis Suite Boba Analysis Suite는 MetaTrader 5용 분석 지표입니다. 시장 구조, 주요 가격 영역, 전반적인 시장 상황을 하나의 차트 화면에 통합하여 표시합니다. 트레이더이자 트레이딩 코치로서의 실무 경험을 바탕으로 개발되었으며, 시장 방향 평가, 주요 가격 수준 식별, 여러 시간대의 종합적인 분석 등 체계적인 분석 과정을 지원합니다. 시장 맥락을 고려한 분석 개별 신호의 의미는 시장 상황에 따라 달라집니다. Boba Analysis Suite는 현재 차트 상황을 더 넓은 시장 구조와 연결하고, 사전에 정한 규칙에 따라 매매 아이디어를 검토할 수 있도록 돕습니다. 주요 분석 기능은 다음과 같습니다. 추세 및 시장 구조: 시장 방향과 관련 구조적 맥락을 평가합니다. 주요 가격 영역 및 수준: 추가 분석이 필요한 중요한 영역을 차트에 시각적으로 표시합니다. 여러 시간대: 서로 다른 시간대의 정보를 통합하여 전반적인 시장 상황을 평가합니다.
FX Power MT5 NG
Daniel Stein
5 (33)
FX Power: 통화 강세 분석으로 더 스마트한 거래 결정을 개요 FX Power 는 어떤 시장 상황에서도 주요 통화와 금의 실제 강세를 이해하기 위한 필수 도구입니다. 강한 통화를 매수하고 약한 통화를 매도함으로써 FX Power 는 거래 결정을 단순화하고 높은 확률의 기회를 발견합니다. 트렌드를 따르거나 극단적인 델타 값을 사용해 반전을 예측하고자 한다면, 이 도구는 귀하의 거래 스타일에 완벽히 적응합니다. 단순히 거래하지 말고, FX Power 로 더 스마트하게 거래하세요. 1. FX Power가 거래자에게 매우 유용한 이유 통화와 금의 실시간 강세 분석 • FX Power 는 주요 통화와 금의 상대적 강세를 계산하고 표시하여 시장 역학에 대한 명확한 통찰력을 제공합니다. • 어떤 자산이 앞서고 있고 어떤 자산이 뒤처지는지 모니터링하여 보다 현명한 거래 결정을 내릴 수 있습니다. 포괄적인 멀티 타임프레임 뷰 • 단기, 중기 및 장기 타임프레임에서 통화와 금의 강세를
Power Candles MT5
Daniel Stein
4.58 (12)
Power Candles V3 - 자체 최적화 강도 지표 파워 캔들 V3는 적용된 모든 차트에서 통화 및 상품의 강세를 실행 가능한 거래 계획으로 전환합니다. 단순히 캔들에 색상을 입히는 대신, 백그라운드에서 실시간 자동 최적화를 수행하여 현재 보고 있는 종목에 대한 최적의 손절매, 익절 및 신호 임계값을 제공합니다. 한 번의 클릭으로 실시간 거래에 적용할 수 있으며, 진입점, 손절매 및 익절 선이 정확한 가격에 맞춰 차트에 표시되고, 방향과 함께 알림이 발령됩니다. 이 도구는 Stein Investments 에코시스템의 일부입니다. 18개 이상의 도구와 함께 당신의 1대1 AI 트레이딩 멘토 Max.  항상 대기 중, 모든 인디케이터를 깊이 있게 이해, 무언가를 차근차근 생각해보고 싶은 순간에 도움을 줍니다.  https://stein.investments 에서 만나보세요 매 종가 바마다 3,000회 이상의 트레이딩 시뮬레이션. 9가지 강도 상태. 2가지 전략을 병렬로 테스트.
M1 Sniper MT5
Oleg Rodin
5 (7)
M1 SNIPER 는 사용하기 쉬운 거래 지표 시스템입니다. M1 시간대에 맞춰 설계된 화살표 지표입니다. 이 지표는 M1 시간대 스캘핑을 위한 단독 시스템으로 사용할 수 있으며, 기존 거래 시스템의 일부로도 사용할 수 있습니다. 이 거래 시스템은 M1 시간대 거래용으로 특별히 설계되었지만, 다른 시간대에도 사용할 수 있습니다. 원래는 XAUUSD와 BTCUSD 거래를 위해 이 방법을 설계했지만, 다른 시장 거래에도 유용하다는 것을 알게 되었습니다. 이 지표의 신호는 추세 방향과 반대로 거래될 수 있습니다. 저는 지표의 신호를 활용하여 양방향으로 거래할 수 있도록 돕는 특별한 거래 기법을 알려드립니다. 이 방법은 특별한 동적 지지선과 저항선 가격 영역을 활용하는 것을 기반으로 합니다. 구매하시면 M1 SNIPER 화살표 지표를 바로 다운로드하실 수 있습니다. 또한, 아래 스크린샷에 표시된 Apollo Dynamic SR 지표는 M1 SNIPER 도구를 사용하는 모든 사용자에게 무료로
Atomic Analyst MT5
Issam Kassas
4.51 (65)
Atomic Analyst — MetaTrader 5 구매 후 MQL5에서 저에게 메시지를 보내시면 Smart Universal Expert Advisor를 무료로 받으실 수 있으며, 온라인 강좌, PDF 매뉴얼 및 비공개 그룹 이용 권한도 함께 제공됩니다. Atomic Analyst는 가격 움직임 분석, 추세 방향, 진입·청산 신호, 손절 수준, 여러 익절 수준을 차트에 모아 보여줍니다. 신호를 확인하고 매매 상황을 이해하세요 Atomic Analyst는 분석 결과를 명확한 시각 정보로 정리합니다. • 잠재적인 진입 기회를 확인할 수 있는 매수·매도 화살표. • 거래 계획에 도움이 되는 손절 수준과 여러 익절 수준. • 시장 방향을 평가할 수 있는 추세, 강도, 모멘텀 수치. • 더 넓은 시장 맥락을 비교할 수 있는 여러 시간대 분석. • 변화하는 시장 상황을 따라갈 수 있는 색상별 캔들과 알림. 신호와 보조 분석을 함께 검토한 다음, 해당 매매 상황이 자신의 거래 규칙에
Smc Pro ToolKit
Talal N Z Aljarusha
5 (13)
SMC PRO TOOLKIT — SMART MONEY ANALYSIS & STRUCTURED TRADE PLANNING SMC Pro ToolKit is a professional Smart Money Concepts analysis workspace for MetaTrader 5. It combines market structure, multi-timeframe analysis, institutional price zones, setup evaluation, confirmation tools, volume context, alerts, and risk planning inside one organized chart environment. One workspace. Multiple layers of confirmation. One structured trading plan. OPEN COMPLETE USER GUIDE MULTI-CONDITION SETUP ENGINE At
Auto Optimized SpeedAngle 은 지속적인 워크포워드 최적화(Walk-Forward Optimization, WFO)를 통해 곡선 적합(curve-fitting)을 제거한 기관 수준의 모멘텀 벡터화 시스템입니다. 시장 체제가 바뀔 때 성능이 떨어지는 정적 입력에 의존하는 대신, 이 지표는 표본 외(Out-of-Sample, OOS) 검증을 사용하여 매개변수를 동적으로 재보정하며, 표시되는 신호가 과거의 우연이 아닌 진정한 통계적 우위를 나타내도록 보장합니다. 핵심 기관용 프레임워크 워크포워드 최적화 엔진: 핵심 알고리즘은 수천 가지의 룩백(lookback) 및 임계값 조합을 지속적으로 스캔하며, 데이터를 인샘플(in-sample)과 표본 외(out-of-sample) 세트로 엄격하게 분리합니다. 미지의 데이터 환경에서 수학적 우수성이 증명된 경우에만 새로운 매개변수 구성을 채택합니다. 정량적 목적 함수: 순수한 총이익을 쫓는 대신, 최적화 엔진은 기관 수준의 안정성
Azimuth Pro
Ottaviano De Cicco
5 (7)
Azimuth Pro V2: Synthetic Fractal Structure and Confirmed Entries for MT5 Overview Azimuth Pro is a multi-level swing structure indicator by Merkava Labs . Four nested swing layers, swing-anchored VWAP, ABC pattern detection, three-timeframe structural filtering, and closed-bar confirmed entries — one chart, one workflow from micro-swings to macro-cycles. This is not a blind signal product. It is a structure-first workflow for traders who care about location, context, and timing. 1. What Change
Gold Entry Sniper
Tahir Mehmood
5 (23)
Gold Entry Sniper – 골드 스캘핑 & 스윙 트레이딩을 위한 전문 다중 시간 프레임 ATR 대시보드 Gold Entry Sniper 는 XAUUSD 및 기타 종목에 대해 정확한 매수/매도 신호 를 제공하는 고급 MetaTrader 5 지표입니다. ATR 트레일링 스톱 로직 과 다중 시간 프레임 분석 을 기반으로 설계되어 스캘핑과 스윙 트레이딩 모두에 적합합니다. 주요 기능 및 장점 다중 시간 프레임 분석 – M1, M5, M15 추세를 한눈에 확인. ATR 기반 트레일링 스톱 – 변동성에 따라 자동 조정. 전문 차트 대시보드 – 신호 상태, ATR 레벨, 회귀선, 매매 방향 표시. 명확한 매수/매도 마커 – 자동 화살표와 텍스트 라벨. 종료 알림 & 거래 관리 – 수익 보호를 위한 자동 종료 감지. 완전 사용자 설정 가능 – 대시보드 위치, 색상, ATR/회귀선 파라미터 조정. 골드(XAUUSD) 최적화 – M1~M15 스캘핑에 완벽, 외환/지수/암호화폐에도 적용 가능.
Apex Patterns PRO 인디케이터 구매 시 - 기반 Expert Advisor 무료 제공. 자체 최적화 차트 패턴 및 브레이크아웃 분석 시스템 기존의 패턴 스캐너는 고정된 파라미터에 의존하므로 시장 변동성과 구조가 변화할 때 성능이 저하되는 경우가 많습니다. Apex Patterns PRO는 구조적 차트 패턴 인식, 모멘텀 필터링, 통계적 자체 최적화를 하나의 분석 프레임워크로 결합하여 변화하는 시장 환경에 적응하도록 설계되었습니다. 적응형 스캐닝 엔진 자체 최적화 패턴 모드 최근 과거 데이터를 바탕으로 적절한 패턴 파라미터를 자동으로 탐색하여, 정적인 설정 대신 현재 시장 행보에 맞춰 인디케이터의 구조 감지 방식을 적응시킵니다. 스마트 브레이크아웃 필터링 클래식 패턴 인식과 모멘텀, 거래량, 프라이스 액션 지표를 결합합니다. 모든 브레이크아웃을 동일하게 다루는 대신, 시장의 기저 구조를 평가하여 현재 통계적 환경에 부합하는 셋업을 식별합니다. 주요 기능 리페인트 없는 고
Meridian Pro
Ottaviano De Cicco
4 (3)
Meridian Pro 2.00: Professional Multi-Timeframe Trend Matrix for MT5 Meridian Pro 2.00 is a professional adaptive trend matrix for MetaTrader 5. It combines the original Meridian trend engine, a clean chart ribbon, closed-bar signal arrows, an 8-timeframe dashboard, Fuel momentum, weighted consensus, synthetic HTF processing and chart-native higher-timeframe context lines. The goal is simple: read current trend, multi-timeframe structure, strength, momentum and EA-ready state from one discipline
다음 업데이트 — 버전 2.52 곧 출시! [신규] 시장 분석 및 트레이딩 워크플로를 향상시키기 위해 설계된 4가지 주요 신규 기능을 기대해 주세요. 트레이딩 요구 사항을 충족하도록 설계된 4가지 새로운 기능으로 시장 분석을 한 단계 더 발전시킵니다. 다음 기능을 소개합니다: 1. TRADE OVERVIEW DASHBOARD 2. CONFLUENCE AT ZONE 3. STRONG & WEAK HIGH/LOW 4. OTE 1. TRADE OVERVIEW DASHBOARD 시장 전체 상황을 더 쉽게 파악할 수 있도록 도와주는 대시보드입니다. 트레이딩 의사결정을 지원하는 가이드를 제공하며, 하나의 화면에서 시장을 분석하고 체계적으로 트레이딩을 계획할 수 있도록 도와줍니다. 멀티 타임프레임 시장 개요 (Multi-Timeframe Market Overview) 시장 방향과 가격 구조를 더욱 명확하게 파악 시장 상황을 빠르게 확인 체계적인 시장 분석 및 진입 계획을 위한 가이드 2. CO
Divergence Bomber
Ihor Otkydach
4.89 (94)
이 지표를 구매하신 분께는 다음과 같은 혜택이 무료로 제공됩니다: 각 거래를 자동으로 관리하고, 손절/익절 수준을 설정하며, 전략 규칙에 따라 거래를 종료하는 전용 도우미 툴 "Bomber Utility" 다양한 자산에 맞게 지표를 설정할 수 있는 셋업 파일(Set Files) "최소 위험", "균형 잡힌 위험", "관망 전략" 모드로 설정 가능한 Bomber Utility의 셋업 파일 이 전략을 빠르게 설치, 설정, 시작할 수 있도록 돕는 단계별 영상 매뉴얼 주의: 위의 모든 보너스를 받기 위해서는 MQL5 개인 메시지 시스템을 통해 판매자에게 연락해 주세요. 독창적인 커스텀 지표인 “Divergence Bomber(다이버전스 봄버)”를 소개합니다. 이 지표는 MACD 다이버전스(괴리) 전략을 기반으로 한 올인원(All-in-One) 거래 시스템입니다. 이 기술 지표의 주요 목적은 가격과 MACD 지표 간의 다이버전스를 감지하고, **향후 가격이 어느 방향으로 움직일지를 알려주
Adaptive Price Action Engine 지표를 구매하면 EA(자동매매 프로그램)가 무료 멀티 타임프레임 기반 자기 최적화 추세 & 캔들 패턴 분석 시스템 시장은 끊임없이 변화하며, 모든 Price Action 패턴이 모든 시장 환경에서 동일한 가치를 가지는 것은 아닙니다. Adaptive Price Action Engine 은 변화하는 시장 환경에 적응할 수 있도록 설계되었으며, 추세 구조, 멀티 타임프레임 분석, 캔들 패턴 및 통계적 최적화 를 하나의 분석 프레임워크로 결합합니다. 두 가지 적응형 모드 Dual Alpha Trend Mode 낮은 타임프레임과 높은 타임프레임에서 적합한 Alpha Trend 파라미터를 자동으로 탐색하여, 최근 시장 움직임에 맞춰 추세 분석을 조정합니다. Candlestick + Alpha Mode Alpha Trend를 통한 시장 국면 분석과 22개의 상승 및 하락 캔들 패턴 을 결합합니다. 모든 패턴을 동일하게 취급하는 대신, 다양
통화 강도 마법사는 성공적인 거래를 위한 올인원 솔루션을 제공하는 매우 강력한 지표입니다. 표시기는 여러 시간 프레임의 모든 통화 데이터를 사용하여 이 또는 해당 외환 쌍의 힘을 계산합니다. 이 데이터는 특정 통화의 힘을 확인하는 데 사용할 수 있는 사용하기 쉬운 통화 지수 및 통화 전력선의 형태로 표시됩니다. 필요한 것은 거래하려는 차트에 표시기를 부착하는 것뿐입니다. 표시기는 거래하는 통화의 실제 강세를 보여줍니다. 지표는 또한 추세와 거래할 때 유리하게 사용할 수 있는 구매 및 판매 거래량 압력의 극한값을 보여줍니다. 지표는 또한 피보나치에 기반한 가능한 대상을 보여줍니다. 표시기는 PUSH 알림을 포함한 모든 유형의 알림을 제공합니다. 구매 후 연락주세요. 나는 당신과 거래 팁을 공유하고 당신에게 무료로 훌륭한 보너스 지표를 줄 것입니다! 나는 당신에게 행복하고 유익한 거래를 기원합니다!
Crystal Heikin Ashi Signals
Muhammad Jawad Shabir
5 (5)
Crystal Heikin Ashi Signals—Professional Trend & Signal Detection Indicator Advanced Heikin Ashi Visualization with Intelligent Signal System for Manual & Automated Trading Final Price: $149 ---------> Price goes up $10 after every 10 sales . Limited slots available — act fast . Overview User Guide PDF Crystal Heikin Ashi Signals is a professional-grade MetaTrader 5 indicator that combines pure Heikin Ashi candle visualization with an advanced momentum-shift detection system. Designed for both m
Naked Forex Tweezer Pro Indicator Tweezer Pro Indicator is a pattern recognition indicator for Forex, Stocks, Indices, Futures, Commodities and Cryptos. The standard Tweezer is a two bar pattern. Our enhanced version is a multi-bar pattern. We filter the patterns for you so that you only get the     best and most effective patterns   and ignore the noise. The Tweezer pattern is a simple and effective pattern to trade. The strategy that comes with the Tweezer is based on price action. The Twe
FiboSniper Pro
Van Minh Nguyen
5 (4)
FiboSniper Pro – Multi-Filter Fibonacci System with Auto SL/TP and Control Panel FiboSniper Pro는 동적 Fibonacci Envelopes와 여러 확인 필터를 결합하여 선별된 Buy 및 Sell 신호를 생성하는 기술적 지표입니다. Fibonacci 레벨은 Moving Average와 ATR을 기반으로 계산된 후 ADX, EMA, RSI, ATR, Volume, Time 및 Candle 구조를 통해 필터링됩니다. 이 지표는 ATR 기반의 자동 Stop Loss 및 Take Profit 레벨을 차트에 직접 표시하며, 빠른 설정 조정을 위한 인터랙티브 Control Panel을 제공합니다. 구매 후 MQL5 메시지로 저에게 연락하시면 Auto Trader X를 무료로 받으실 수 있으며, 이 지표의 거래 신호를 자동화하는 방법에 대한 안내도 제공됩니다. User Guide 및 Set Files: [Click here
제작자의 제품 더 보기
1. OVERVIEW Harmonic Dashboard is a specialized multi-symbol and multi-timeframe analytical indicator designed for MetaTrader 5 (MT5). The software systematically scans financial instruments across multiple timeframes to identify six classical harmonic chart patterns: Gartley, Bat, Butterfly, Crab, Cypher, and Shark. The application consolidates multi-asset scanner results, trend filter validation metrics, price level projections, and interactive chart navigation controls into a single graphic
Overview MACD Signal with Multi Filters is an advanced technical analysis indicator engineered for MetaTrader 5 (MT5). The software combines the classic Moving Average Convergence Divergence (MACD) oscillator architecture with a modular 14-filter confirmation engine (MultiFilterSuite). It is developed to assist manual traders, quantitative analysts, and algorithmic system developers in identifying momentum shifts, trend continuations, and structural turning points while filtering out sideways ma
Parabolic SAR Multi-Filter System MT5: Algorithmic Trend Reversal Engine 1. PRODUCT OVERVIEW & OPERATIONAL ARCHITECTURE Parabolic SAR Multi-Filter System MT5 is a professional multi-component technical analysis indicator engineered for the MetaTrader 5 terminal. The indicator combines J. Welles Wilder's classic Parabolic Time/Price System with an advanced modular filtering architecture comprising 17 distinct secondary validation engines. The primary objective of this software is to eliminate f
Hull Trend Arrows MT5 with Multi-Filter Suite - Technical Documentation 1. Overview and Analytical Purpose Hull Trend Arrows MT5 with Multi-Filter Suite is an algorithmic technical indicator for MetaTrader 5. It integrates the low-lag calculation engine of the Hull Moving Average (HMA) with fourteen modular confirmation filters to identify directional momentum transitions, calculate inflection points, and display non-repainting entry signals on the chart. Standard moving averages introduce sign
FREE
Product Overview: Relative Vigor Index Multi-Filter Technical System The Relative Vigor Index (RVI) Multi-Filter Indicator is a comprehensive technical analysis engine developed for the MetaTrader 5 terminal. Designed to identify cyclical momentum shifts, trend continuations, and structural market turning points, this analytical system couples the classic Relative Vigor Index formula with an advanced multi-layered confirmation matrix consisting of 17 distinct technical filters. Rather than rely
FREE
HA Signal MultiFilter MT5 - Technical Operational Manual & Architecture Guide 1. SYSTEM OVERVIEW & ARCHITECTURAL FOUNDATION HA Signal MultiFilter MT5 is a specialized analytical indicator developed for MetaTrader 5 terminal to identify directional momentum expansions and structural trend continuations[cite: 2]. By synthesizing smoothed Heiken Ashi candlestick price discovery with a modular 15-layer secondary confirmation filter suite, the system extracts high-probability market shifts while fil
FREE
Overview The MA Cross Scanner Pro is an advanced, highly optimized multi-symbol and multi-timeframe analytical dashboard engineered specifically for the MetaTrader 5 terminal. Designed for technical analysts, systemic traders, and quantitative researchers, this utility serves as a comprehensive market surveillance engine. Its primary objective is to continuously monitor a customized array of financial instruments across numerous timeframes simultaneously, detecting precise moving average crosso
CCI MultiFilter Overbought Oversold Signal Pro MT5 Technical Specification & Operational Manual  1. Overview and System Identity CCI MultiFilter Overbought Oversold Signal Pro MT5 is an institutional-grade technical analysis indicator engineered natively for MetaTrader 5. Developed for quantitative analysts, systematic manual traders, and multi-asset operators, the system provides an objective algorithmic framework to identify cyclical market extremes, momentum shifts, and structural trend cont
Multi-Pattern Signal Suite with Universal 14-Filter Framework for MetaTrader 5 1. Product Overview Multi-Pattern Signal Suite is an advanced technical analysis indicator engineered for the MetaTrader 5 terminal. The indicator detects high-probability candlestick formations comprising PinBar, Candle Rejection, and Marubozu (Full Body Candle) patterns. To eliminate market noise and false breakout formations, the core price action engine is integrated with the Universal MultiFilterSuite framework:
Overview: ADX Signal MultiFilter is an advanced technical analysis indicator for MetaTrader 5 designed to identify directional breakout momentum and trend acceleration phases. Built around the mathematical framework of J. Welles Wilder's Directional Movement system (ADX, +DI, and -DI), the tool monitors dynamic momentum shifts where directional movement lines break through user-defined threshold levels. To resolve the common challenge of false breakout signals during ranging or choppy market con
Bollinger Band Breakout MultiFilter PRO Signal MT5 1. Overview and Operational Purpose Bollinger Band Signal MultiFilter MT5 is an analytical technical indicator developed for the MetaTrader 5 terminal, designed to detect volatility expansion breakouts while filtering market noise through an extensive modular array of quantitative secondary filters. In dynamic market environments, classic envelope breakouts frequently encounter false continuations during low-momentum ranges or trend exhaustion
Breakout Divergence RSI MultiFilter is a modular technical analysis indicator for MetaTrader 5 designed to identify Regular and Hidden RSI Divergences alongside confirmed trendline breakout continuation opportunities. Equipped with an algorithmic multi-layer filtering engine comprising 16 technical filter systems, this indicator provides an analytical bridge between momentum divergence recognition and structural price action confirmation. 1. TECHNICAL OVERVIEW AND ARCHITECTURE Breakout Diverge
Pro CHO Chaikin Oscillator X Zero Signals Filter Chaikin Oscillator Signal MultiFilter for MetaTrader 5 Product Overview Chaikin Oscillator Signal MultiFilter is a professional-grade technical analysis indicator engineered specifically for the MetaTrader 5 trading platform. The system is designed to identify directional momentum transitions and institutional volume flow dynamics by tracking the Chaikin Oscillator algorithmic model in synchronization with a comprehensive 14-filter confirmation
### Product Overview The Engulfing Dual-Engine and Multi-Filter Confirmation Indicator for MetaTrader 5 is a specialized technical analysis analytical tool engineered to identify directional engulfing candlestick patterns across global financial markets. Developed for quantitative analysts, discretionary traders, and algorithmic strategy designers, the software categorizes engulfing structures into two distinct computational classifications: Standard Retail Engulfing and Advanced Institutional E
1. Overview and Indicator Identity Fractal Breakout MultiFilter MT5 is an institutional-grade technical indicator engineered natively for MetaTrader 5 that identifies high-probability structural breakout opportunities based on multi-bar fractal geometries and confirms them through an institutional suite of fourteen independent analytical filters. The primary purpose of this analytical tool is to eliminate subjective chart interpretation by mathematically locating confirmed price swing highs and
Product Overview: Heiken Ashi Multi-Filter Suite MT5 The Heiken Ashi Multi-Filter Suite is an analytical trading indicator developed natively for MetaTrader 5, designed to provide directional price smoothing, structural reversal detection, and rule-based signal confirmation. By merging modified Heiken Ashi bar calculations with a modular 14-indicator filtering engine, the tool eliminates transient market noise and provides traders with disciplined visual signals. The indicator is built around t
MultiFilter MA High Low Cross Buy Sell Arrows MT5 - Professional Technical Manual 1. Product Overview & System Architecture MultiFilter MA High Low Cross Buy Sell Arrows MT5 is an advanced technical indicator engineered for the MetaTrader 5 trading terminal. Designed for professional technical analysts, manual chartists, and systematic discretionary traders, this software identifies high-probability directional momentum expansions and trend resumption points by tracking price interactions acro
MultiFilter MA Crossover Signals Trend Alerts MT5 TECHNICAL SPECIFICATION & MANUAL Overview: MultiFilter MA Crossover Signals Trend Alerts MT5 is an analytical technical indicator engineered for MetaTrader 5, developed to identify systematic trend transitions through dual moving average crossovers combined with a 17-module quantitative filtering matrix. A primary weakness of conventional moving average systems is vulnerability to whipsaws, false breakouts, and erratic market noise during low-vo
Momentum KU v1.41 Technical Documentation and Operational Manual 1. Overview and Purpose Momentum KU v1.41 is an analytical technical indicator engineered natively for the MetaTrader 5 (MT5) platform. The primary objective of the software is to detect directional momentum transitions across financial assets and provide multi-layered signal validation through an integrated architecture of seventeen independent technical filter subsystems. Momentum KU executes as an on-chart visual utility, plott
NLMS Volatility Trail MultiFilter MT5 - Operational Manual & Technical Specification 1. Overview and Core Purpose NLMS Volatility Trail MultiFilter MT5 is an algorithmic market analysis indicator designed for MetaTrader 5, providing adaptive trend identification, dynamic trailing envelopes, and multi-layered signal filtering. The system is built upon digital signal processing theory, dynamic volatility channels, and a modular matrix of secondary filters. At its computational core operates the
================================================================================ PRO PARABOLIC RSI MULTIFILTER SIGNAL PREMIUM MT5 (OFFICIAL PRODUCT SPECIFICATION) ================================================================================ Pro Parabolic RSI MultiFilter Signal Premium MT5 is a professional-grade technical trading suite engineered for MetaTrader 5, combining high-precision Relative Strength Index (RSI) dynamics with the trailing acceleration mechanism of the Parabolic SAR (St
PARABOLIC RSI SCANNER DASHBOARD ALL PAIR TIMEFRAME - TECHNICAL MANUAL 1. OVERVIEW & SYSTEM ARCHITECTURE The Parabolic RSI Scanner Dashboard All Pair Timeframe is a multi-asset, multi-timeframe analytical utility developed for the MetaTrader 5 terminal. The software calculates a synthetic technical indicator by mapping J. Welles Wilder's Parabolic Stop and Reverse (SAR) tracking logic directly onto the Relative Strength Index (RSI) momentum data series. Rather than tracking price fluctuations,
MultiCandle Pattern Pro with Universal Filter Suite v2.0 is a professional technical analysis indicator engineered for MetaTrader 5 (MT5). The software automates the identification of sequential multi-candle price action formations across liquid financial markets, focusing specifically on 4-Candle (4C), 5-Candle (5C), and 6-Candle (6C) structures. Rather than depending on isolated single-candle setups that are vulnerable to erratic market noise, the system analyzes structured multi-bar sequence
Product: Pro RSI Signal Overbought Oversold Multi Filters MT5 Category: Technical Indicator / Oscillators & Momentum Platform: MetaTrader 5 Overview Pro RSI Signal Overbought Oversold Multi Filters is a technical momentum analysis indicator developed natively for the MetaTrader 5 platform. The tool reproduces and expands upon the standard TradingView Relative Strength Index architecture, providing an authentic analytical bridge between modern charting environments and the MetaTrader trading te
Overview The RSI Scanner Dashboard is a comprehensive technical analysis utility and multi-symbol, multi-timeframe monitoring indicator designed for the MetaTrader terminal. The primary objective of this tool is to scan market instruments continuously to identify specific Relative Strength Index (RSI) crossover conditions based on defined overbought and oversold thresholds. By aggregating data across user-defined currency pairs and timeframes into a single graphical user interface (GUI), this d
RVI Dual Mode with Universal Multi-Filter Framework for MetaTrader 5 Product Overview and Technical Scope RVI Dual Mode with Universal Multi-Filter Framework is a modular technical analysis indicator engineered specifically for MetaTrader 5. Built upon the volatility-adjusted momentum mathematics of Donald Dorsey's Relative Volatility Index (RVI), this analytical tool provides systematic directional signal generation while addressing whipsaws during consolidating markets. Rather than relying on
Overview RVI Scanner Dashboard Pro is a multi-symbol and multi-timeframe analytical utility engineered for MetaTrader. In financial markets, tracking multiple instruments across various timeframes simultaneously creates significant cognitive load. This dashboard solves this by aggregating decentralized market data into a cohesive Graphical User Interface (GUI). Its primary objective is to monitor continuous data feeds to detect momentum shifts and potential trend reversals based on the Relative
Senkou Span B Dynamic Rejection and Multi-Filter Confluence Framework for MetaTrader 5 Overview The Senkou Span B Dynamic Rejection Indicator is a modular technical analysis system designed for the MetaTrader 5 platform. It identifies institutional price interactions around the Senkou Span B equilibrium line of the Ichimoku Kinko Hyo model. Senkou Span B represents the 52-period midpoint value projected into the market structure, serving as a primary indicator of medium-to-long term support, r
1. Overview Stochastic Multi-Filter Suite is a specialized technical indicator engineered natively for the MetaTrader 5 (MT5) trading platform. The software integrates George Lane's classical Stochastic Oscillator engine with a modular 14-filter algorithmic confirmation framework designated as the MultiFilter Suite. Developed specifically for systematic technical analysts, multi-asset discretionary traders, and quantitative chartists, the indicator transforms standard momentum oscillators into
OVERVIEW Stochastic Scanner Dashboard is a professional analytical utility and multi-symbol, multi-timeframe signal indicator designed for MetaTrader. The primary objective of this tool is to simultaneously monitor multiple financial instruments and timeframes to identify potential market entries based on the Stochastic Oscillator. It eliminates the need to open multiple charts by consolidating all active signals, price levels, and dynamic Risk/Reward calculations into a single interactive grap
필터:
리뷰 없음
리뷰 답변