Inverseprobabilitydistribution
- Indicadores
-
Shi Yuan Wang
 Desenvolvo indicadores personalizados, Expert Advisors (EAs), scripts e ferramentas de trading para MetaTrader 4 e MetaTrader 5, e indicadores para TradingView (Pine Script).
O que posso fazer por si: - Versão: 1.0
Inverse Probability Distribution — Pivot Density and K-Means Clustering Indicator
Platform: MetaTrader 5
Overview
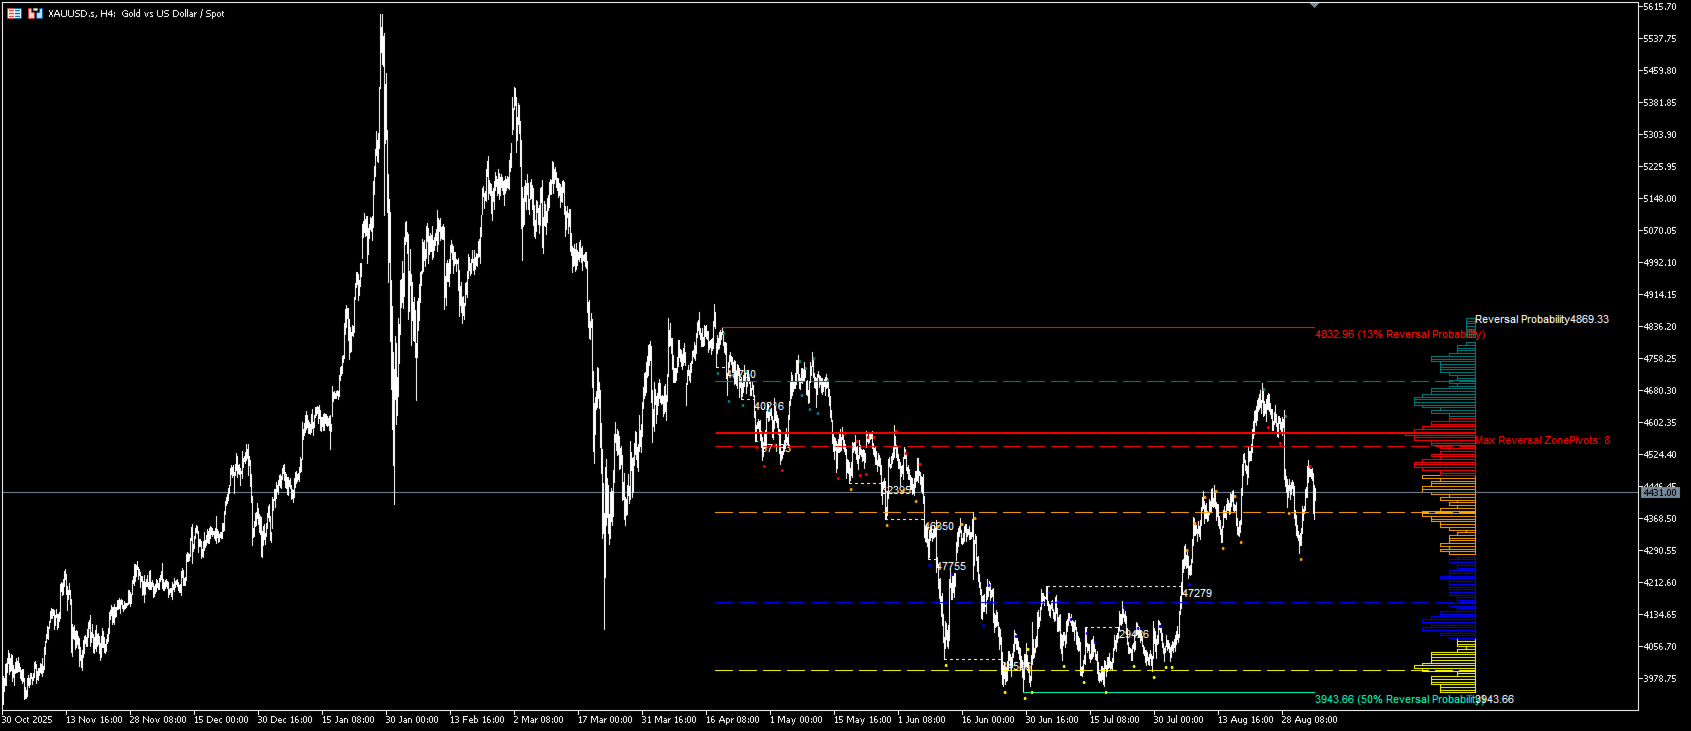
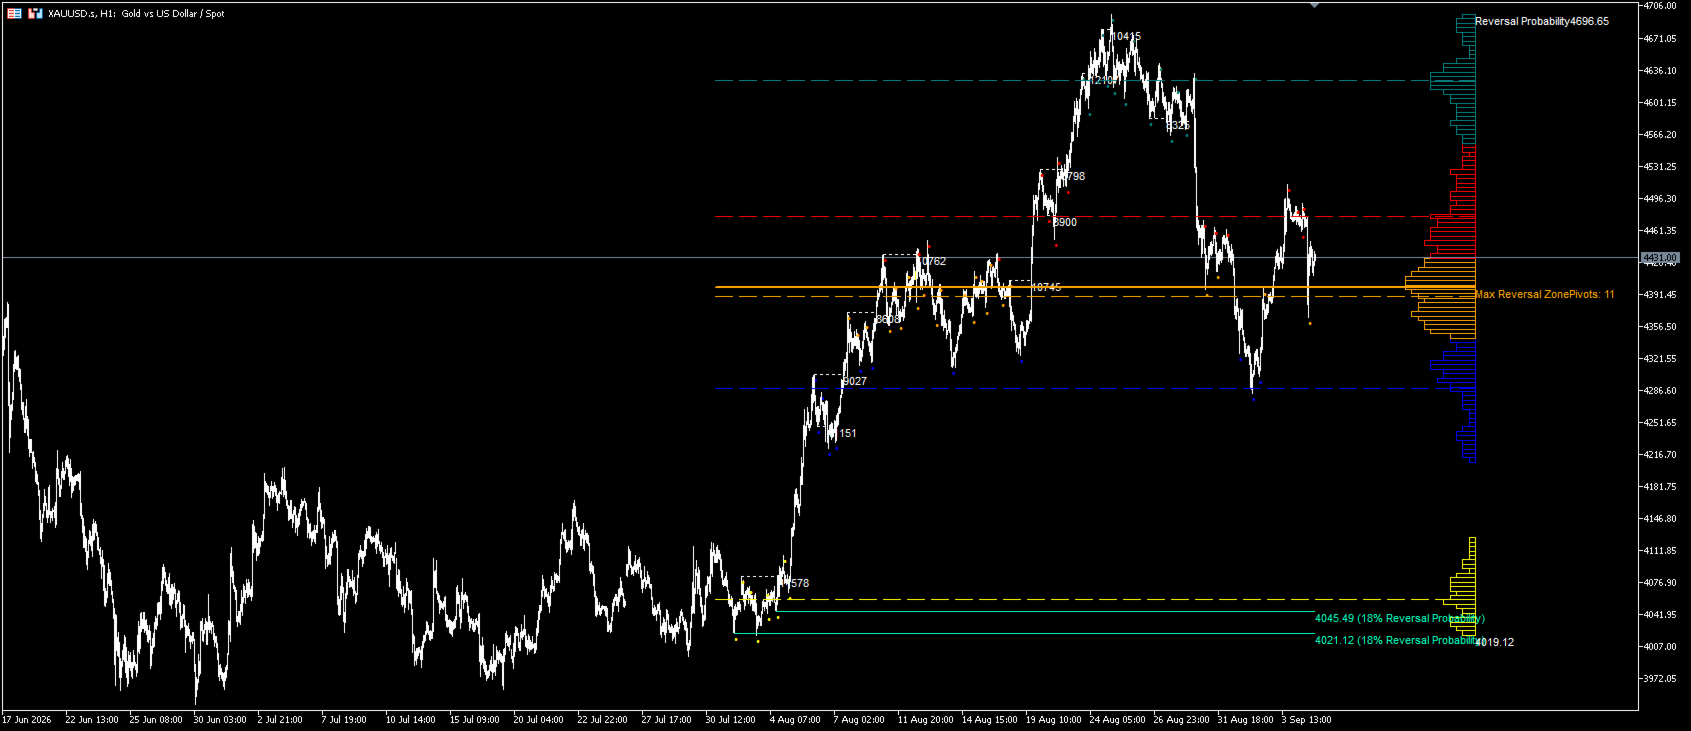
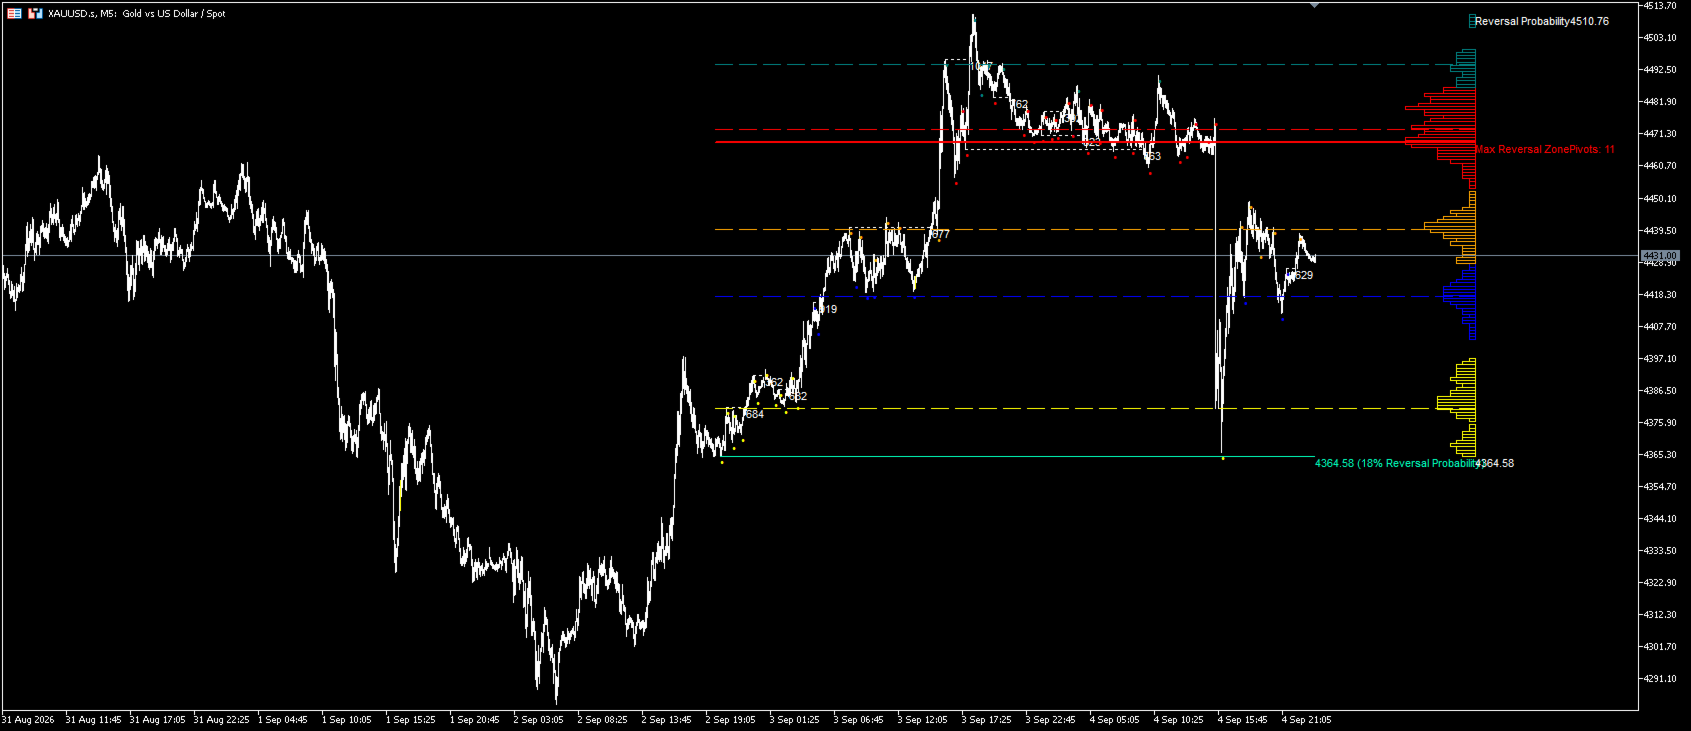
This indicator is a technical analysis visualization tool for MetaTrader 5. It identifies confirmed pivot highs and lows on historical bars, groups pivot prices with K-Means clustering, and draws an inverse distribution profile on the right side of the chart. The profile shows the density of historical pivot prices at different price levels. The indicator does not generate trading signals and does not execute trades.
Calculation
-
Pivot detection uses user-defined left and right bar counts.
-
Pivot points are stored in memory and trimmed by the stored pivots limit and calculation lookback.
-
K-Means clustering groups stored pivot prices. The number of clusters and optimization passes are user-defined.
-
The profile counts pivot points in price bins within the calculation lookback. The bin count is set by Profile Resolution, and smoothing is applied. The bin with the highest count is marked as the Point of Control (POC).
-
ATR-based filtering uses ATR Period and ATR Multiplier to reduce overlapping support and resistance lines. Lines become dashed after price breaks them.
Features
-
Inverse distribution profile on the right side of the chart. Width and offset are user-defined.
-
POC highlight and cluster colors.
-
K-Means cluster center reference lines.
-
Pivot-based support and resistance lines.
-
Optional pivot dot markers colored by cluster.
-
Optional count or density text labels.
-
Optional alerts when price reaches the POC or a selected density level. Alerts are off by default.
Inputs
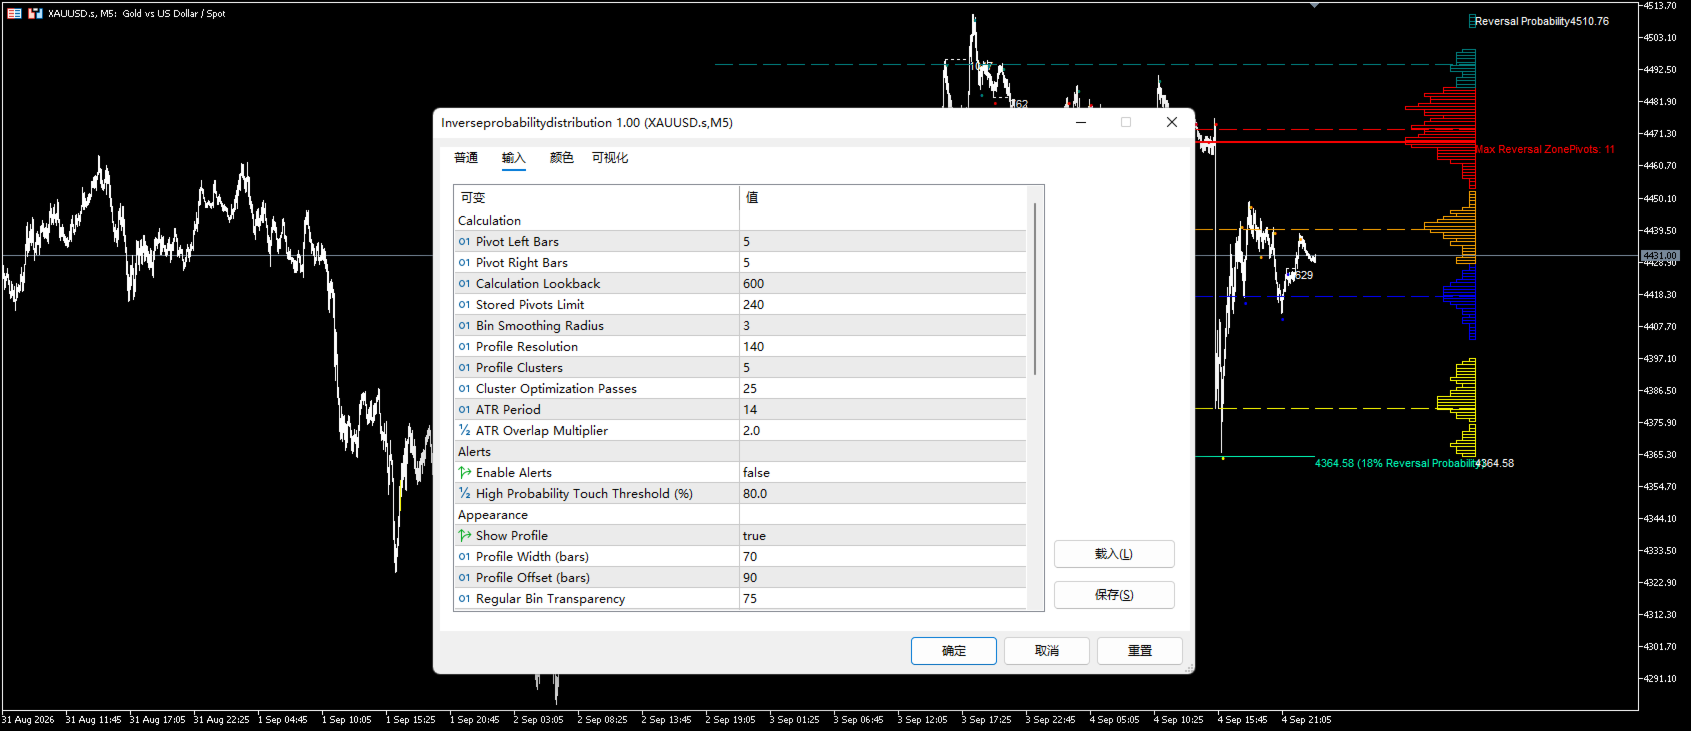
Pivot Left / Right Bars
Calculation Lookback
Stored Pivots Limit
Profile Resolution
Profile Clusters
Cluster Optimization Passes
ATR Period / Multiplier
Density Alert Threshold (%)
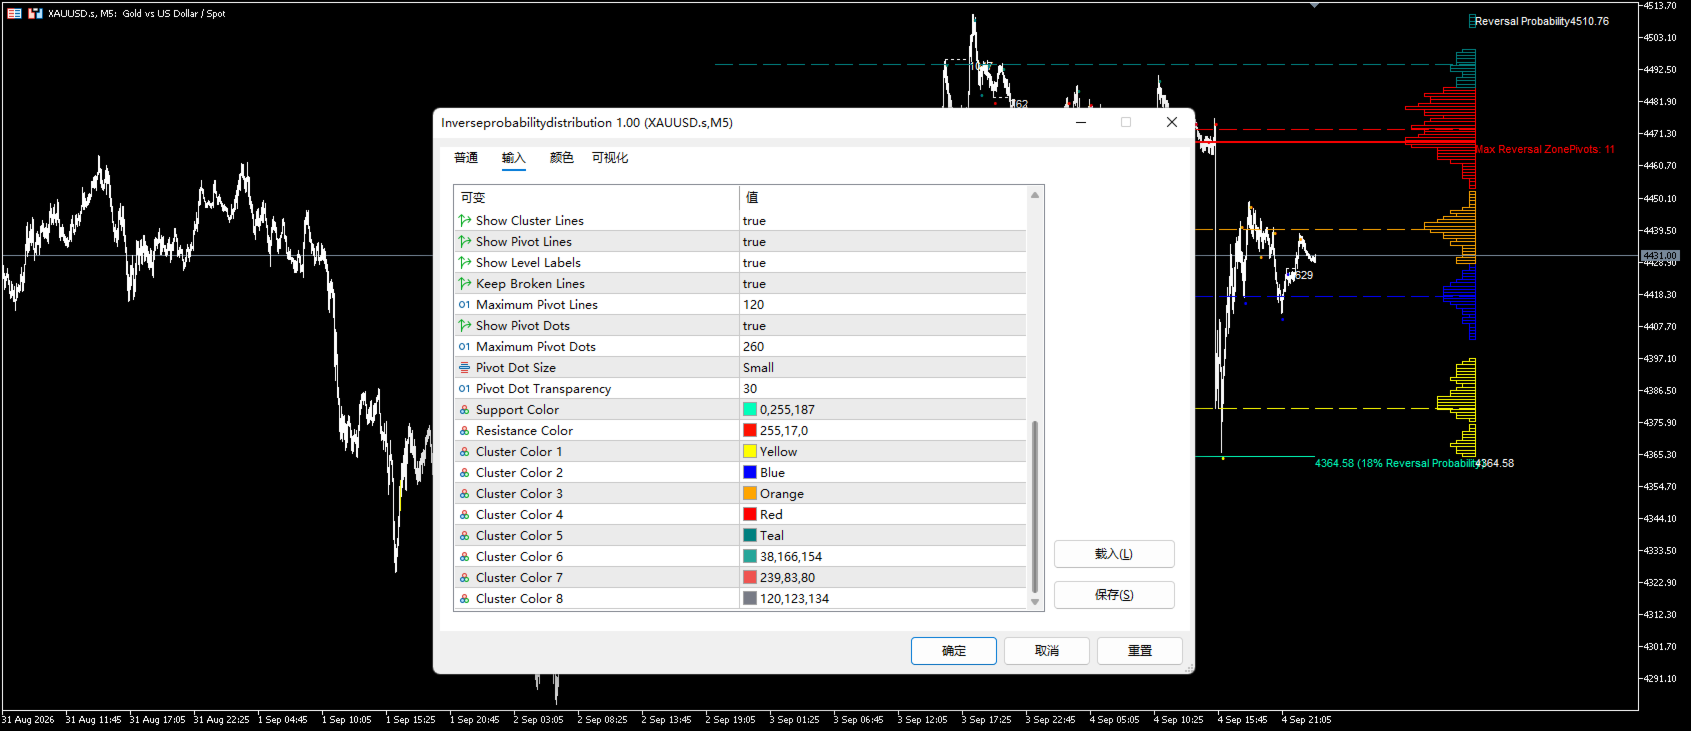
Appearance group: colors, transparency, line width, text mode, dot size
Usage
Place the indicator file in MQL5/Indicators, compile it, and attach it to a chart. Adjust Pivot Left/Right Bars and ATR Multiplier for the symbol. The profile is drawn on the right side of the chart. Longer bars indicate higher historical pivot density in that price range. The POC line marks the price level with the highest historical pivot density. Support and resistance lines are based on historical pivots. The indicator can be observed in the Strategy Tester or on a demo account before use.
Risk Notice
This indicator only visualizes historical price statistics. It does not provide investment advice and does not predict future price movement. High pivot density does not mean that price will reverse. All trading decisions are the user's responsibility.
Compatibility
Symbols: instruments available in MetaTrader 5.
Timeframes: M5 and higher are suggested. Very small timeframes may produce more pivot noise and reduce readability.