MiniBull Session SR MTF
- Göstergeler
-
Yusuf Levent Aksun
 20 yılı aşkın yazılım geliştirme, bulut mimarisi ve DevOps dönüşümü deneyimine sahip
Platform Mühendisi & AWS Sertifikalı Profesyonel.
Şu anda Londra'da World Wide Technology bünyesinde platform mühendisliği girişimlerini - Sürüm: 4.76
- Güncellendi: 15 Ekim 2026
- Etkinleştirmeler: 5
# MiniBull Session S/R · MTF VWAP · Auto
**A MetaTrader 5 indicator for intraday index and CFD traders who read the market through session structure, volume-weighted price, and multi-timeframe support/resistance.**
Version 4.51 · MT5 (MQL5) · Works on any chart timeframe
---
## What it is
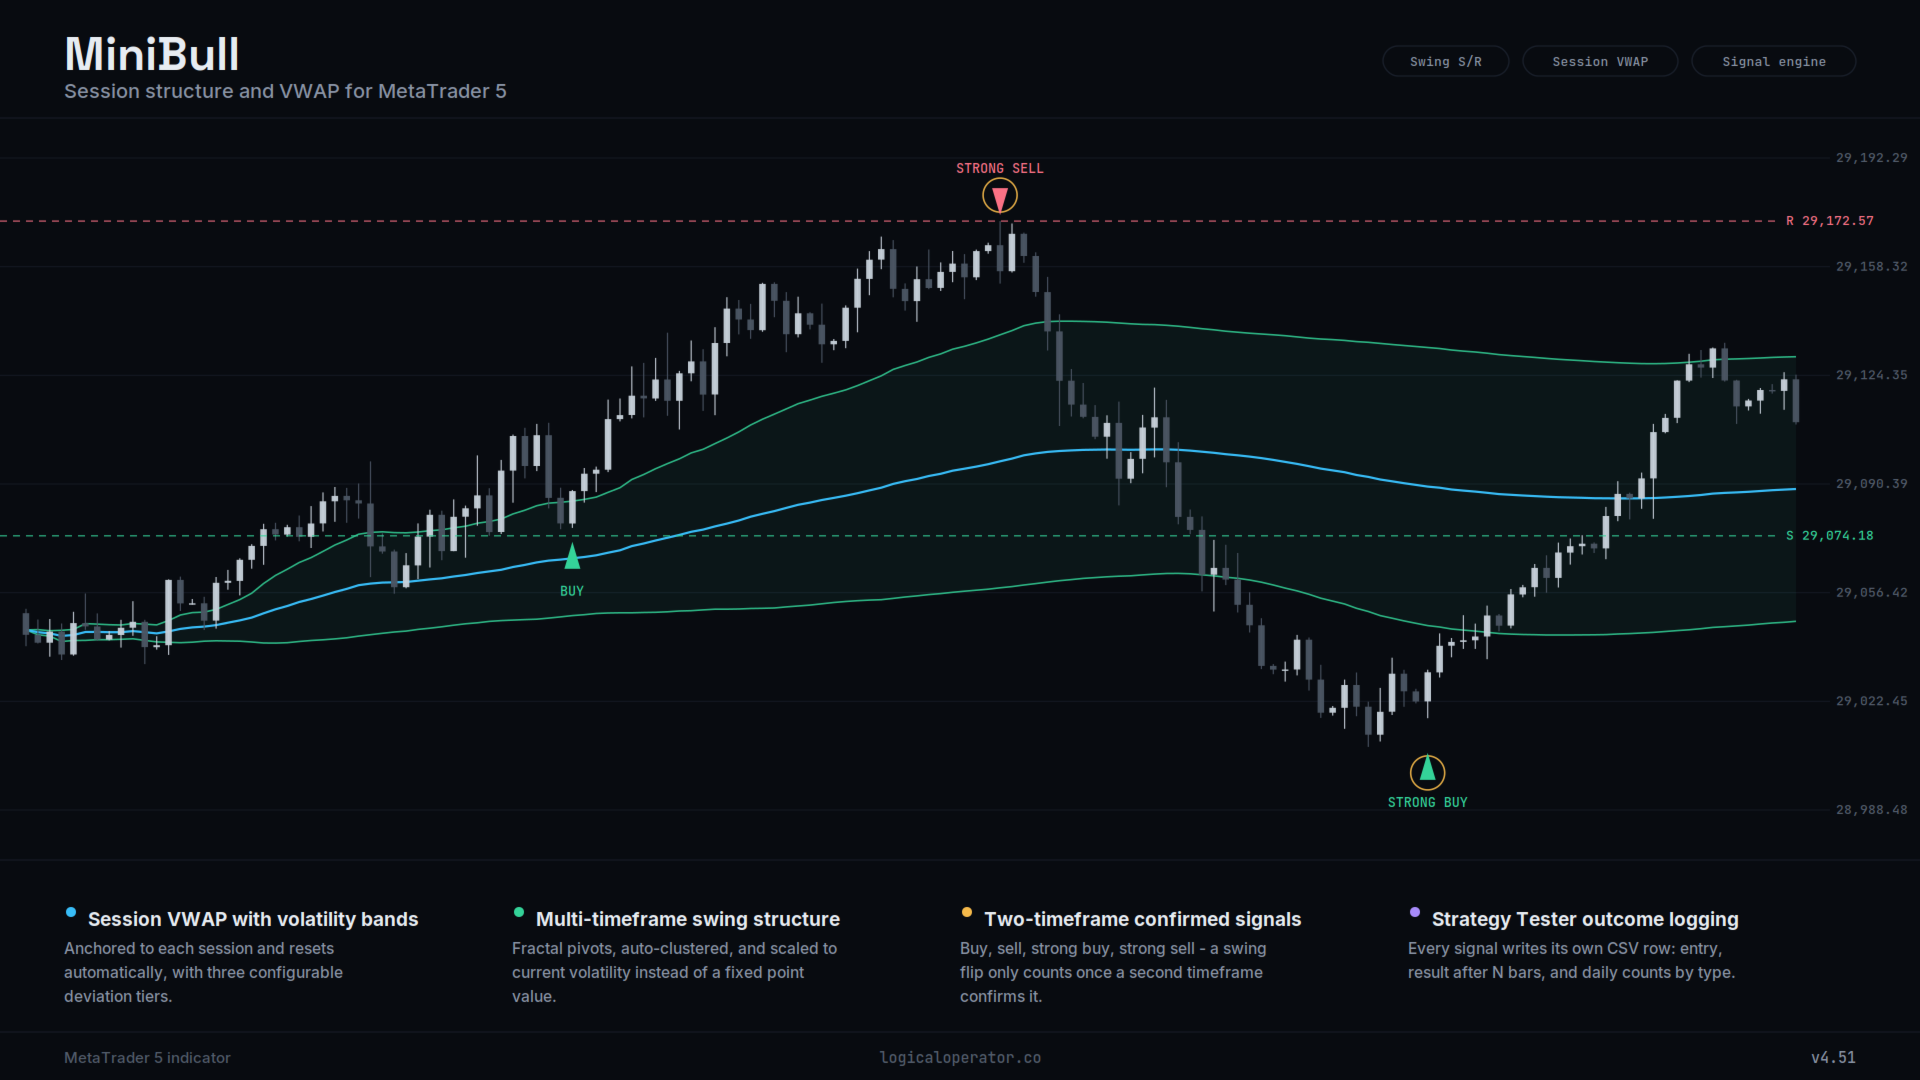
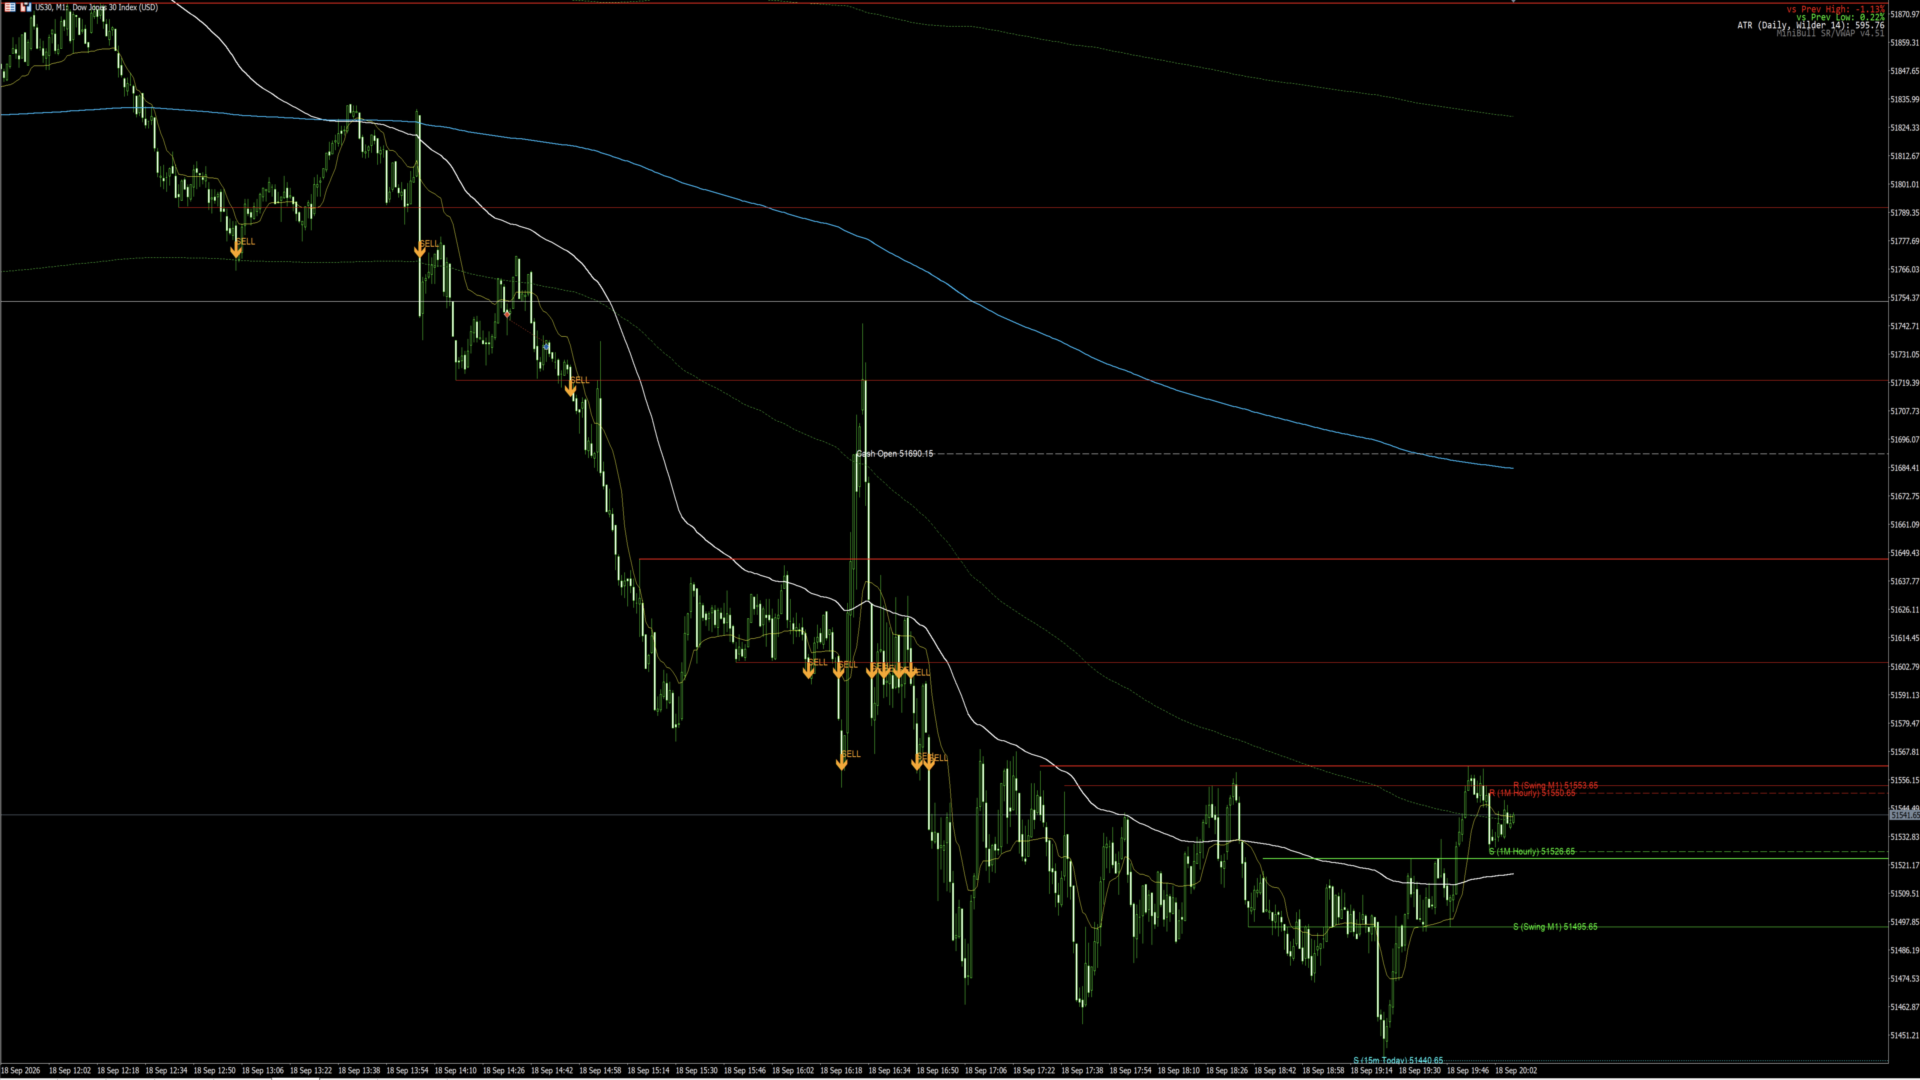
MiniBull Session S/R MTF VWAP Auto is an all-in-one context indicator built for people who trade indices (NAS100 and similar) intraday, around session opens, prior-day levels, and volume-weighted fair value. Instead of stacking five or six separate indicators on a chart, it combines the pieces intraday traders actually use together — session levels, a proper session VWAP with volatility bands, support/resistance across several timeframes, an auto-clustering swing structure, and a confirmed signal engine — into one tool, with every threshold scaled to the instrument's own volatility rather than a fixed number of points.
It is not a black-box "buy here, sell here" system. It draws the structure a discretionary trader already looks for, and optionally raises a flagged, two-timeframe-confirmed signal when that structure actually breaks — so the trader (or an EA built on top of it) can decide what to do with that information.
## Who it's for
- Intraday and session traders on index CFDs (NAS100, US30, etc.) and similar 23-hours instruments
- Traders who build their read around VWAP, prior-day levels, and swing support/resistance rather than a single moving-average crossover
- Anyone who wants to *measure* a signal idea's historical hit rate in Strategy Tester before trusting it, rather than eyeballing a chart
## Core features
### Session & previous-day levels
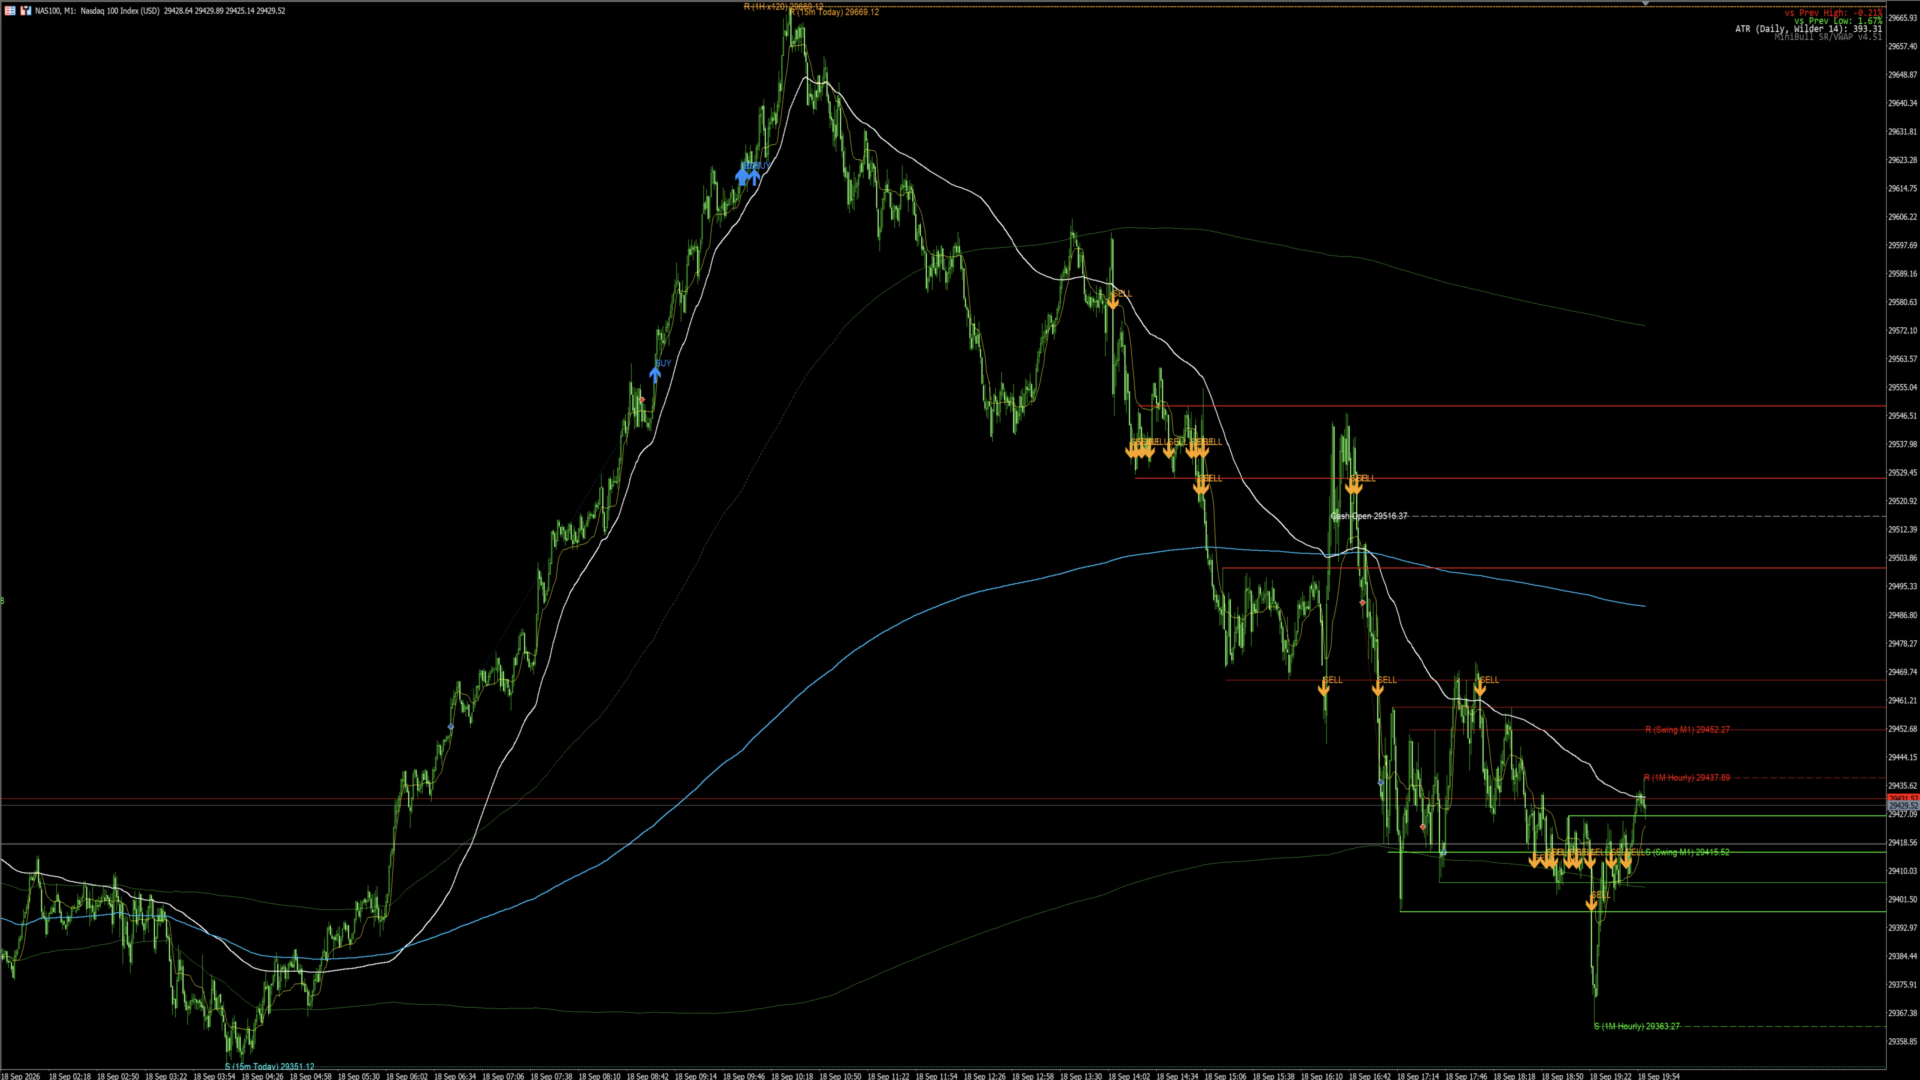
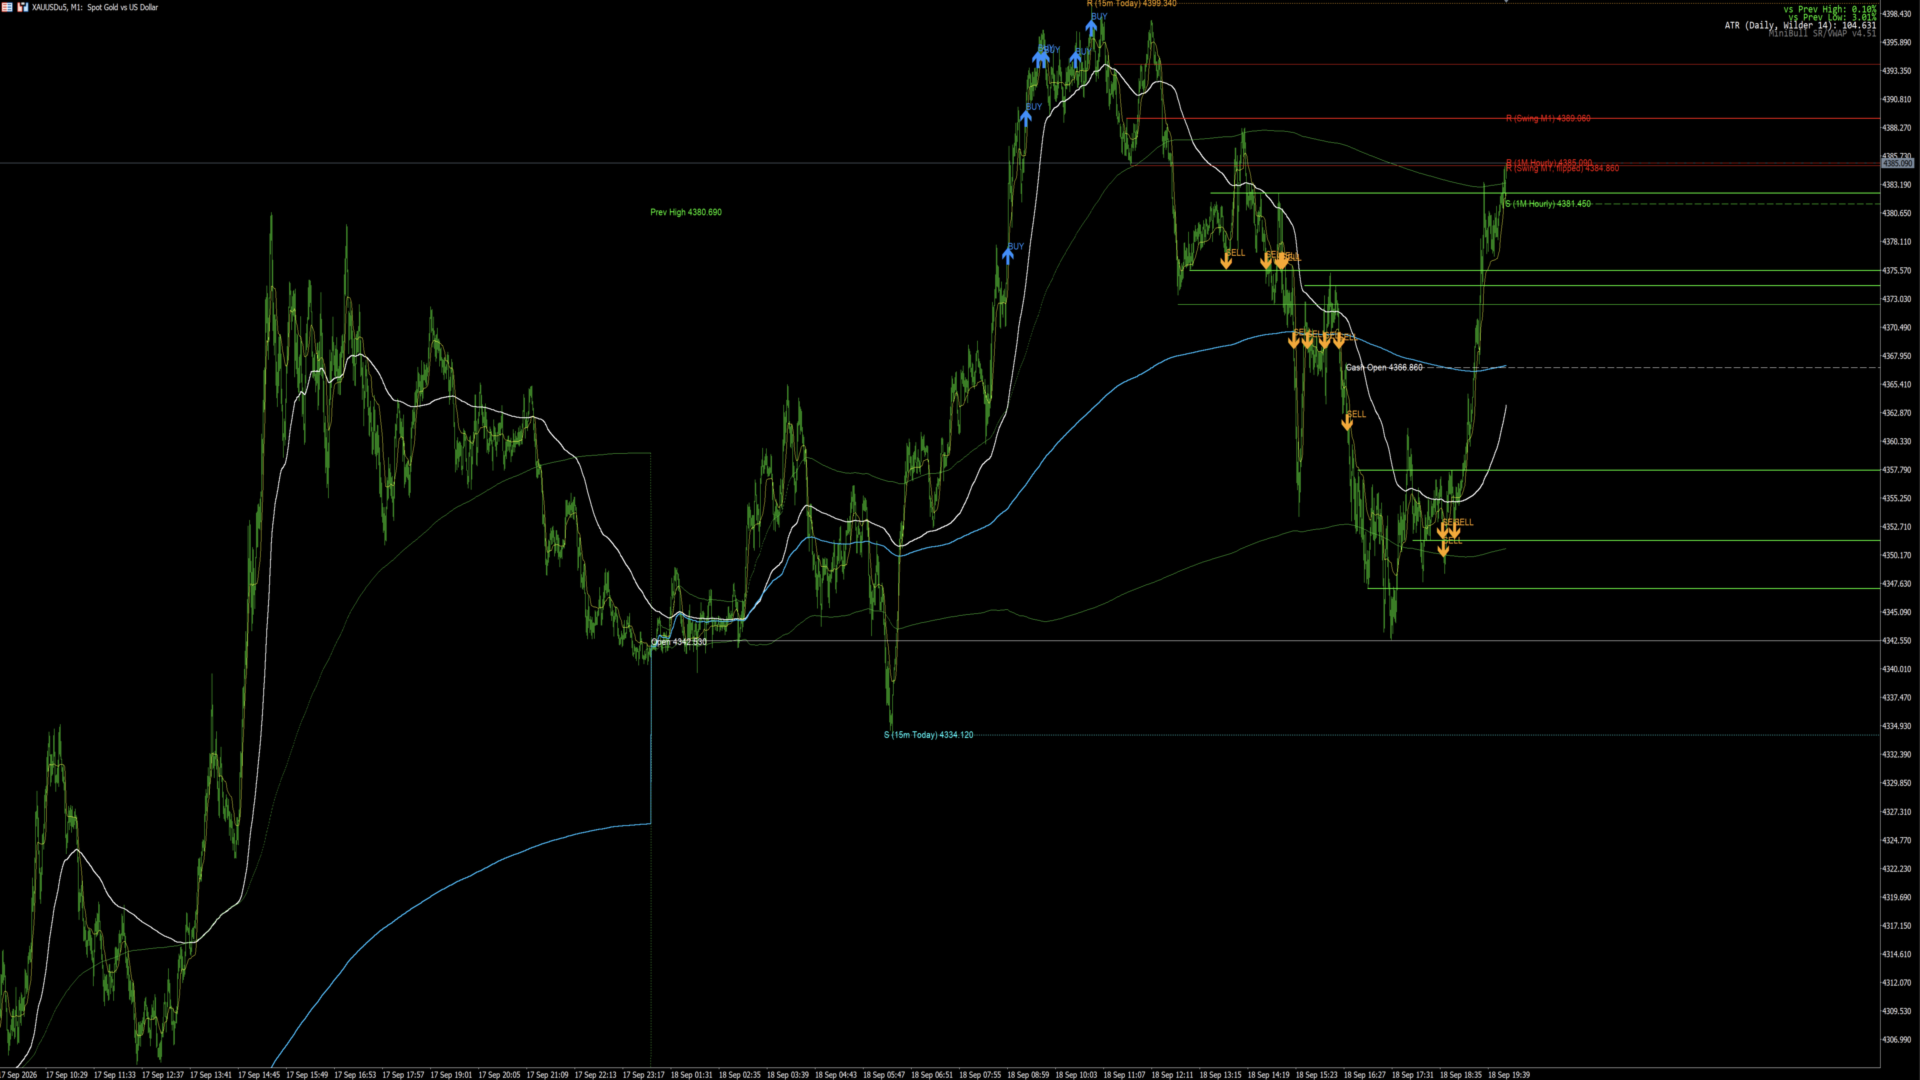
Previous day's high/low, the day's open, and (in standard instrument mode) the cash/regular-session open are drawn automatically, with a small on-chart panel summarizing where price sits relative to each. The broker's server-time-to-UTC offset is auto-detected so session boundaries line up correctly without the trader having to work out the broker's timezone by hand (a manual fallback offset is available for environments — like some Strategy Tester runs — where auto-detection isn't possible).
### Session-anchored VWAP with volatility bands
A proper volume-weighted average price, anchored to the same session boundary as the rest of the indicator (not literal midnight) and resetting automatically each session. Configurable price source (default HLC3) and volume source (tick volume or real volume where the feed provides it). Up to three standard-deviation band tiers are available (only the innermost is on by default), each with its own multiplier and color, so the trader can see at a glance whether price is inside, at the edge of, or has broken outside its normal session range.
### Multi-timeframe support/resistance
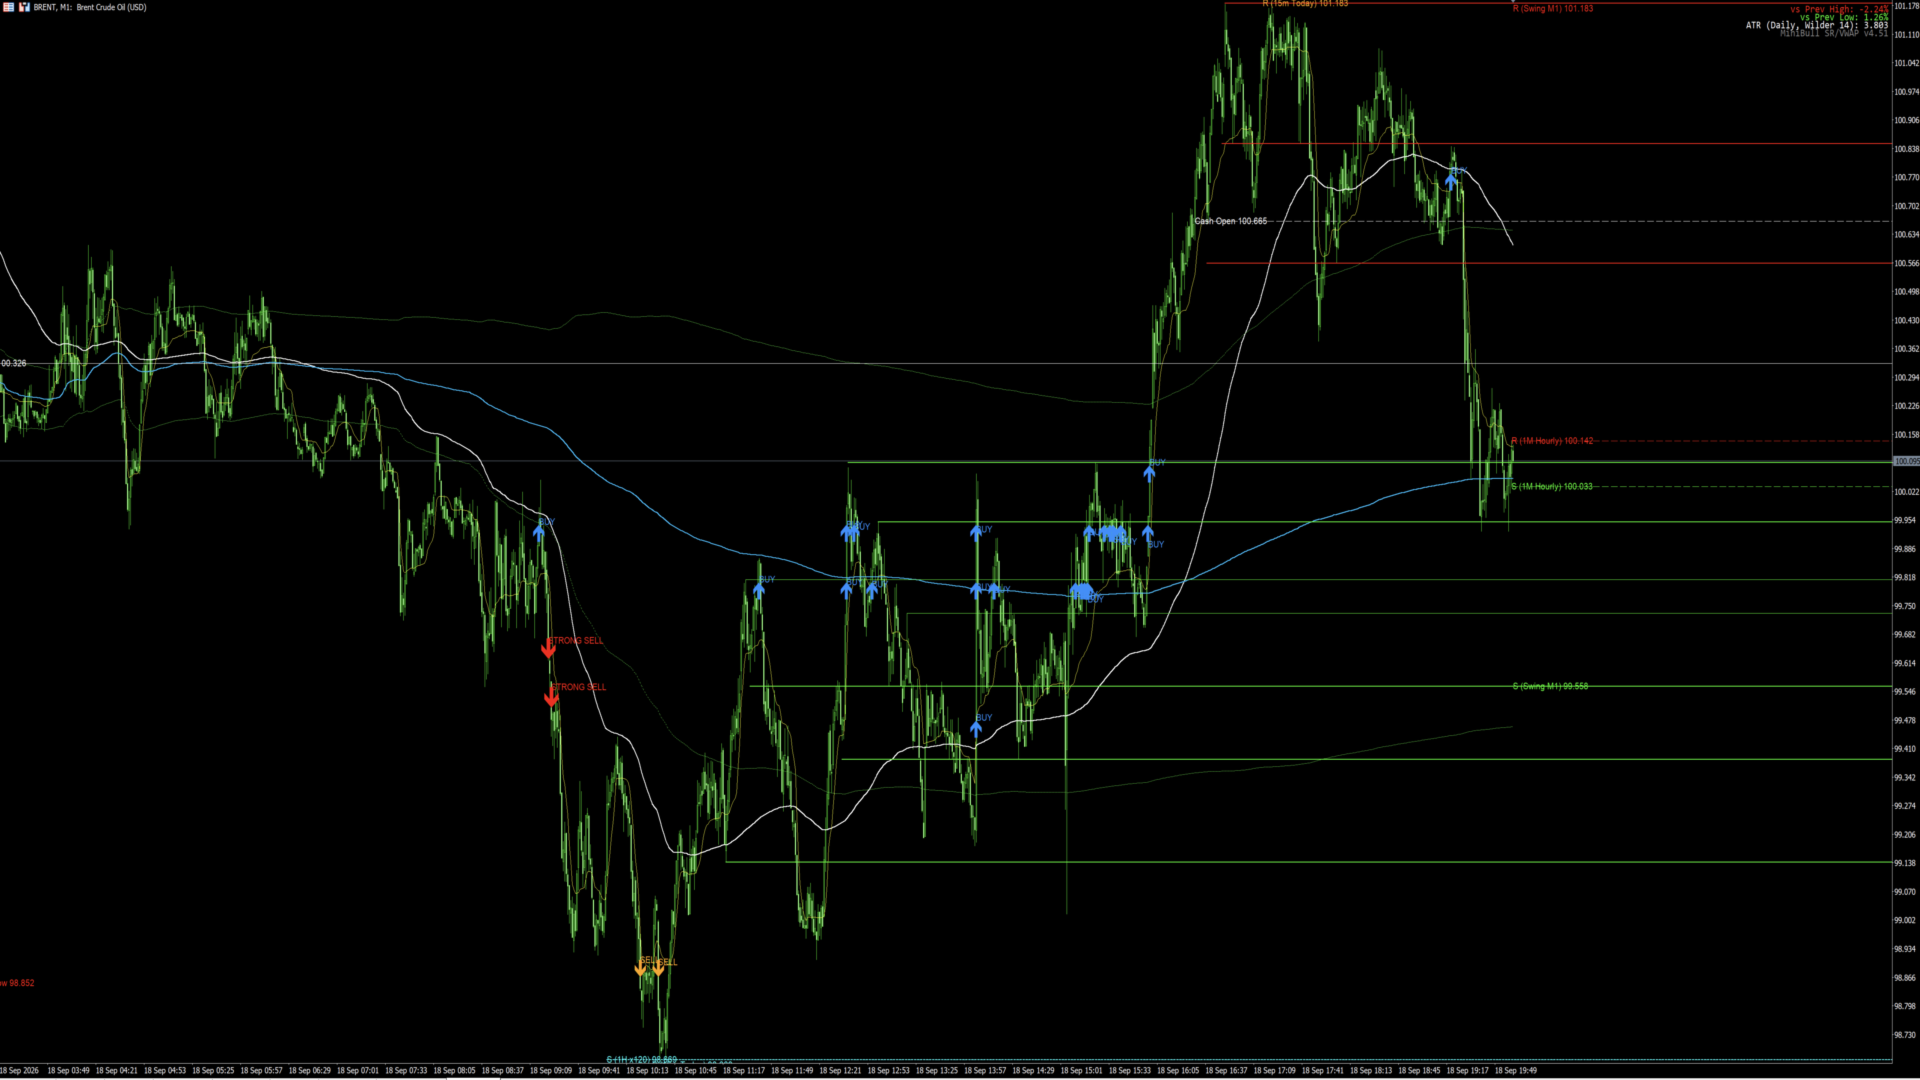
Independent, separately toggleable S/R layers at 4H (roughly the last 4 weeks), 1H (roughly the last week), 15M (current day), and optional 30M/5M/1M layers, plus a 1-minute "hourly" layer that resets and rebuilds every hour from that hour's own bars. Each layer is meant to answer a different question — "where did this instrument turn on the daily chart" versus "where did it turn in the last hour" — without the trader having to flip timeframes to see both.
### Swing structure (fractal pivots, auto-clustering, volatility-scaled)
A separate, more selective structure layer built from fractal pivots (a configurable number of bars confirming a high or low on each side), clustered together when they sit within a tolerance of each other, and capped to a small number of lines per side so the chart only shows the levels that actually matter. The clustering tolerance auto-scales to the instrument's own ATR by default, so the same settings behave sensibly on a low-volatility symbol and a high-volatility one, rather than needing a different fixed point value for each.
### Buy / Sell / Strong Buy / Strong Sell signals
When a swing level's role flips — a resistance level giving way to become support, or vice versa — a signal fires. Three things make this more than a raw crossover:
- **Two-timeframe confirmation.** The flip is detected on M1, but is only labeled *strong* if a corresponding M5 level flipped the same direction within a configurable recent window. A signal that isn't confirmed still fires, just without the "strong" qualifier, so the trader sees both the raw structural break and how well-supported it is.
- **VWAP breakout filter.** A signal is only accepted once price has actually broken outside the VWAP's innermost volatility band in the signal's own direction — a flip that happens while price is still inside that band (on either side of VWAP) is rejected outright.
- **Non-repainting, any-timeframe visibility.** Signal detection always runs on its own independent M1 data, regardless of which timeframe chart the indicator happens to be attached to — so the same BUY/STRONG SELL/etc. arrows show up whether the chart is on M1, M5, H1, or H4. Every check only ever looks at bars that have already closed; nothing is revised after the fact. On a fresh attach, the indicator also backfills signal history over its full lookback window, so a trader doesn't start with a blank slate.
### Strategy Tester outcome logging
For traders who want to measure a signal's track record rather than assume it, the indicator can write two CSV files (opt-out via a single input) to the shared MetaTrader Common\Files folder:
- **A per-signal outcome log** — one row per BUY/SELL/STRONG BUY/STRONG SELL, written once a configurable number of M1 bars (default 15) have passed: entry price, exit price, the move in points, a direction-only success flag, and the maximum favorable and adverse excursion reached along the way.
- **A daily signal-count summary** — total signals per trading day, broken down by all four signal types, so a trader can see how signal frequency and the strong/normal mix vary day to day.
Both logs cover the entire tested history (not just signals seen while the chart was open live), and both are correct regardless of which timeframe or tick model Strategy Tester is run with — the indicator dynamically widens its own data window so no bar is silently skipped even under a coarse tick model.
### Adaptive Moving Average (KAMA-style) and Wilder ATR panel
An adaptive moving average pair (two configurable periods, with configurable fast/slow smoothing constants) for a lower-noise read on trend direction, plus an on-chart Wilder ATR readout for a quick sense of the day's realized range versus normal.
## How to read the signals
1. A swing high or low forms (confirmed once enough bars have closed on each side).
2. Price later closes through it, flipping its role (resistance → support = bullish, support → resistance = bearish).
3. The flip is only accepted as a signal if price has also broken outside the VWAP's inner volatility band in that same direction.
4. The arrow is labeled **BUY**/**SELL** on its own, or **STRONG BUY**/**STRONG SELL** if the M5 structure flipped the same way within the confirmation window.
None of this trades on its own — it's context and a filtered alert, meant to be read alongside price action or wired into an EA.
## Using it in Strategy Tester
The indicator can be run under "Indicator Testing" mode to backtest signal frequency and hit rate over historical data. For the closest match to live M1 signal timing, test on the M1 chart period with "Every tick" or "Every tick based on real ticks" modeling. Coarser timeframes and lighter tick models (1-Minute OHLC, Open prices only) also produce correct results — the indicator's M1 data fetch dynamically covers however large a gap exists between simulated ticks — but will run considerably faster if tick-level precision on other timeframes isn't needed for the task at hand.
## Requirements
- MetaTrader 5
- M1 and M5 historical data available for the tested/traded symbol (the terminal needs this in its history cache; if it's missing, open an M1 and M5 chart for the symbol once to let MT5 download it)
- Works on any symbol; volatility-scaled settings mean it doesn't need re-tuning per instrument, though lookback/tolerance inputs remain adjustable
---
*MiniBull is part of the [Logical Operator](https://logicaloperator.co) suite of MetaTrader 5, TradingView, and cTrader tools.*