MiniBull Session SR MTF

  • インディケータ
  • Yusuf Levent Aksun
    Yusuf Levent Aksun
    プラットフォームエンジニア & AWS認定プロフェッショナル。ソフトウェア開発、クラウドアーキテクチャ、
    DevOpsトランスフォーメーションにおいて20年以上の経験を持つ。
    現在、ロンドンのWorld Wide Technologyにてプラットフォームエンジニアリングを推進。
    スケーラブルなインフラソリューションを構築し、開発チームがより迅速かつ確実に
    デリバリーできる環境を実現。
    🔹 AWS Certified Solutions Architect – Professional
  • バージョン: 4.20
  • アップデート済み: 31 8月 2026
  • アクティベーション: 5
# MiniBull Session S/R MTF

**Version:** 4.0
**Platform:** MetaTrader 5 (custom indicator, `.mq5`)
**Type:** Visual reference overlay — no trading logic, no signals, no orders
**File:** `MiniBull_Session_SR_MTF.mq5`

## Overview

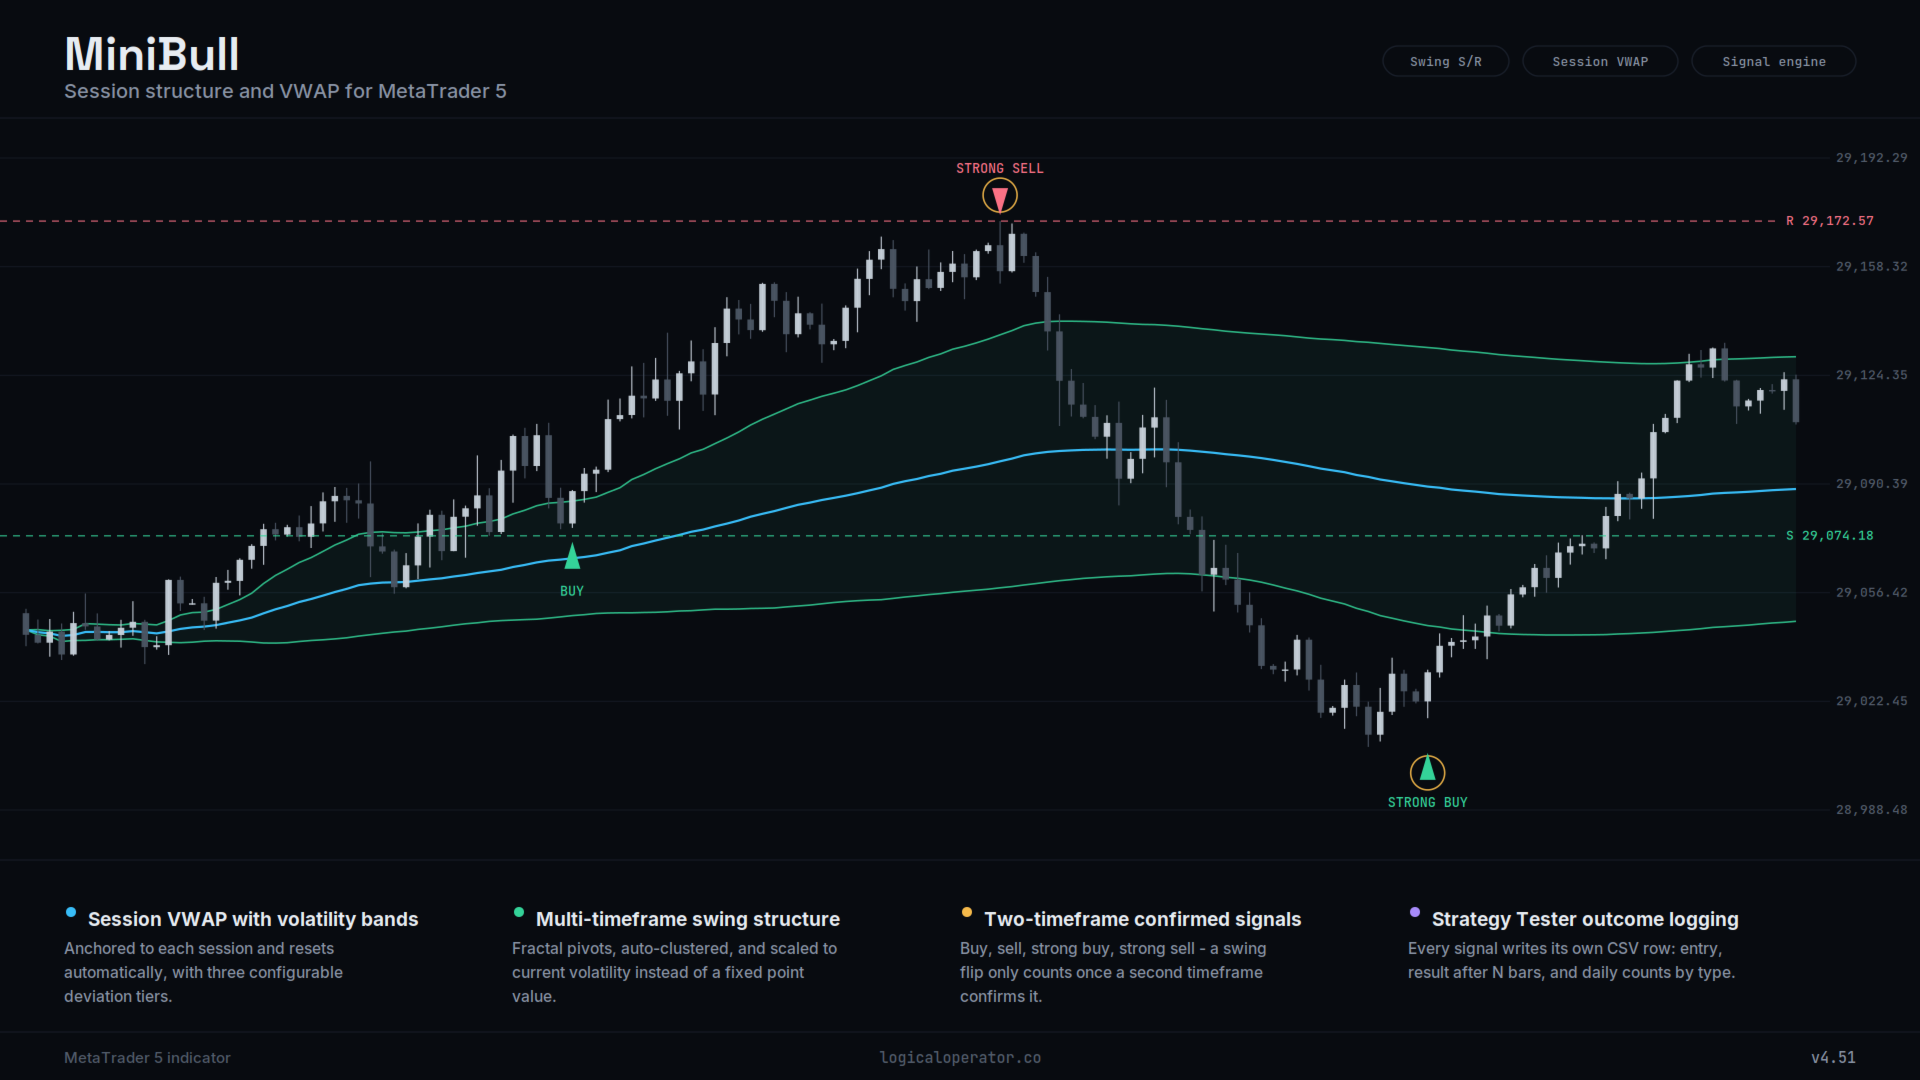
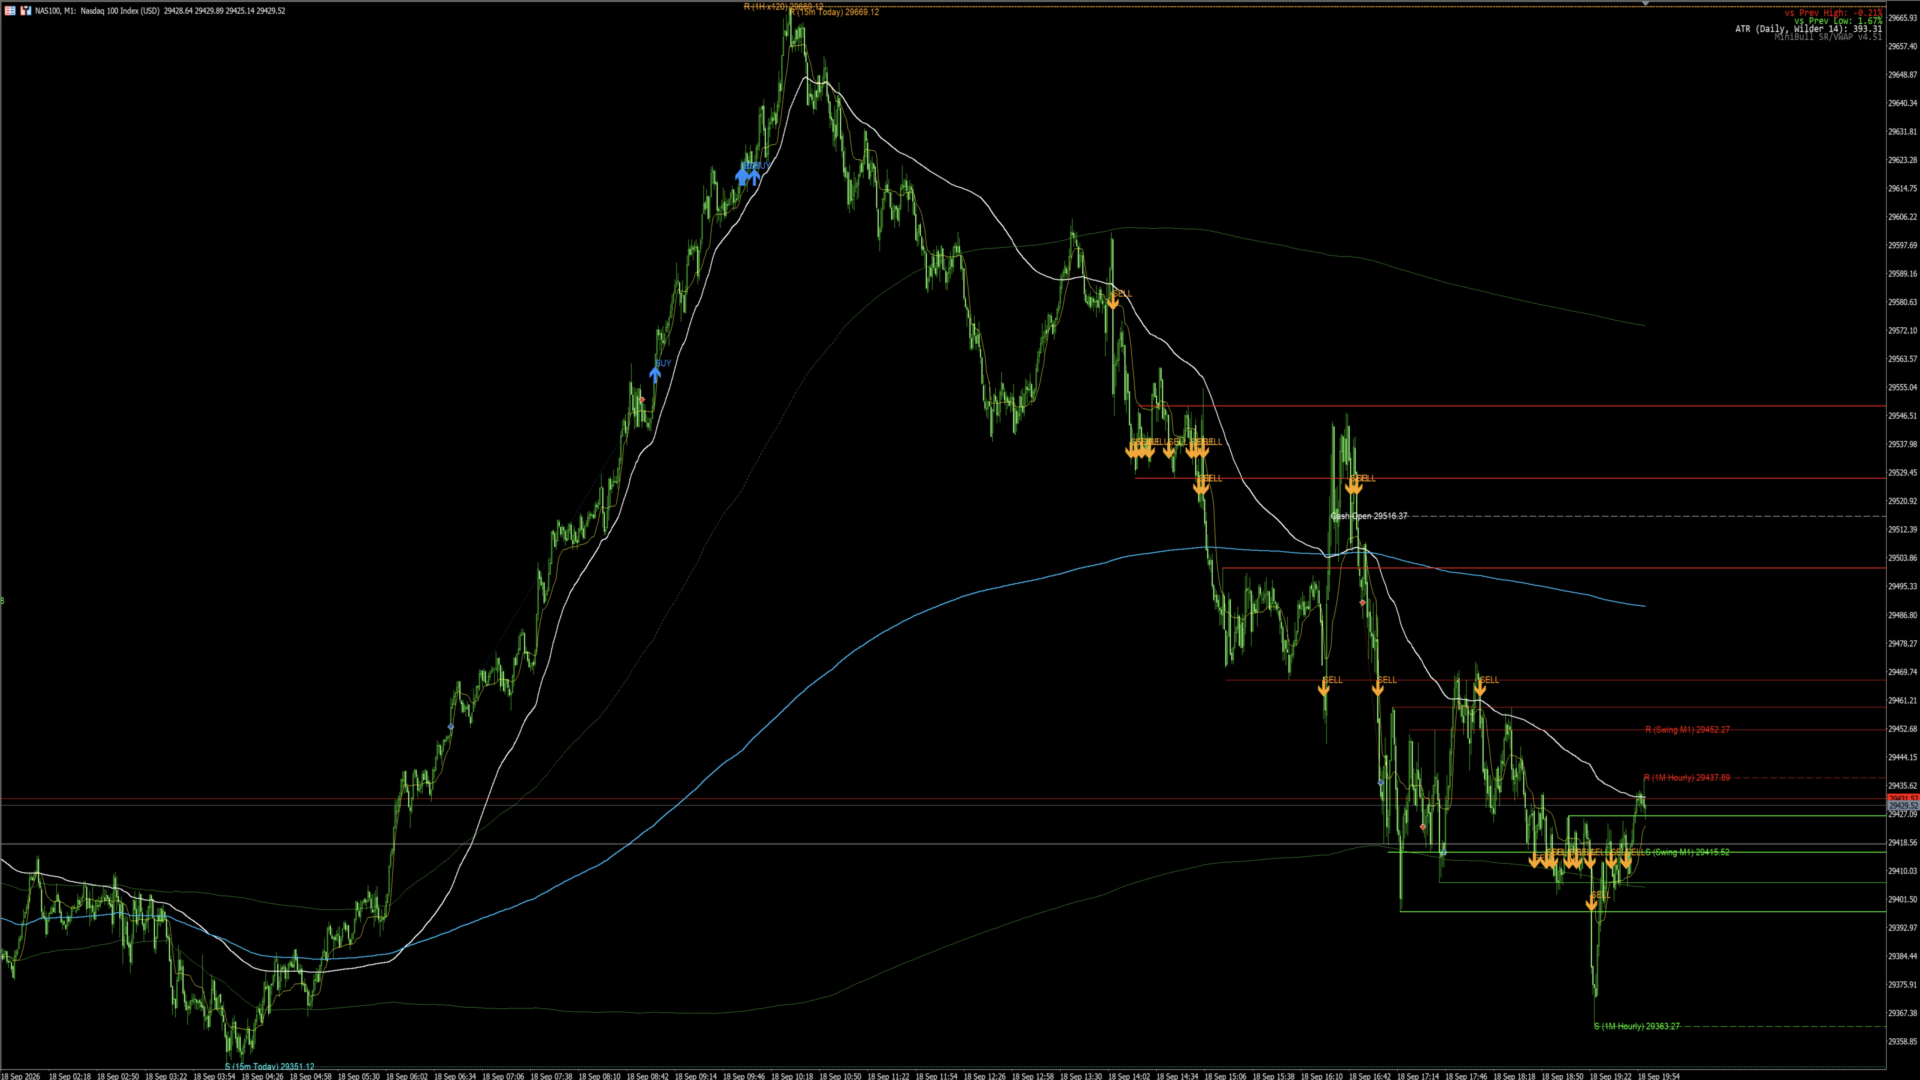
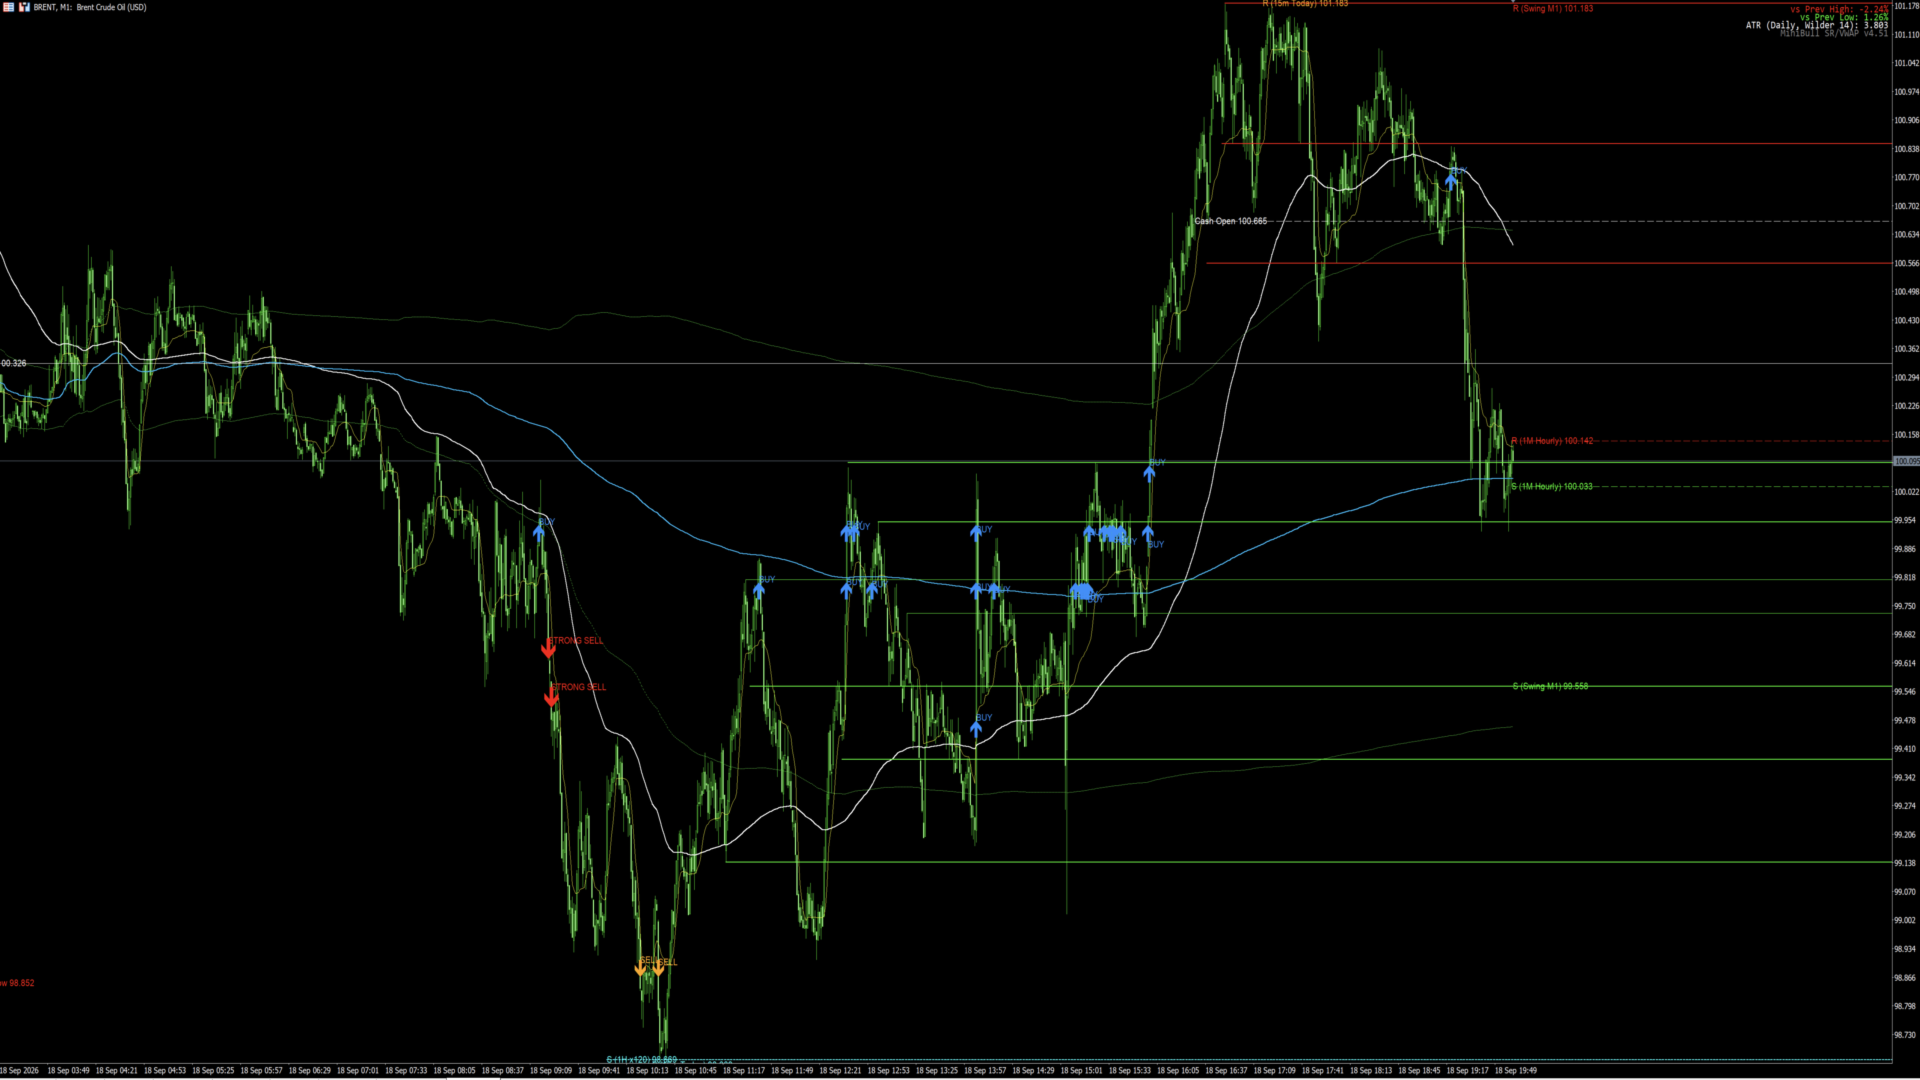
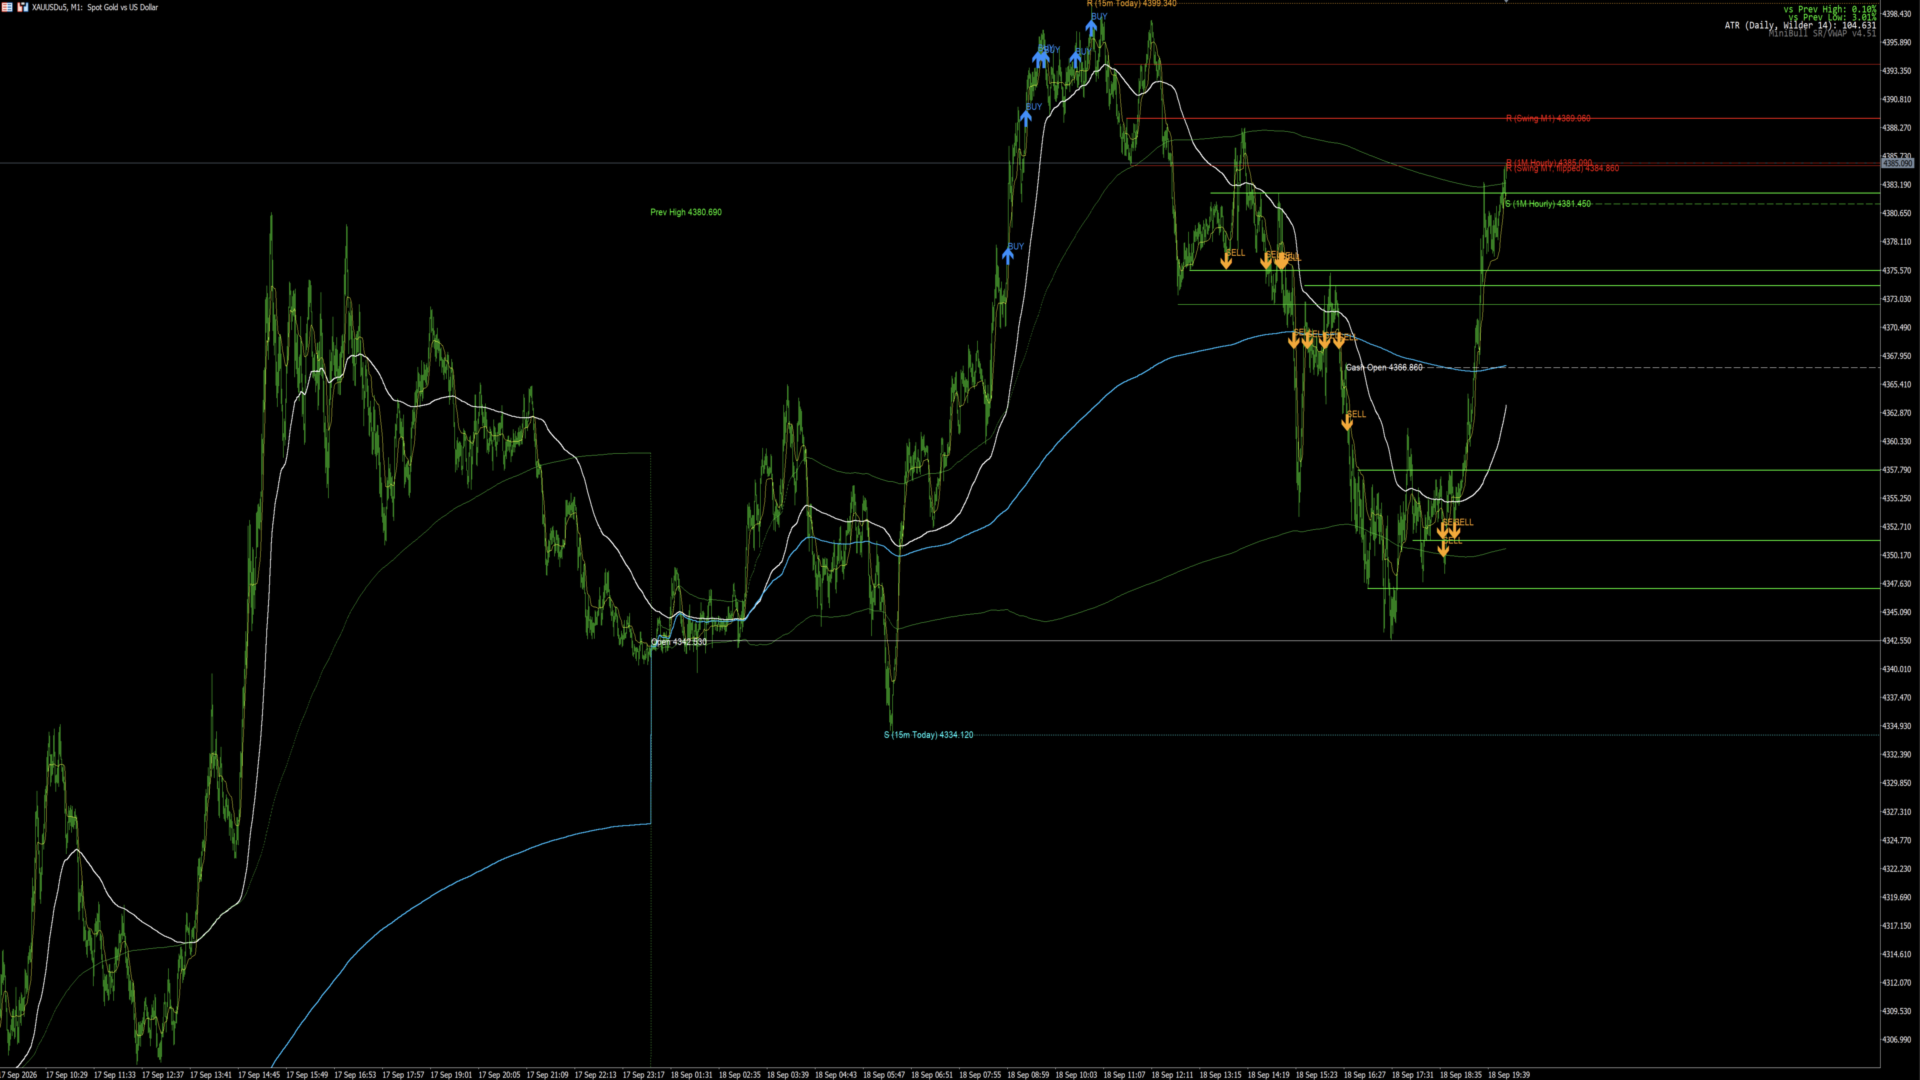
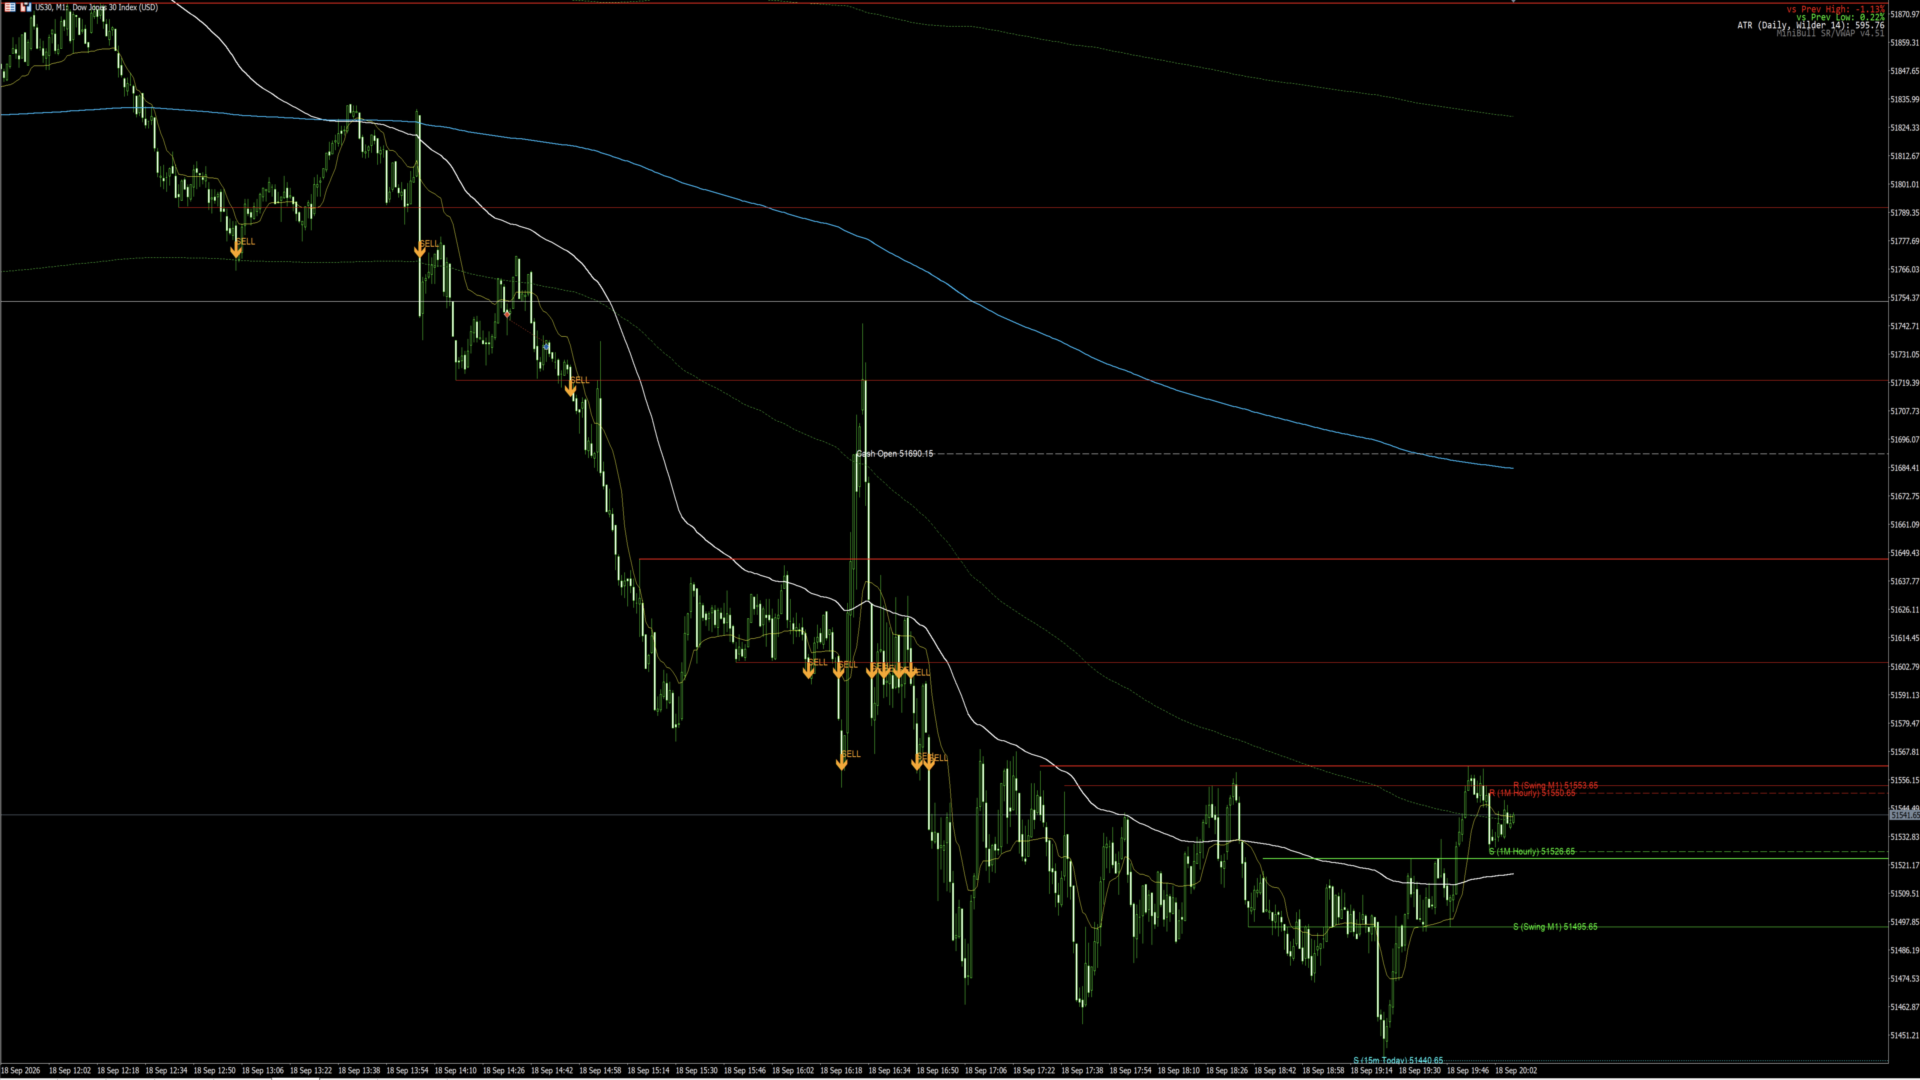
MiniBull Session S/R MTF is a multi-timeframe support/resistance and session-level
overlay for MT5. It draws the previous trading session's high/low, the current
session's open, the US cash market open, rolling support/resistance from three
higher timeframes (4H / 1H / 15M-intraday), two Kaufman Adaptive Moving Averages
(KAMA), and a compact info panel with % distance to key levels and the Daily
Wilder ATR — all computed automatically, with no manual timezone configuration
required.

It is a from-scratch MQL5 implementation inspired by a "Session & Prev-Day
Levels" style TradingView (Pine Script) tool, adapted and extended for MT5's
object/event model.

## What it draws

| Element | Style | Notes |
|---|---|---|
| Previous session High | Solid green line + label | Anchored at the actual bar that set the high |
| Previous session Low | Solid red line + label | Anchored at the actual bar that set the low |
| Current session Open | Solid white line + label | Drawn at the first bar of the current session |
| US cash open (09:30 NY) | Dashed white line + label | Standard instrument mode only |
| R / S (4H, x120 bars) | Solid, width 3 | ~4 weeks lookback by default |
| R / S (1H, x120 bars) | Dashed, width 2 | ~1 week lookback by default |
| R / S (15M, current day) | Dotted, width 1 | Rebuilt every session, current day only |
| R / S (30M, x120 bars) | Dash-dot, width 1 | **Off by default** — enable from inputs; ~2.5 days lookback |
| R / S (5M, x120 bars) | Dash-dot-dot, width 1 | **Off by default** — enable from inputs; ~10 hours lookback |
| R / S (1M, x120 bars) | Dotted, width 1 (distinct colors) | **Off by default** — enable from inputs; ~2 hours lookback |
| AMA #1 / AMA #2 | Solid lines (white / yellow by default) | Kaufman KAMA, periods configurable (default 200 / 9) |
| Info panel | Top-right corner | % vs Prev High, % vs Prev Low, Daily ATR (Wilder) |

Every S/R line is anchored **at the exact candle that produced the high or low**,
not at the edge of the lookback window — so a level that formed 3 days into a
20-day scan starts exactly 3 days back, not 20. Resistance and support within
the same timeframe are tracked independently, since the bar that set the high is
rarely the same bar that set the low.

Line thickness decreases with timeframe: 4H (3) → 1H (2) → 15M (1), on top of
the existing solid / dashed / dotted style distinction, so the timeframe
hierarchy is visible at a glance even in monochrome.

## Session logic

- **Standard mode**: a new "trading day" begins at **18:00 New York time**
  (the standard forex/CFD rollover), matching how most retail platforms define
  a trading session for FX and metals.
- **Brent mode**: a new "trading day" begins at **00:00 UTC** (fixed), which
  suits energy/futures-style instruments that don't follow the FX rollover.
- Weekend gaps are handled naturally: since no new session boundary occurs
  while the market is closed, the session that was open at Friday's close
  simply continues through the gap into Monday, exactly as a trader would
  expect.

## Timezone handling (fully automatic)

- The broker server → UTC offset is **auto-detected at runtime** by comparing
  `TimeGMT()` (the PC's real UTC clock) against `TimeTradeServer()` (the
  broker's server clock). This works regardless of the trader's own location
  or which broker/server is in use — it only requires the PC's own clock to be
  correctly set, which is standard on any modern OS.
- US Daylight Saving Time is computed from the **actual US DST calendar rule**
  (2nd Sunday of March → 1st Sunday of November), so New York's UTC offset is
  always correct for the current year without ever needing a manual update.
- A manual fallback offset input exists only for edge cases where `TimeGMT()`
  is unavailable, such as the Strategy Tester.

## Inputs

**Session & Prev-Day Levels**
- `InpShowSessionLevels` — show/hide prev high/low + session open
- `InpInstrumentMode` — `Standard` (NY rollover) or `Brent` (00:00 UTC rollover)
- `InpShowCashOpen` — show the 09:30 NY cash-open marker (Standard mode only)
- `InpShowSessionPanel` — show/hide the info panel

**Timezone**
- `InpAutoDetectBrokerOffset` — auto-detect broker↔UTC offset (recommended, default on)
- `InpManualBrokerOffsetHours` — fallback offset, used only if auto-detect is off or fails

**Support/Resistance**
- `InpShowSR4H` / `InpLookback4H` — 4H S/R on/off + lookback in bars (default 120 ≈ 4 weeks)
- `InpShowSR1H` / `InpLookback1H` — 1H S/R on/off + lookback in bars (default 120 ≈ 1 week)
- `InpShowSR15M` — 15-minute intraday S/R on/off (always scoped to the current session)
- `InpShowSR30M` / `InpLookback30M` — **optional, off by default.** Rolling 30-minute S/R, same model as 4H/1H (default lookback 120 ≈ 2.5 days)
- `InpShowSR5M` / `InpLookback5M` — **optional, off by default.** Rolling 5-minute S/R (default lookback 120 ≈ 10 hours)
- `InpShowSR1M` / `InpLookback1M` — **optional, off by default.** Rolling 1-minute S/R (default lookback 120 ≈ 2 hours)

**Adaptive Moving Average**
- `InpShowAMA` — show/hide both AMA lines
- `InpAmaPeriod1` / `InpAmaPeriod2` — KAMA periods (default 200 / 9)
- `InpAmaFastEMA` / `InpAmaSlowEMA` — KAMA smoothing-constant bounds (default 2 / 30)
- `InpAmaColor1` / `InpAmaColor2` — line colors

**Wilder ATR**
- `InpShowATRPanel` — show/hide the ATR row in the panel
- `InpAtrLength` — ATR period (default 14). **ATR is always computed on the
  Daily timeframe**, regardless of the timeframe the chart is currently
  showing.

## Design notes / things fixed along the way

This is a living document of the more subtle correctness issues addressed
during development, kept here for anyone maintaining the code later:

- **Label collision avoidance.** Nearby levels (e.g. a 4H resistance and a
  15-minute "today" resistance a few points apart) are queued and resolved by
  pixel distance before being drawn, so overlapping text is nudged apart. Only
  the printed label moves — the underlying line is always drawn at the exact
  price.
- **Lines drawn in front of candles, not behind.** On a volatile instrument,
  dense candle bodies can fully obscure a "behind the price action" line even
  though the object exists — all reference lines render in front instead.
- **Panel anchoring.** A corner-anchored label with a small offset from the
  edge needs to be *right*-anchored so its text grows inward, or it renders
  mostly off-screen — an easy mistake that makes a working panel look like it
  never rendered at all.
- **"Today" session detection is anchored to the chart's own current time**,
  not to whichever bar a separately-fetched intraday series happens to return
  as "latest" — avoiding a stale/mismatched read locking the day's range to
  the wrong session.
- **KAMA computation is O(n)**, not O(n·period): the volatility sum inside the
  efficiency-ratio calculation is maintained as a sliding window instead of
  being re-summed from scratch for every historical bar, which matters a lot
  with a 200-period AMA over a long history.

## Known limitations

- First load on a fresh chart/timeframe/symbol can take a few seconds while
  MT5 syncs the H4/H1/M15 history series it depends on — this is normal MT5
  history-sync behavior, not indicator overhead, and is faster once those
  timeframes have been opened once for that symbol.
- Designed as a visual aid only. It does not place trades, generate alerts, or
  make any trading recommendation.
- For best readability, enabling **Chart Shift** (right-click chart → 
  Properties → Common) gives labels room to breathe on the right edge instead
  of crowding against the last candle.

## Disclaimer

This indicator is a visual reference tool only. It does not constitute
financial advice, and past levels holding as support/resistance is not a
guarantee they will do so in the future. Use at your own risk alongside your
own analysis and risk management.

おすすめのプロダクト
Ultimate Double Top & Bottom (Pro Volume Matrix) Stop trading retail breakouts. Start trading Institutional Traps. The   Ultimate Double Top & Bottom   is not a standard, lagging pattern scanner. It is a highly advanced, non-repainting structural engine equipped with a proprietary   3-Leg Volume Matrix . Designed exclusively for Smart Money Concepts (SMC) and order flow traders, this indicator mathematically dissects the tick volume inside M and W patterns to reveal true institutional intent:  
このインジケーターは実践的なトレードに最適な自動波動分析のインジケーターです! 場合... 注:   Tang Lun (Tang Zhong Shuo Zen) の命名規則の影響で、私は波のグレーディングに西洋の名前を使用することに慣れていません。基本的な波を ペン 、二次波のバンドを セグメント と名付けました。同時に、 セグメント にはトレンドの方向が指定されます (この命名方法は将来のノートで使用されます。最初に言っておきます)。ただし、アルゴリズムは曲がりくねった理論とはほとんど関係がないため、付けるべきではありません。これは、私の市場分析 によって要約された、絶えず変化する複雑な運用ルール を反映しています。 バンドは標準化され、人によって異なることがないよう定義されており、市場参入を厳密に分析する上で重要な役割を果たす人為的な干渉の描画方法が排除されています。 このインジケーターを使用することは、取引インターフェイスの美しさを改善することと同等であり、元の K ライン取引を放棄し、取引の新しいレベルに連れて行きます。また、宣伝の観点から顧客の認識も向上します。 イ
Orderflow Super Candles - Simple Footprint Chart Indicator Platform: MetaTrader 5 (MT5)  (The last screenshot shows the use of the DOM tool in conjunction with the product.) 1. Product Introduction Orderflow Super Candles is a professional charting tool based on underlying Tick data analysis, designed to provide traders with a deep "X-ray" view of the market. By parsing the buy and sell volume distribution within each candlestick, this indicator visualizes the hidden market microstructure. It
Develop this indicator for periods of 30 minutes or more, focus on getting market trends right and making sure they are met. MFOP v8.1 gets straight to the point: it scans the market and tells you exactly when there is enough strength to enter a trade. This indicator doesn't do magic, it uses mathematical algorithms to filter out market noise, not enter into false breakouts and show you clear BUY (blue arrow) and SELL (red arrow) opportunities. It is designed and optimized specifically to take
CISD Levels Pro automatically draws CISD Buy and Sell levels directly on your chart. It highlights pending levels while they are forming, then marks confirmed levels after the confirmation candle closes. Optional confirmation arrows help you spot the signal quickly. This tool is designed for traders who want clean, simple CISD level visualization without extra indicators or clutter. Key Features Draws Bullish (BUY) CISD levels and Bearish (SELL) CISD levels Shows Pending levels (dashed) and
The indicator is designed to close positions on the market in time. For example: to take profits ahead of schedule if the price has not reached TakeProfit, and the market is turning around. The indicator analyzes the momentum, not the trend. He does not give any information about the trend. The indicator is well suited for finding divergence. The Ershov 38 Parrots indicator dynamically adjusts to the market and detects price movement impulses of medium and high amplitude. It almost does not rea
The indicator determines a special pattern of Joe Dinapoli. It gives very high probability buy and sell signals. Indicator does not repaint. Indicator Usage Buy Signal ''B'' Entry : Market buy order at signal bar close Stop : Low of signal bar Take Profit : First swing high Sell Signal ''S'' Entry : Market sell order at signal bar close Stop : High of signal bar Take Profit : First swing low Indicator Parameters Fast EMA : External Parameter (should be kept as default) Slow EMA: External Param
ENGLISH VERSION (for MQL5 Market) Product Description: RSI Trend & Volatility Dashboard (Multi-Timeframe Filter) This professional dashboard provides traders with an ultimate market overview inside a single chart. It continuously monitors the trend direction across 5 timeframes simultaneously: M5, M15, M30, H1, and D1 [MQL5]. No more tedious chart switching or multi-window clutter – see everything from quick scalping moves to global institutional daily trends in real-time [MQL5]. Key Adva
ToolBox 360 is the swiss knife of all indicators. It is full packed with useful tools to help you with your trading. It can be used to find best entry and exit points and help you to decide if you should open a trade or not. It shows market trends, candlestick formations outside / inside bars and you can sett time based allerts. Main features: Time based Fibonacci lines Choose a start and end time and the indicator shows you Fibonacci lines within the selected time range including range high a
Introduction to Fractal Pattern Scanner Fractal Indicator refers to the technical indicator that makes use of the fractal geometry found in the financial market. Fractal Pattern Scanner is the advanced Fractal Indicator that brings the latest trading technology after the extensive research and development work in the fractal geometry in the financial market. The most important feature in Fractal Pattern Scanner is the ability to measure the turning point probability as well as the trend probabil
Link to our best products: LINK Link to our Trading Dashboard: LINK !!!!!!! Attention, you can find premium discounts by clicking on arrows!!!!!! Setting of this indicator candles mode: Show zones from the beginning Swing number for highs and lows Show background color Color of Premium Color of Discount show level 0% line show level 25% line show level 50% line show level 75% line show level 100% line The Premium and Discount concept is a core principle of Smart Money Concepts (SMC) used to i
XFlow shows an expanding price channel that helps determine the trend and the moments of its reversal. It is also used when accompanying transactions to set take profit/stop loss and averages. It has practically no parameters and is very easy to use - just specify an important moment in the history for you and the indicator will calculate the price channel. DISPLAYED LINES ROTATE - a thick solid line. The center of the general price rotation. The price makes wide cyclical movements around the
ニューラルネットワークインジケーター   学習機能が組み込まれています。 これは、多層的にカスタマイズ可能なパーセプトロンと高度なトレーニング設定を備えた、真の自律型人工知能システムです。 将来の価格変動を予測します。このインジケーターは、あらゆる金融銘柄でご自身でトレーニングできます。機械学習の特別な知識は必要ありません。必要なものはすべてこのツールに集約されており、自動モードとプリセットによって簡単に実装できます。 メジャーアップデートv2.0-2.5がリリースされました。 高度な入力機能:インジケータのサポートが追加されました。 これで、生の価格データを3つのテクニカル指標と組み合わせて、より深い市場分析を行うことも、価格なしの指標のみを使用することもできます。 ブロックせずにライブトレーニング:インテリジェントな学習アルゴリズムは、バックグラウンドで非同期的に動作します。 あなたのMetaTrader5ターミナルは完全に応答し続け、ニューラルネットワークを学びながら市場の取引と分析を継続することができます。 特徴: 簡単スタート 。自動モードですぐにスタートできる簡単な設定
Paid release: Andean Oscillator Signals MT5 is a paid MetaCoderStore indicator. Use the product comments for setup questions, feature requests, and feedback for future updates. Andean Oscillator Signals MT5 shows bullish and bearish trend variation as two oscillator components, then marks cross signals when one side takes control with optional confirmation from the signal line. Use cases Read whether bullish or bearish pressure is dominant. Spot bull crosses when the bull component moves above t
HIGH and LOW OTT
Mohammad Taher Halimi Tabrizi
This product is converted form Trading View of Kivanc Ozbilgic to be used on MT5 and below are descriptions of developer on Trading View: Anıl Özekşi's latest development on his precious OTT - Optimized Trend Tracker: In this version, there are two lines of OTT which are derived from HIGHEST price values (HOTT) and LOVEST price values (LOTT) which were originally sourced to CLOSE values on default OTT. Another significant difference is there is no Support Line (Moving Average) in this version
ADRアラートダッシュボードは、価格が通常の1日の平均範囲に関連して現在取引されている場所を一目で示します。価格が選択した平均範囲とレベルを超えると、ポップアップ、電子メール、またはプッシュを介して即座にアラートを受け取るため、プルバックと逆転にすばやくジャンプできます。ダッシュは空白のチャートに配置されるように設計されており、バックグラウンドに座ってレベルに達したときに警告を発するので、座って見たり、まったく見たりする必要はありません。 ここで利用可能なMT4バージョン:https:// www.mql5.com/en/market/product/62756 NEW:毎週と毎月の平均範囲とそれらへのアラートも表示されるようになりました! ここでチャートのレベルを下げるADRリバースインジケーターを入手してください:https:// www.mql5.com/en/market/product/64477 通常の1日平均レンジ(ADR)内で価格が取引され、これらのレベルを上回っている時間の約60%は、通常、その後の引き戻し(利益確定)の動きを伴う急激な価格の動きの指標です。
Gold Signal Swing Pro XAUUSD with Auto TP SL — 7層フィルター + RR保証システム搭載 XAUUSDスイング完全トレードシステム リペイントなし。リドローなし。ラグなし。すべてのサインは確定後に変わりません。 購入者限定特典:買い切りライセンスをご購入いただいた方に、AI Zone Radar($59相当)+PDFマニュアルを無料プレゼント。購入後にMQL5でメッセージをお送りください。 AI Zone Radar: https://www.mql5.com/en/market/product/175834 MT4版もあります: https://www.mql5.com/ja/market/product/177778?source=Site +Market+Product+Page ゴールドトレーダーのコミュニティで実際に使用され、精度と使いやすさで高評価。 こんな方におすすめ 仕事や家事で忙しく、M5/M15に張り付けない方 厳選されたサインだけで運用したい方 寝てる間や外出中もポジションを持っておきたい方 1サインで大きく取りたい方
Smart Volatility Squeeze MT5 Smart Volatility Squeeze MT5 is a volatility compression and momentum expansion indicator for MetaTrader 5. It builds on John Carter's Volatility Squeeze framework and extends the usual single-tier squeeze into three compression tiers, so you can see not only whether the market is compressed but how tightly it is compressed before it expands. The indicator opens in a separate window and draws two elements: a linear regression momentum histogram and a row of coloured
The indicator helps to enter a trade following the trend, at the same time, after some correction. It finds strong trending movements of a currency pair on a given number of bars, and also finds correction levels to this trend. If the trend is strong enough, and the correction becomes equal to the one specified in the parameters, then the indicator signals this. You can set different correction values, 38, 50 and 62 (Fibonacci levels) are better. In addition, you can set the minimum trend lengt
価格が流動性を探しに向かう可能性のある場所を把握 Liquidity Reaction Map MT5は、確定した価格構造に基づいて、潜在的なバイサイドおよびセルサイド流動性エリアを特定するチャート型市場分析インジケーターです。 スイングポイント、等しい高値と安値、前日および前週の水準、セッションの高値と安値、心理的なラウンド価格を整理された流動性マップに統合します。近接する水準は統合され、強度、現在価格からの距離、複数ソースの一致度に基づいて順位付けされます。 価格が流動性エリアに接近する、流動性をスイープする、反発する、またはブレイクする可能性のある場所を分析するために使用できます。取引の開始や管理は行いません。 流動性のソース 流動性マップは、次の情報から流動性を特定できます。 確定したスイング高値と安値 等しい高値と等しい安値 前日の高値と安値 前週の高値と安値 完了したセッションの高値と安値 心理的なラウンド価格水準 設定可能な複数の時間足 バイサイド流動性は関連する高値の上に表示され、セルサイド流動性は関連する安値の下に表示されます。 これらのエリアは、過去の価格構造から算
Xtrade Trend Detector is an indicator capable of finding the best opportunities to take a position in any stock market. Indeed, it is a great tool for scalpers but also for Daytraders. You could therefore use it to identify areas to trade, it fits easily on a chart. I use it to detect trends on Big timeframes and take positions on Small timeframes. Don't hesitate to give me a feedback if you test it.
Paid release: Squeeze Momentum Breakout Signals MT5 is a paid MetaCoderStore indicator. Use the product comments for setup questions, feature requests, and feedback for future updates. Squeeze Momentum Breakout Signals MT5 detects volatility compression with Bollinger Bands inside Keltner Channels, then highlights bullish or bearish release bars when momentum expands after the squeeze. Use cases Find markets moving from quiet compression into active expansion. Watch directional momentum after a
【Super Scanner】Indicator Introduction : The color of the Super Scanner which is green and climbing up means that the price trend is going up.The color of the Super Scanner is red and going down means that the price trend is going down. It is very simple to use it to judge the market trend! What's even better is that the open parameters of the indicators allow investors to adjust. You can adjust【Super Scanner】according to your needs. Adjust it faster to be closer to short-term market fluctuatio
これは当社のインジケーター ACB Breakout Arrows 用に開発されたマルチシンボル・マルチタイムフレームのスキャナーです。デフォルト設定では、 28種類の通貨ペアと9つの時間足 を同時にスキャンして売買シグナルを検出します。  機能 1つのチャートから 252* のシンボルと時間足の組み合わせをスキャン可能です。 ワンクリックでシグナルのチャートを開き、事前に設定されたテンプレートを自動で適用します。  チャート上のどこにでも簡単にドラッグ&ドロップで配置できます。 ポップアップ、音声、プッシュ通知、メールによるリアルタイムアラート機能を搭載しています。  入力パラメーター ACB Breakout Arrows のシグナル感度設定。 スキャンするシンボルを入力してください。  履歴の更新:履歴データが不足または壊れている場合は、再ダウンロードして更新できます。  スキャンする時間足を選択してください。 アラート設定 パネルの色やフォントサイズを調整可能です。 
The Propfolio Master Suite is the ultimate all-in-one analytical workstation for professional traders. Combining the power of the Beat The Market Maker (BTMM) methodology, Smart Money Concepts (SND/Liquidity), and Advanced Volume Profile, this suite replaces multiple different indicators with one optimized engine. Monitor up to 14 pairs simultaneously from a single chart, instantly identify market cycles, and seamlessly map institutional footprints with the click of a button. The Command Center
Quantified Trendline Strength (QTS) Overview Quantified Trendline Strength is a technical analysis tool that automatically detects and evaluates trendlines based on price swing structures. It provides a visual and quantitative way to understand how significant each trendline may be, allowing traders to make more structured observations of market behavior. Indicator Type Category: Trend / Level Detection Display: Chart window (overlay indicator) Purpose: Identify and evaluate trendlines, support
Gann S9 Pro Signals and Star
Mohamed Amr Mohamed Osama Abdelwahab
5 (1)
**ギャンの九角形 2 — 高度な価格・時間予測ツール** 九角形は W.D. ギャンの最も強力な予測ツールのひとつです。本インジケーターは MetaTrader 5 向けの第二世代完全実装で、パトリック・ミクラの書籍の手法に直接基づいています。 インタラクティブツールバー、トレードシグナルパネル、ギャン星形図、チャネルゾーン、 角度統計、平均ゾーンオーバーレイ、12言語インターフェースを追加しています。 1つの基準価格から、基本十字(0・90・180・270度)と対角十字(45・135・225・315度)上の サポート/レジスタンスを投影します。時間(将来の転換バー)も予測し、どの角度を市場が 最も尊重しているかを計測します。価格レベルとギャン時間カウントが一致すると、 「価格-時間コンフルエンス」アラートを発します。 分析・予測専用ツール。DLL不要、インターネット不要。あらゆる銘柄・時間足で動作。 **主な機能** - 価格レベル:基本十字・対角十字、複数リング - シグナルパネル(書籍手法):BUY/SELL SETUP、3段階コンフルエンス、価格-時間アラート -
Introduction This indicator detects volume spread patterns for buy and sell opportunity. The patterns include demand and supply patterns. You might use each pattern for trading. However, these patterns are best used to detect the demand zone (=accumulation area) and supply zone (=distribution area). Demand pattern indicates generally potential buying opportunity. Supply pattern indicates generally potential selling opportunity. These are the underlying patterns rather than direct price action. T
Only 5 copies of the EA at $30! Next price --> $45 Find charts and signals based on harmonic patterns, which work great in 1-hour timeframes and up. Buy and sell signs based on different harmonic patterns as follows: 0: ABC_D 1: ABCD_E 2: 3Drive 3: 5_0 4: Gartley 5: Bat 6: Crab 7: Butterfly 8: Cypher 9: NenStar 10: Shark 11: AntiBat 12: AntiGartley 13: AntiCrab 14: AntiButterfly 15: AntiCypher 16: AntiNenStar 17: AntiShark How to use: When there is an opportunity to buy or sell, you have 5:
Harraz Master HUD
Muhammad Azraf Bin Dzul Fauzi
HARRAZ MASTER HUD v4.4 - The Ultimate Neural Trading Command Center ​ Transform your MetaTrader 5 into a professional, institutional-grade trading terminal. Harraz Master HUD is not just an indicator; it is a complete Artificial Intelligence ecosystem designed specifically for XAUUSD (Gold) and major pairs. ​ EXCLUSIVE FEATURES: ​1. Live Neural AI Typewriter (Jarvis Mode) Experience a live, animated Heads-Up Display that types out real-time market sentiment and advice. It acts as your persona
このプロダクトを購入した人は以下も購入しています
この製品は 2026 年の市場向けに更新され、最新の MT5 ビルドに最適化されています。 価格更新のお知らせ: Smart Trend Trading System は現在 $99 で提供されています。 次の 30 件の購入 後、価格は $199 に上がります。 特別オファー: Smart Trend Trading System を購入後、私にプライベートメッセージを送ることで、 Smart Universal EA を無料 で受け取り、Smart Trend のシグナルを自動売買に変えることができます。 Smart Trend Trading System は、リペイントなし、再描画なし、遅延なしの完全なトレーディングシステムです。よりクリーンなシグナル、より明確なトレンド方向、そしてより整理された取引方法を求めるトレーダー向けに作られています。 Learn Smart Trend Trading System Everything you need to learn, install, and use the product is available here: Online
Trend Sniper X
Sarvarbek Abduvoxobov
5 (13)
Trend Sniper X は、トレードの方向性と潜在的な反転ポイントを明確かつ正確に特定するのに役立つ、MetaTrader 5 用のマルチタイムフレーム・トレンドフォロー指標です。 MT4用: https://www.mql5.com/en/market/product/193245 価格情報: 現在の価格はキャンペーン価格であり、今後のアップデートや新機能のリリースに伴い変更される可能性があります。 Code2Profit チャンネル マルチタイムフレーム分析で相場をマスターしよう! Trend Sniper X で勝率を最大化する方法:重要なルールとセッションのコツ 技術仕様 プラットフォーム MetaTrader 5 インジケータータイプ マルチタイムフレーム・トレンドインジケーター 操作タイムフレーム あらゆるチャートタイムフレームに対応。個別に選択可能な上位タイムフレーム (M1–MN1) を搭載 主要銘柄 FX、ゴールド (XAUUSD)、およびその他のCFD 推奨口座 あらゆる口座タイプに対応 視覚化 色分けされたトレンドローソク足 (買い/売り/弱気/変化) +
Neuro Poseidon is a new indicator by Daria Rezueva. It combines precise trading signals with adaptive TP/SL levels - creating best possible trades as a result! Message me and get  Neuro Poseidon Assistant  as a gift to automize your trading process! What makes it stand out? 1. Proven profitability on all assets and timeframes 2. Only confirmed BUY and SELL signals present on the chart 3. Adaptive TP & SL levels generated by the software for each trade 4. Easy to understand - suitable for al
時折、私自身もこのシステムを使って取引を行っています。 実口座での私の手動による「BOMBER」トレードをぜひご評価ください - LIVE SIGNAL このインジケーターを購入された方には、以下の特典を 無料 で提供しています: 各トレードを自動で管理し、ストップロスとテイクプロフィットを設定し、戦略ルールに基づいてポジションを決済する補助ツール 「Bomber Utility」 様々な銘柄に合わせたインジケーターの設定ファイル(セットファイル) 「最小リスク」、「バランスリスク」、「待機戦略」 の3つのモードで使用できる Bomber Utility 用の設定ファイル このトレーディング戦略をすぐに導入・設定・開始できる ステップバイステップのビデオマニュアル ご注意: 上記の特典を受け取るには、MQL5のプライベートメッセージシステムを通じて販売者にご連絡ください。 オリジナルのカスタムインジケーター 「Divergence Bomber(ダイバージェンス・ボンバー)」 をご紹介します。これは、MACDのダイバージェンス(乖離)戦略に基づいた 「オールインワン」型のトレーディン
SUPERHEROインジケーターは、「オールインワン」方式に基づいて設計された多通貨対応の取引システムです。このインジケーターは市場を独自に分析し、取引の開始および終了のタイミングに関するシグナルを提供します。ストップロス注文とテイクプロフィット注文を使用します。R:R比率は1:1です。 私は時折、このシステムのシグナルに基づいて自ら取引を行いますが、その結果は以下の通りです— ライブシグナル このシステムはスマートフォンにプッシュ通知を送信できるため、PCに縛られることなく「外出先」からでも取引を行うことができます。自己勘定取引を行う企業に最適です。 すべてのお客様への特典: このインジケーターをご購入いただいたすべてのお客様に、私から特別なユーティリティをプレゼントいたします。その内容は以下の通りです: 自動的にストップロス注文とテイクプロフィット注文を発注します 価格が目標水準に達すると、自動的に取引を決済します 指値注文による取引に対応しています 平均化取引モードに対応しています この優れた、しかも非常に便利なユーティリティをプレゼントとして受け取りたい場合は、SUPERHER
M1 SNIPER は使いやすいトレーディングインジケーターシステムです。M1時間足向けに設計された矢印インジケーターです。M1時間足でのスキャルピングのためのスタンドアロンシステムとして、また既存のトレーディングシステムの一部としても使用できます。このトレーディングシステムはM1時間足での取引に特化して設計されていますが、他の時間足でも使用できます。元々、この手法はXAUUSDとBTCUSDの取引用に設計しましたが、他の市場においても役立つと考えています。 インジケーターのシグナルは、トレンドの方向と逆方向に取引できます。インジケーターのシグナルを利用して両方向に取引するのに役立つ特別な取引テクニックをご紹介します。この手法は、特別な動的なサポートとレジスタンスの価格帯を利用することに基づいています。 ご購入後、M1 SNIPER矢印インジケーターをすぐにダウンロードできます。さらに、M1 SNIPERツールのすべてのユーザーに、以下のスクリーンショットに表示されているApollo Dynamic SRインジケーターを無料で提供しています。この2つのインジケーターを組み合わせることで
UNIX Scalper — Gold Scalping Indicator for MetaTrader 5 UNIX Scalper is a focused Gold scalping indicator designed primarily for XAUUSD on M1, M2, M3, M5, M10 and M15. It gives the trader a clear BUY, SELL or WAIT decision together with the complete trade plan: Entry, Stop Loss, TP1 and TP2 . PRICE UPDATE NOTICE: Currently available for $199. The price will   increase to $399   after the next   30 purchases . The concept is simple: wait for the signal, follow the levels, move the Stop Loss to
伝説が帰ってきました:Entry Points Pro 10。 MQL5 Marketのトップ3に3年間入り続けた伝説的インジケーターの再始動です。 2つのバージョンで合計589件の高評価レビュー、毎日数千人のトレーダーが実際のトレードに使用し、デモのダウンロードは31,000件以上   MT4+MT5 。 私はこの5年間に寄せられたレビューをすべて読み、約束を並べる代わりに、その答えをバージョン10に組み込みました。1999年から相場に携わり、 誠実さ、自らの評判、そして顧客を大切にする 作者による製品です。 Entry Points Proのエントリーシグナルは、リペイント(再描画)を一切行いません。 そして今回初めて、これは作者の言葉ではなく検証可能な事実になりました。確定シグナルはローソク足の終値確定後にのみ表示され、自動テストで リペイントはゼロ と確認されています(EURUSD、XAUUSD、BTCUSDで2,486,568回の不変条件チェック、違反0件)。検証方法は公開されており、ストラテジーテスターでご自身で再現できます。 ご購入後は、必ずすぐにダイレクトメッセージでご
この製品は 2026 年の市場向けに更新され、最新の MT5 ビルドに最適化されています。 価格更新のお知らせ: Atomic Analyst は現在 $99 で提供されています。 次の 30 件の購入 後、価格は $199 に上がります。 特別オファー: Atomic Analyst を購入後、私にプライベートメッセージを送ることで、 Smart Universal EA を無料 で受け取り、Atomic Analyst のシグナルを自動売買に変えることができます。 Atomic Analyst は、リペイントなし、再描画なし、遅延なしの Price Action トレーディングインジケーターで、手動取引、シグナルの明確化、EA 自動化のために設計されています。 User manual: settings, inputs and strategy.   &   User Manual PDF . 価格行動、強さ、モメンタム、マルチタイムフレーム方向、高度なフィルターを分析し、トレーダーがノイズを減らし、弱いセットアップを避け、より構造化された取引判断を行えるようにします。 このイ
UZFX {SSS} スキャルピング・スマートシグナル v4.0 MT5は、変動の激しい市場において正確かつリアルタイムのシグナルを求めるスキャルパー、デイトレーダー、スイングトレーダー向けに設計された、リペイントのない高性能な取引インジケーターです。(UZFX-LABS)によって開発されたこのインジケーターは、価格行動分析、トレンド確認、スマートフィルタリングを組み合わせることで、すべての通貨ペアおよび時間軸において、高確率の売買シグナル、警告シグナル、トレンド継続の機会を生成します。 トレードの判断に迷うのはもうやめましょう。明確さ、正確さ、そして規律ある市場執行を求めるトレーダーのために設計された、体系的なシグナルシステムに従い始めましょう。 私のおすすめ* 最適な時間足:15分足以上。 {H1} が私のお気に入りです。そして、その成果は驚異的です…!! 主な機能の更新 • 自動売買シグナル検出 • 高度な反転認識ロジック • 市場反転の可能性に先立つ早期警告シグナル • トレンド継続確認シグナル • エントリー、ストップロス、TP1、TP2、TP3レベルを備えた組み込み型
AXIOM MATRIX MT5 ローンチ価格:$99 Axiom Matrix はローンチ価格 $99 でご利用いただけます。 最初の30件の購入後、価格は $199 に上がります。 ご購入後、手順のご案内と限定ギフトボーナスの受け取りのために、直接DMをお送りください。 Axiom Matrix は、MetaTrader 5 用のプロフェッショナルなマルチシンボル・マルチタイムフレーム市場スキャナー兼意思決定ダッシュボードです。 Market Watch をスキャンし、複数の時間足を分析し、複数のエビデンスエンジンを読み取り、最も強いチャンスを比較し、1つのクリーンなマトリックスダッシュボード内で最適な BUY、SELL、WAIT、またはブロック状態を表示します。 私が Axiom Matrix を作った理由は、市場スキャンという重い作業を代わりに行ってくれる1つのツールが欲しかったからです。 RSI だけを確認したくありませんでした。 次に MACD だけ。 次に移動平均線。 次に出来高。 次にボラティリティ。 次にサポートとレジスタンス。 そして、1つのトレードアイデアを作るた
現在33%オフ 初心者にもエキスパートトレーダーにも最適なソリューション このインジケーターは独自の機能と新しい公式を多数内蔵しており、ユニークで高品質かつ手頃な取引ツールです。このアップデートでは、2つの時間枠ゾーンを表示できるようになります。より長いTFだけでなく、チャートTFとより長いTF(ネストゾーンを表示)の両方を表示できます。すべてのSupply Demandトレーダーの皆さんのお気に召すはずです。:) 重要情報の公開 Advanced Supply Demandの可能性を最大化するには、 https://www.mql5.com/ja/blogs/post/720245 にアクセスしてください。   エントリーまたはターゲットの正確なトリガーポイントを正確に特定できれば取引がどのように改善されるか想像してみてください。新しい基盤となるアルゴリズムに基づいて構築されているため、買い手と売り手の間の潜在的な不均衡をさらに簡単に特定できます。これは、最も強い需要と供給のゾーンと、過去のパフォーマンス(古いゾーンを表示)がグラフィカルに表現されるためです。これらの機能は、最適な
Power Candles V3 - 自己最適化型強弱インジケーター Power Candles V3は 、通貨や銘柄の強さを、適用されたすべてのチャート上で実行可能なトレードプランに変換します。単にローソク足を色分けするだけでなく、バックグラウンドでリアルタイムの自動最適化を実行し、目の前の銘柄に対して最適なストップロス、テイクプロフィット、およびシグナルの閾値を提示します。ワンクリックで実取引に適用でき、エントリーポイント、ストップロス、テイクプロフィットのラインが正確な価格位置にチャート上に表示され、方向性を示すアラートがリアルタイムで発動します。 このツールは、Stein Investmentsのエコシステムの一部です。  18種類以上のツールをすべて閲覧し、AIを活用したセットアップの推奨事項を入手し、  https://stein.investments でコミュニティに参加しましょう クローズしたバーごとに3,000回以上のトレードシミュレーション。9つの強さの状態。2つの戦略を並行してテスト。勝率の高い設定をワンクリックで適用。 なぜこれが必要なのか ほとんどの強
KURAMA GOLD SIGNAL PRO(MT5版)— 7層フィルター・自動TP/SL・品質スコア・サイン履歴保存搭載 XAUUSD完全トレードシステム リアルタイムでリペイントしません。サインが出た瞬間、矢印・エントリー・TP・SLはその場で固定され、後から動きません。あなたがトレードするのは、この「リアルタイムで出たサイン」です。さらにv7.20では、実際に通知されたサインを自動保存し、再起動後もそのまま復元します。 購入者限定特典 買い切りライセンスをご購入いただいた方に、AI Zone Radar($59相当)+完全PDFマニュアルを無料プレゼント。本体価格に$59相当の特典が付いてきます。購入後にMQL5でメッセージをお送りください。 AI Zone Radar: https://www.mql5.com/en/market/product/175834 ゴールドトレーダーのコミュニティで実際に使用され、精度と使いやすさで高く評価されています。 あな
note: this indicator is for METATRADER4, if you want the version for METATRADER5 this is the link:  https://www.mql5.com/it/market/product/108106 TRENDMAESTRO ver 2.5 TRENDMAESTRO recognizes a new TREND from the start, he never makes mistakes. The certainty of identifying a new TREND is priceless. DESCRIPTION TRENDMAESTRO identifies a new TREND in the bud, this indicator examines the volatility, volumes and momentum to identify the moment in which there is an explosion of one or more of these da
SR Liquidity は、市場の流動性が集中し、価格が最も強く反応する「隠れたゾーン」を可視化するために設計されたトレーディング指標です。こうした流動性の高いエリアは強力なサポート(支持)およびレジスタンス(抵抗)レベルとして機能し、市場が反転する可能性が最も高いポイントを明確に示してくれます。 単なる一般的なサポートラインやレジスタンスラインを描画するのではなく、「SR Liquidity」は実際の価格変動を分析し、売りと買いの圧力が集中するゾーンを特定します。これらは、市場の真の動きを牽引する「流動性のプール(溜まり場)」そのものです。それらをチャート上に直接可視化することで、価格が実際に反応する前に、その動きを予測することが可能になります。つまり、このインジケーターは価格の方向性が変わる可能性を予測するのです。生のプライスアクションを、市場の重要な水準(転換点となり得るポイント)を示す、明確で実用的なロードマップへと変換してくれます。 このインジケーターは、FX、株価指数、貴金属、仮想通貨など、あらゆる銘柄や時間足で使用可能です。 ご購入後、取引手順や無料の優れた追加インジケ
Azimuth Pro
Ottaviano De Cicco
5 (7)
Azimuth Pro V2:MT5向けシンセティック・フラクタル構造分析と確認済みエントリー 概要 Azimuth Pro は Merkava Labs によるマルチレベルスイング構造インジケーターです。4つのネストされたスイングレイヤー、スイングアンカーVWAP、ABCパターン検出、3タイムフレーム構造フィルタリング、そして確定バーでの確認済みエントリー — 1つのチャートで、ミクロスイングからマクロサイクルまでを網羅するワークフロー。 これはブラインドシグナル製品ではありません。ロケーション、コンテキスト、タイミングを重視するトレーダーのための構造ファーストワークフローです。 ️ サマーセール — 夏至とThe Oracle Proの発売を記念して、Azimuth Proが30%オフ。現在279 USD(通常399 USD)。期間限定の夏季オファー。 1. V2での変更点 シンセティック・マルチタイムフレームエンジン 上位タイムフレーム分析をMeridian Proと同じ独自のシンセティックアーキテクチャで一から再構築。よりクリーンなHTFコンテキスト、安定したライブ動作、
M1 Quantum MT5
Hamed Dehgani
4.27 (11)
M1 Quantum を使用したライブトレードシグナル : シグナル (取引は 自動的に Quantum Trade Assistant によって実行され、この製品に 無料 で含まれています。) 最新ニュース: バージョン1.64がリリースされました。現在、すべての取引で、関連するサポート/レジスタンスゾーンの後ろにStop Lossが設定されます。今回のバージョンでは、EAのパフォーマンスを向上させるためにSmart Close機能も改善されました。 8月9日から、ライブシグナルはバージョン1.64で稼働しています。 価格プラン: 現在価格: $169 (早期購入者向けオファー) 次回予定価格: $189 予定小売価格: $299 開発者からのお知らせ: ご購入後、 最新の推奨設定ファイル(Set File) 、運用アドバイス、および他の M1 Quantum ユーザーと交流できる VIPサポートグループ への招待をご希望の場合は、お気軽にご連絡ください。 よくある質問 - 設定ファイル - インストールガイド M1 Quantum は、M1専用のプロフェッショナルトレーディング
優れたテクニカルインジケーター「Grabber」をご紹介します。これは、すぐに使える「オールインワン」トレーディング戦略として機能します。 ひとつのコードに、市場のテクニカル分析ツール、取引シグナル(矢印)、アラート機能、プッシュ通知が強力に統合されています。 このインジケーターを購入された方には、以下の特典を無料で提供します: Grabberユーティリティ:オープンポジションを自動で管理するツール ステップバイステップのビデオマニュアル:インジケーターのインストール、設定、取引方法を解説 カスタムセットファイル:インジケーターをすばやく自動設定し、最大限の成果を出すための設定ファイル 他の戦略はもう忘れてください!Grabberだけが、あなたを新たなトレードの高みへと導いてくれるのです。 Grabber戦略の主な特徴: 推奨タイムフレーム:M5〜H4 対応通貨ペア・資産:どれでも使用可能ですが、私が実際に検証した以下を推奨します(GBPUSD、GBPCAD、GBPCHF、AUDCAD、AUDUSD、AUDSGD、AUDCHF、NZDUSD、NZDCAD、EURCAD、EURUSD、E
Smart Market Structure Pro by G-Labs — ICT and Smart Money Concepts toolkit with built-in multi-symbol scanner for MetaTrader 5. Break of structure, change of character, order blocks, fair value gaps, liquidity sweeps, premium and discount zones, ICT sessions, confluence scoring, AI trade ideas, and a traffic-light scanner across up to 30 pairs and four timeframes from one chart. Map SMC and ICT on the active chart while the built-in scanner monitors your full watchlist. Each cell shows BUY, S
この製品は 2026 年の市場向けに更新され、最新の MT5 ビルドに最適化されています。 価格更新のお知らせ: Smart Price Action Concepts は現在 $200 で提供されています。 次の 30 件の購入 後、価格は $299 に上がります。 特別オファー: 購入後、私にプライベートメッセージを送ることで、 無料ボーナス + ギフト を受け取ることができます。 まず、このトレーディングツールはリペイントなし、再描画なし、遅延なしのインジケーターであり、プロフェッショナルな取引に最適であることを強調しておきます。 [Online course] ,   [User Manual]  ,  [How to Install]  ,   [PDF] Smart Price Action Concepts Indicator は、初心者から経験豊富なトレーダーまで使える非常に強力なツールです。20 種類以上の便利なインジケーターを 1 つにまとめ、Inner Circle Trader Analysis や Smart Money Concepts Trading S
SkyHammer Signal Pro Entry、SL、TP レベルを固定表示する、プロ仕様のノーリペイント・トレンドシグナルインジケーター SkyHammer Signal Pro は、明確で固定され、検証可能なシグナルを求めるトレーダー向けに設計された、構造的なトレンド・モメンタム系シグナルインジケーターです。 特に M1 と M5 などの短期時間足で最も効果を発揮します。 このインジケーターは、天井や底を予測するためのものではありません。シグナルを出す前に、確認された市場構造、トレンド方向、モメンタムの強さ、健全なボラティリティ、そしてターゲットまでの十分な値幅を確認します。 主な機能 固定シグナルメカニズム シグナルが確認されると、矢印、Entry、Stop Loss、TP1、TP2 の各レベルはチャート上に永久的に固定されます。 その後のローソク足の動きによって、シグナルが消えたり、移動したり、変更されたりすることはありません。 これにより、トレーダーは各シグナルを明確に確認でき、リアルタイム相場中にシグナルが消えるという一般的な問題を避けることができます。 完全な過去シ
スイングトレーディング は、トレンドの方向のスイングと可能な反転スイングを検出するように設計された最初のインジケーターです。トレーディングの文献で広く説明されているベースラインスイングトレーディングアプローチを使用します。インディケータは、いくつかの価格と時間のベクトルを調査して、全体的なトレンドの方向を追跡し、市場が売られ過ぎまたは買われ過ぎて修正の準備ができている状況を検出します。 [ インストールガイド | 更新ガイド | トラブルシューティング | よくある質問 | すべての製品 ] むち打ちを起こさずに市場スイングの利益 インジケーターは常にトレンドの方向を表示します 色付きの価格帯は機会のベースラインを表します 色付きのダッシュは、可能な反転スイングを表します この指標は、独自の品質とパフォーマンスを分析します 複数時間枠のダッシュボードを実装します カスタマイズ可能なトレンドおよびスイング期間 電子メール/サウンド/プッシュアラートを実装します インジケータは再描画またはバックペインティングではありません Swing Tradingとは Swing Tradingは
The Oracle Pro
Ottaviano De Cicco
5 (1)
The Oracle Pro:MT5向け合成マルチタイムフレーム・バイアスエンジン ️ サマー・ローンチ・オファー — The Oracle Pro を 199 USD で(早期購入者向け)。価格は普及に応じて上昇します。最終価格 399 USD。 The Oracle Pro は、要求の高いプロのトレーダーのために作られた MetaTrader 5 向けのプレミアム・マルチタイムフレーム バイアスエンジン です。ひとつの問いに規律をもって答えます。すなわち、各タイムフレームの現在の方向バイアスは何か、その強さはどれほどか、そしてタイムフレーム同士はどれだけ一致しているか。すべては確定足のみで計算され、リペイントはありません。 The Oracle Pro はマルチファクター・コンセンサス・システムです。独自のインジケーターと最適化されたアルゴリズムを単一の高度なコンセンサス・ベクトルに統合し、それを単一のインジケーター・インスタンス内で現在足と上位足のスタックにわたって読み取ります。複数のチャートにばらばらのツールを積み重ねる代わりに、です。 これは Oracle コンセンサス手法
Introducing Indicator for PainX and GainX Indices Traders on Weltrade Get ready to experience the power of trading with our indicator, specifically designed for Weltrade   broker's PainX and GainX Indices.  Advanced Strategies for Unbeatable Insights Our indicator employs sophisticated strategies to analyze market trends, pinpointing optimal entry and exit points.  Optimized for Maximum Performance To ensure optimal results, our indicator is carefully calibrated for 5-minute timeframe charts on
Gartley Hunter Multi - An indicator for searching for harmonic patterns simultaneously on dozens of trading instruments and on all possible timeframes. Manual (Be sure to read before purchasing) | Version for MT4 Advantages 1. Patterns: Gartley, Butterfly, Shark, Crab. Bat, Alternate Bat, Deep Crab, Cypher 2. Simultaneous search for patterns on dozens of trading instruments and on all possible timeframes 3. Search for patterns of all possible sizes. From the smallest to the largest 4. All fou
Spike detector Rider
Francisco Mandomo Simbine
5 (1)
Spike Detector Rider – Intelligent Trading in Volatile Markets Introduction The Spike Detector Rider  is an advanced system for MetaTrader 5 designed to detect explosive price movements in high-volatility assets such as synthetic indices and commodities. It combines volatility filters, trend analysis, and automated risk management to provide intelligent trade confirmations. After purchase, send me a private message to receive the optimized configuration files,  the installation manual and setup
RealTime Swing Sentinel — Non-Repainting Major Trend & Swing Reversal Indicator for MT5 If you've ever watched an arrow appear on your chart, only to realize the "signal" it's showing you happened four or five candles ago — this indicator was built to end that. RealTime Swing Sentinel is a zero-lag, non-repainting Heiken Ashi trend and swing confirmation system engineered for traders who need to know the instant a trend actually turns, not several bars after the fact. Why most swing/HA indicator
The SyntheticaFX Scalper Pro Indicator is a versatile and user-friendly tool designed to assist traders in identifying high-accuracy entry points across multiple timeframes and all currency pairs. This indicator provides clear visual signals on the chart, along with recommended Stop Loss (SL) and Take Profit (TP) levels, making it easier for traders to plan their trades with confidence. With its built-in dashboard, the SyntheticaFX Scalper Pro Indicator offers real-time trade statistics, helpin
GEM Signal Pro GEM Signal Pro は、MetaTrader 5 向けのトレンドフォロー型インジケーターです。より明確なシグナル、より整理されたトレードセットアップ、そして実用的なリスク管理をチャート上で確認したいトレーダーのために設計されています。 単純な矢印だけを表示するのではなく、GEM Signal Pro はトレード全体の考え方を、より見やすく分かりやすい形で表示します。条件が確認されると、インジケーターはエントリー価格、ストップロス、利確目標をチャート上に表示し、トレードセットアップをより効率的に確認できるようにします。 動作の仕組み このインジケーターは、まず内部ロジックに基づいて有効なシードシグナルを検出します。 確認条件が満たされると、GEM Signal Pro はチャート上に完全なセットアップを表示します。これにより、トレーダーはトレード構造をより明確に把握し、手作業による分析を減らすことができます。 チャート上のトレードレベル 確認済みシグナルに対して、GEM Signal Pro は以下を表示できます。 エントリー価格 ストップロス テ
作者のその他のプロダクト
MTF MA分析:11タイムフレームのSMA/EMA/KAMA価格位置を1パネルで表示。 ### Full Description: ** 複数タイムフレームのチャート監視はもう不要!** MiniBull Periscope - マルチタイムフレーム移動平均線ポジションアナライザー 複数チャートを開かずに全体像を把握!MiniBull Periscopeは、月足(MN1)から1分足(M1)まで、11タイムフレームの移動平均線に対する現在価格の位置を同時に表示します。 **主な機能:** • 11タイムフレームを一画面で:MN1、W1、D1、H12、H8、H4、H1、M30、M15、M5、M1 • 3種類のMA:SMA、EMA、カウフマンAMA(KAMA)をワンクリックで切替 • チャートライン:タイムフレームごとに異なる色の水平MAライン • 距離表示:Pipsとパーセンテージの両方で表示 • 傾き検出:矢印によるトレンド方向の自動表示( →) • シグナルシステム:BUY(MA上)/ SELL(MA下)/ WAIT(中立) • インタラクティブボタン:再読み
MTF複合シグナル分析:11タイムフレームの9指標をスコアリング(-9〜+9)。 ### Full Description: ** 複数タイムフレームのチャート監視はもう不要!** MiniBull MTF Observer - マルチタイムフレーム複合シグナルアナライザー 究極のマルチインジケーターダッシュボード!11タイムフレームで9種類のテクニカル指標を同時に分析し、各タイムフレームに-9から+9の複合スコアを提供。 **分析する9つの指標:** • RSI(相対力指数) • MACD(移動平均収束拡散) • ストキャスティクス • CCI(商品チャネル指数) • モメンタム • SMA 5(単純移動平均) • SMA 20 • EMA 21(指数移動平均) • EMA 50 **主な機能:** • 11タイムフレーム:MN1、W1、D1、H12、H8、H4、H1、M30、M15、M5、M1 • 複合スコア:各タイムフレームに-9〜+9 • シグナル強度:STRONG (±7-9) / BUY-SELL (±4-6) / WEAK (±1-3) / NEUT
MiniBull Logical v21 — シンボル&タイムフレームガイド   全バックテスト結果(222ファイル): https://drive.google.com/drive/folders/1-1QefUiJ1lm6Se0HYCpAmYIbERZ8xjR8 戦略: MN1/W1トレンド + D1フォルスブレイクアウト + マルチTF MA反転 バックテスト: 2024.07.01 – 2026.02.03 | $10,000 | 1:10 | 26,784トレード | 10/20が利益 ️  全テストはEMA(20)で実施。SMAとKAMAは完全にはテストされていません。   ️  入力パラメータ MA種類: EMA ← テスト済 | MA期間: 20 | MAタッ
BullBOP13 — バランス・オブ・パワーズ | ゴールド vs 米国指数 BullBOP13 は、ゴールド( XAUUSD ) と 3 つの米国株価指数( NAS100 、 US500 、 US30 )間 の一時的な乖離を検出します。 4 資産中 3 つが同方向に動き 1 つが逆方向に動く場合、その異常値は反転する傾向のある「フェイクムーブ」です。 動作原理 — 4 層 シグナルフィルター: 1. フェーズフィルター — D1 時間軸 の市場レジーム分析(整列 / 乖離 / 強 い乖離) 2. フェイクムーブ検出 — 3 対 1 ルール: 3 資産 が一致、 1 つが乖離 = シグナル発生 3. レシオ反転 — ゴールド / 指数 レシオの EMA+ 標準偏差 バンドで乖離の転換を確認 4. 価格確認 — フェイクムーバーの MA 乖離度 が減少中であること 4 層 すべてが同時に一致した場合のみシグナルを生成。 機能: • サブウィンドウのレシオチャート( EMA 、 ±1/±2 SD ボリンジャーバンド付き、色分け表示) • 全 4 条件 トリガー時に BUY/SEL
Minibull AMA Sniper v7.30 は、NAS100(ナスダック100)向けに最適化されたプロフェッショナルなトレンドフォロー型エキスパートアドバイザーです。US30(ダウ)、SPX500(S&P500)、DAX40 にも対応しています。ブローカーのシンボル名(NAS100、US100、NASDAQ100、USTEC、NQ100、US30、NYA30、NYSE30、SPX500、US500 など)を自動検出し、適切に動作します。 戦略は日足(D1)上の AMA(200) と AMA(9) の2本の適応移動平均を基盤とし、H1 ローソク足の終値でシグナルを生成します。 **シグナルロジック** - BUY:価格が AMA(200) と AMA(9) 両方を上回って終値 - SELL:価格が両 AMA を下回って終値 - ニュートラル:価格が2本の間 — 全ポジションをクローズ **リスク管理** - テイクプロフィット:2000 USD · ストップロス:600 USD(ダッシュボードからリアルタイム調整可) - 緊急ストップ:1000 USD · 1日最大5トレ
# MiniBull Logical Pro: a trend-fade system, tested through real market stress ## What it is MiniBull Logical Pro is a multi-timeframe trend and false-breakout trading system, available as an MT5 Expert Advisor, a cTrader cBot, and a standalone cTrader indicator. The engine is the same across all three: - **Monthly + Weekly trend confluence** sets the directional bias. The system only trades in the direction both higher timeframes agree on — if they disagree, no trend, no trade. - **Daily fa
### BullBOP19 Live EA — ゴールドと米国株価指数の「フェイクムーブ」検知システム BullBOP19 は、MetaTrader 5 向けの完全自動売買 EA(エキスパートアドバイザー)です。ゴールドと米国の主要株価指数(NASDAQ 100、S&P 500、US30/DJIA)との間の力関係(Balance of Power)を分析することを基本ロジックとしています。ゴールドの値動きをこれらの指数と比較することで、本当の勢いを伴わない「フェイクムーブ」を検知し、信頼性の低いシグナルをエントリー前にフィルタリングします。 **主な特徴** - あらゆる銘柄・あらゆる時間足で動作(Gold / NDX / SPX / US30 の銘柄を自動検出、または手動設定も可能) - シグナル生成に使う移動平均のタイプ、期間、価格ソースをカスタマイズ可能 - ATR(ワイルダーATR)ベースの安全ストップロスにより、ボラティリティの状況に応じた一貫したリスク管理を実現 - テイクプロフィット、トレーリングストップ、ブレークイーブンをすべて ATR 倍数で設定 - 最大保有
**Minibull AMA Sniper — 非リペイント・シグナルインジケーター** Minibull AMA Sniperは、2本のカウフマン適応移動平均線(Kaufman AMA) — AMA200とAMA9 — を軸としたトレンド位置判定インジケーターで、方向感のない停滞市場での取引を防ぐ独自の「スロープ確認フィルター(Slope Confirm)」を搭載しています。 **動作原理** 本インジケーターは、価格が2本のAMAに対してどの位置にあるかを追跡します。 - **BUY(買い)**:価格がAMA200とAMA9の両方の上で終値を付けたとき - **SELL(売り)**:価格がAMA200とAMA9の両方の下で終値を付けたとき - **NEUTRAL(中立)**:価格が2本の平均線の間にあるとき 価格の位置だけでは不十分です。Slope Confirmフィルターは、AMA自体がシグナルの方向へ実際に傾いているかを確認します。AMAが横ばいの場合、シグナルは中立に取り消され、弱くだまされやすいセットアップを除外します。 **Swing / Scalp 自動モー
**チャートを切り替えずに、重要なすべての時間軸で価格の位置を正確に把握できます。** MiniBull LOP は、複数の時間軸を同時に分析するトレーダー向けのマルチタイムフレーム・ダッシュボード指標です。MN、W、D、H8、H4、H1、M30、M15、M5、M1 のそれぞれについて、直前の確定バーに対する価格の位置(上抜け/下抜け、レンジ内で終値より上/下、終値と同値)、カウフマン適応型移動平均線(AMA)によるトレンド判定、そして直前の確定バーのティックボリュームとその時間軸自身の直近平均ボリュームとの比率を表示します。 **主な機能** - Panel / Lines / AMA の実際にクリックできるトグルボタンを備えたチャート上のダッシュボード。 - 価格の位置に応じて自動的にサポート(緑)またはレジスタンス(赤)に色が変わる、常時表示のレベルライン。 - チャート上に直接描画され、バーごとに価格を追従する連続的なAMAライン。 - 追跡しているすべての時間軸のブル/ベア状態を一行で表示するトレンドサマリー。 - チャート上に直接表示されるブレイクアウトマーカー。読み
VAMA Signal Simulatorは7つの時間足(M1〜D1、重み5%〜30%)をスキャンし、それぞれを4本の移動平均線と6つのオシレーターでスコア化して、加重合成のStrong Buy/Buy/Neutral/Sell/Strong Sellシグナルにまとめます。確定シグナルは、ボラティリティに応じて期間が変化するH4移動平均線(高ボラティリティでは期間短縮、落ち着いた相場では期間延長)の方向、およびM15とH1のトレンド方向の両方と一致する必要があります。 確定シグナルごとに、方向別に色分けされた矢印とBUY/SELLラベルがチャートに表示され、エントリー価格・ATR・利確・損切りを記載したCSVログも記録されます。SL/TPの距離、ロットサイズ、そしてオプションの再エントリーモード(反転を待たずに前回のトレードが決済され次第、同方向で新規エントリー)はすべてInputsから調整可能です——デフォルト値は元の1:1リスクリワード戦略を正確に再現しており、変更は明示的なオプトインの逸脱です。 パネルにはWin/Loss/Pendingのリアルタイム集計、勝率、指定ロットでのシ
MiniBull Algorithmic Signal Engineは、MetaTrader 5向けのマルチタイムフレーム取引システムで、インジケーターとEA(自動売買)の両方で利用可能です。7つの時間足(M1〜D1)をそれぞれ4本の移動平均線と6つのオシレーターでスコア化し、ボラティリティに応じて期間が変化するH4トレンド平均線(VAMA)で結果をフィルタリングし、M15とH1の両方が方向を確認した場合のみ行動します——部分的な確認は認めません。 EAには2つのモードがあります:Faithful(固定0.02ロット、リスクリワード比1:1、元のスクリプトを正確に再現)またはFlexible(口座資金の割合からロットを算出、ストップロス/テイクプロフィットを個別に設定可能、デフォルトは1:2.5)。チャート上のライブパネルには実際の損益、勝率、現在のシグナル方向が表示され、ワンクリックで新規取引を即座に一時停止できるボタンも備えています。 SPX500で検証済み(2024.04〜2026.07、バックテスト+フォワード):取引数88回、純利益+12,836ドル、平均プロフィットフ
フィルタ:
レビューなし
レビューに返信