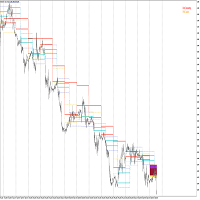
Support and Resistance High Volume Boxes
- Göstergeler
- Sürüm: 1.0

HighVolume SR Boxes is a professional support and resistance zone indicator designed to identify important price areas using confirmed pivot structure and volume-based filtering.
Instead of drawing simple horizontal lines, the indicator highlights market zones as dynamic boxes, helping traders see where price has previously reacted with meaningful volume participation. These zones can be used to observe potential reversals, breakouts, retests, and role-reversal behavior between support and resistance.
◆ Overview
The indicator detects support and resistance zones from confirmed swing points and filters them with delta-style volume logic. Support zones are created from bullish volume conditions around confirmed pivot lows, while resistance zones are created from bearish volume conditions around confirmed pivot highs.
Each zone is displayed as a visual box on the chart. The box width is based on volatility, allowing the indicator to adapt to different symbols and timeframes.
This makes the tool useful for traders who want a cleaner view of key reaction areas without relying on repainting signals or unstable live-bar confirmation.
◆ Key Features
Professional Support and Resistance Boxes
The indicator automatically draws support and resistance zones based on confirmed pivot points and volume filtering.
Support boxes highlight potential demand areas.
Resistance boxes highlight potential supply areas.
Zone thickness adapts to market volatility.
Boxes extend forward until price interaction or a new relevant zone appears.
Volume-Based Zone Filtering
The indicator uses positive and negative volume behavior to filter stronger zones.
Green zones represent support areas supported by positive volume.
Red zones represent resistance areas supported by negative volume.
This helps reduce unnecessary zones and focuses attention on areas with stronger market participation.
Breakout and Role-Reversal Logic
When price breaks a support zone, that area may become future resistance.
When price breaks a resistance zone, that area may become future support.
The indicator visually marks these events to help traders observe potential changes in market structure.
Hold Signals
Support hold markers show when price reacts from a support zone.
Resistance hold markers show when price rejects from a resistance zone.
These signals are designed as visual confirmation tools and should be combined with the trader’s own strategy, risk management, and market context.
Non-Repaint Confirmation Logic
The indicator is built for stable confirmed-bar analysis.
It does not use the current live candle to confirm important signals.
Signals are confirmed only after the candle has closed.
Confirmed historical signals are not recalculated or moved afterward.
Pivot zones are created only after the pivot condition is fully confirmed.
This makes the indicator suitable for manual analysis, Strategy Tester review, and multi-timeframe chart study.
◆ Main Settings
Lookback Period
Controls the pivot sensitivity used to detect support and resistance zones.
A lower value creates more frequent zones.
A higher value creates fewer but more significant zones.
Delta Volume Filter Length
Controls the volume filtering period.
A higher value applies stronger filtering and may remove weaker zones.
A lower value makes the indicator more sensitive to volume changes.
Adjust Box Width
Controls the vertical thickness of the support and resistance boxes.
The box width is based on volatility, making the zones adaptive across different instruments.
Max History Bars
Limits how many historical bars are processed when the indicator is first loaded, improving performance and stability.
Max Boxes
Controls the maximum number of zones shown on the chart to keep the workspace clean.
◆ How to Use
Use green support zones to observe possible demand areas.
Use red resistance zones to observe possible supply areas.
Watch for price reactions, breakouts, and retests around these zones.
A broken resistance zone may become future support.
A broken support zone may become future resistance.
Combine the indicator with trend analysis, price action, volume context, and proper risk management.
◆ Recommended For
Forex trading
Gold and commodities
Indices
Crypto CFDs
Multi-timeframe support and resistance analysis
Breakout and retest trading
Price action confirmation
◆ Important Notes
This indicator does not guarantee future price movement.
It is not a fully automated trading system.
Signals should not be used alone without confirmation and risk management.
Market conditions can change quickly, and traders should always test the indicator on their own symbols and timeframes before using it in live trading.
Veyra HighVolume SR Boxes NR MT5 is designed to provide a clean, structured, and non-repainting view of volume-based support and resistance zones, helping traders identify key market areas with greater clarity.