MT5 Liquidity Sweeps Indicator

MT5 Liquidity Sweeps Indicator


MT5 Liquidity Sweeps Indicator detects buy-side and sell-side liquidity sweeps using swing-based market structure analysis. The indicator supports Wick-Based Sweeps, Break-and-Retest Sweeps, and Combined detection modes while tracking sweep lifecycle states including detected, touched, mitigated, and expired zones. Additional features include configurable mitigation logic, liquidity level visualization, event alerts, swing structure analysis, and historical sweep zone tracking for structured liquidity analysis in MetaTrader 5.


Liquidity Sweeps Concept Explained

Liquidity sweeps occur when price moves beyond previous swing highs or lows where stop orders and resting liquidity are commonly concentrated.

In ICT and Smart Money Concepts (SMC) methodologies, swing highs often represent buy-side liquidity, while swing lows represent sell-side liquidity. When price reaches these areas, it may briefly trade beyond the level before reversing — interacting with the resting orders concentrated there.

These events can appear in different market contexts: as part of a reversal, a continuation move, or a displacement phase. Rather than assigning fixed directional meaning to every sweep, the indicator focuses on identifying the structural behavior itself — where price went, how far it moved, and whether it returned.


Not every move beyond a swing high or low qualifies as a liquidity sweep. Sweep structure depends on how the swing was formed, how far price penetrated beyond the level, and how quickly it returned. A brief wick through a level and a sustained break that later retraces carry different structural characteristics — and the indicator treats them differently.

To keep the detection precise, the indicator includes configurable swing validation, minimum sweep distance filtering, mitigation logic, and sweep lifecycle tracking.


MT5 Liquidity Sweeps Indicator — Key Features


Liquidity Sweep Detection Modes

The indicator supports three sweep detection modes: Wick-Based Sweeps, Break-and-Retest Sweeps, and Combined Mode.

Wick-Based Sweeps focus on immediate rejection after price moves through a liquidity level. The sweep zone forms when price briefly pushes beyond a previous swing high or low and then returns back through the level.

Break-and-Retest Sweeps use delayed directional sweep behavior. Price first breaks a liquidity level, returns back through it, and forms a sweep zone based on the displacement structure. If price later revisits that zone within the allowed retest window, the interaction is registered as a sweep event.

Combined Mode allows both detection models to operate simultaneously.

The detection engine also includes configurable minimum sweep distance filtering. Sweeps can be validated using tick-based or percentage-based displacement requirements, helping filter out low-displacement liquidity interactions.


Swing-Based Liquidity Levels

Liquidity sweep detection is built around swing structure analysis rather than fixed candle patterns.

The indicator automatically identifies swing highs and swing lows that can act as potential liquidity levels. These levels are then monitored for sweep interactions and directional liquidity events.

Structural swing labels are also supported directly on the chart.

Horizontal swing levels can remain visible after formation, making it easier to track where liquidity may still be resting.

Swing sensitivity is controlled through the Swing Strength parameter. Higher values create stricter structural validation, while lower values react faster to developing market movement.

The indicator also includes Swing Expiration logic, limiting how far apart swing structures can be while still qualifying for sweep detection.


Sweep Zone Lifecycle Management

The indicator tracks the lifecycle state of every sweep zone after detection.

Sweep zones can transition through multiple states: Detected, Touched, Mitigated, and Expired.

A touch event occurs when price re-enters the sweep zone before mitigation conditions have been satisfied.

Mitigation and expiration are tracked independently, allowing active, mitigated, and expired sweep zones to be visually separated on the chart.

Expired and mitigated zones can remain visible as historical liquidity references rather than disappearing immediately after state transition.

The Sweep Zone Expiration setting controls how long sweep zones remain active before becoming expired.


Mitigation Mode & Reaction Control

The indicator supports multiple mitigation models for sweep zone interaction tracking: Touch (High/Low), Full Fill (High/Low), Body Close Inside (Close), and % Fill (High/Low or Close).

Touch mode considers the zone mitigated as soon as price interacts with the sweep area. Full Fill requires complete zone coverage before mitigation is registered.

Body Close Inside uses candle close confirmation instead of wick extremes.

% Fill mode requires price to mitigate a configurable percentage of the sweep zone depth.

The indicator also includes Skip Immediate Mitigation logic. This prevents newly created sweep zones from being mitigated too quickly during immediate post-sweep volatility. Mitigation Skip Bars controls how many bars are ignored before mitigation tracking becomes active.


Alerts & Event Signals

The indicator supports alert and signal events for every major sweep lifecycle stage: Sweep Detected, Sweep Touch, Sweep Mitigated, and Sweep Expired.

Touch events are tracked independently from mitigation events, allowing sweep interaction and full mitigation to be monitored separately.

Available alert types include popup alerts, sound alerts, and email notifications.

Buy-side and sell-side sweep markers can also be displayed directly on the chart for visual event confirmation.

Active sweep zones, touched zones, mitigated zones, and expired zones remain visually distinguishable during market replay and live analysis.

Run it quietly, or use it as an active liquidity monitoring tool.


Chart Visualization & Sweep Levels

The indicator includes multiple visualization tools for monitoring liquidity structure directly on the chart.

Swing highs and lows can be extended as horizontal liquidity levels, allowing previous liquidity areas to remain visible after the original swing forms.

Sweep zones are displayed directly on the chart using separate bullish and bearish visual states.

Buy-side and sell-side sweep markers use independent color settings for faster visual recognition during live analysis.

Historical sweep zones can remain visible after mitigation or expiration, preserving previous liquidity reactions and structural context.


How to Interpret and Use the MT5 Liquidity Sweeps Indicator


Reading Wick-Based Sweeps

Wick-Based Sweeps focus on immediate rejection after liquidity interaction.

A bearish sweep forms when price moves above a previous swing high and quickly returns back below the level. A bullish sweep follows the same logic on swing lows.

These reactions often appear around short-term liquidity grabs where price briefly trades beyond resting liquidity before reversing back through the level.


Understanding Break-and-Retest Sweeps

Break-and-Retest Sweeps use delayed directional sweep behavior.

Price first breaks through a liquidity level, then returns back through it and forms a sweep zone based on the displacement structure. If price later revisits that zone within the configured retest window, the interaction is registered as a sweep event.

Unlike Wick-Based Sweeps, the reaction does not need to happen immediately after the initial liquidity break.


Using Combined Mode

Combined Mode allows Wick-Based and Break-and-Retest sweep detection to operate simultaneously.

This makes it possible to track both immediate liquidity rejection and delayed sweep structures within the same workflow.


Interpreting Sweep Lifecycle States

Each sweep zone can transition through multiple structural states: Detected, Touched, Mitigated, and Expired.

Touch events represent the first return into the sweep zone before mitigation conditions have been satisfied.

Mitigated zones represent completed interaction based on the selected mitigation model.

Expired zones indicate that price failed to revisit or mitigate the sweep within the configured expiration period.


Using Swing Levels as Liquidity References

Swing highs and lows are used as the primary liquidity reference points for sweep detection.

Previous swing levels can remain extended on the chart after formation, making it easier to monitor where liquidity may still be resting.

Higher swing sensitivity produces stricter structural validation, while lower sensitivity reacts faster to developing market movement.


Indicator Settings & Parameters


Alerts

  • Enable Pop Up Alert — Displays an on-screen popup when a sweep event alert is triggered.
  • Enable Sound Alert — Plays an audio notification for supported sweep events.
  • Alert Sound File — Selects the sound file used for audio alerts.
  • Enable Email Alert — Sends email notifications when supported sweep events occur. Requires MetaTrader email settings to be configured.
  • Email To — Defines the recipient email address for alert notifications.


General

  • History Bars To Process — Defines how many historical bars are used for sweep detection calculations.
  • Liquidity Sweeps Mode — Selects the sweep detection model: Wick-Based Sweeps, Break-and-Retest Sweeps, or Combined Mode.
  • Swing Strength — Controls how strictly swing highs and lows are validated before qualifying as liquidity levels. Higher values create stricter structure. Lower values react faster to developing price movement.
  • Minimum Sweep Distance Mode — Defines how minimum sweep penetration is measured: Ticks or Percentage.
  • Minimum Sweep Distance Ticks — Defines the minimum sweep penetration distance when tick-based validation is used.
  • Minimum Sweep Distance Percentage — Defines the minimum sweep penetration distance when percentage-based validation is used.
  • Retest Max Bars — Defines the maximum number of bars allowed for retest validation in Break-and-Retest sweep mode.
  • Sweep Zone Expiration (Bars) — Defines how long sweep zones remain active before transitioning into expired states.
  • Swing Expiration (Bars) — Defines the maximum allowed distance between swing structures used for sweep detection. Older swing levels outside this range are ignored.


Mitigation

Mitigation Mode

Defines how price must interact with a sweep zone for mitigation to be registered.

  • Touch — zone is mitigated as soon as price High or Low interacts with the sweep area
  • Full Fill — price High or Low must fully cover the entire zone before mitigation is registered
  • Body Close Inside  — mitigation requires a candle to close inside the zone rather than simply touching it with a wick
  • % Fill — a configurable percentage of the zone depth must be filled, validated using either High/Low prices or candle Close depending on the selected Mitigation Price Mode
  • Mitigation Price Mode — Defines whether mitigation validation uses High/Low or Close prices.
  • Mitigation % — Defines the required percentage of zone fill when percentage-based mitigation mode is used.
  • Skip Immediate Mitigation — Prevents newly created sweep zones from being mitigated too quickly immediately after detection.
  • Mitigation Skip Bars — Defines how many bars are ignored before mitigation tracking becomes active.


Sweep Alerts & Signals

  • Enable Sweep Detected Alert — Triggers an alert when a new sweep zone is detected.
  • Enable Sweep Touch Alert — Triggers an alert when price re-enters a sweep zone before mitigation.
  • Enable Sweep Mitigated Alert — Triggers an alert when a sweep zone becomes mitigated.
  • Enable Sweep Expired Alert — Triggers an alert when a sweep zone expires.
  • Enable Sweep Detected Marker — Displays chart markers for newly detected sweep zones.
  • Enable Sweep Touch Marker — Displays chart markers when price touches a sweep zone.
  • Enable Sweep Mitigated Marker — Displays chart markers when mitigation occurs.
  • Enable Sweep Expired Marker — Displays chart markers when sweep zones expire.


Chart Visuals

  • Buy-Side Sweep Color — Defines the color used for bullish sweep markers and sweep zones.
  • Sell-Side Sweep Color — Defines the color used for bearish sweep markers and sweep zones.
  • Mitigated Sweep Color — Defines the color used for mitigated sweep zones.
  • Expired Sweep Color — Defines the color used for expired sweep zones.
  • Sweep Zone Opacity — Controls transparency of sweep zone visualization.
  • Show Swing Points — Displays swing structure labels directly on the chart.
  • Show Swing Levels — Displays horizontal liquidity levels derived from swing highs and lows.
  • Max Displayed Swings — Defines the maximum number of swing structures displayed simultaneously on the chart.
Önerilen ürünler
Phantom Edge SMC
Nattapon Chuekamhod
Phantom Edge SMC — The Ultimate Smart Money Indicator for MT5 Tired of manually drawing structures while trading SMC or ICT concepts? Let Phantom Edge SMC do the heavy lifting for you. Key Features Internal & Swing Structure: Automatically detects BOS and CHoCH across two structural levels. Order Blocks (OB): Identifies Internal and Swing OBs with automated mitigation tracking. Equal Highs / Lows: Highlights EQH / EQL to pinpoint Liquidity pools. Fair Value Gaps (FVG): Displays FVGs with
ARE Quantum Liquidity Institutional Smart Money Engine ARE Quantum Liquidity is an advanced Smart Money Concepts (SMC) indicator designed to help traders identify institutional liquidity movements and high-probability trading opportunities. The indicator analyzes market structure in real time and automatically detects important price action elements used by professional traders, including Break of Structure (BOS), Change of Character (CHoCH), Order Blocks, Fair Value Gaps (FVG), Liquidity Swe
Cycle Projection Pro is a cyclical analysis indicator for MetaTrader 5, designed for the Daily timeframe. It identifies and projects recurring price cycles forward in time, helping you estimate when — not how much — the market may be approaching a turning point. How it works The indicator sums six harmonic cycles with explicit periods — Weekly, Biweekly, Monthly, Quarterly, Semiannual, Annual — each independently adjustable and can be turned on or off. Their combination produces a composite wav
Visual Heatmap Book Analyzer
Alexandre Moraes De Souza Lima
Visual Heatmap Book Analyser This indicator monitors the market liquidity and generates colors based on order patterns, quantities, and renewal activities in the book. This allows you to visualize the order flow and identify areas of high and low liquidity and activity. The indicator uses machine learning techniques to analyze the order behavior in the book, enabling it to detect patterns and trends in orders, allowing you to make informed decisions about your trading operations. The color pale
The indicator is designed to work on any trading platform. The program is based on proprietary algorithms and W.D.Ganna's mathematics, allowing you to calculate target levels of price movement based on three points with the highest degree of certainty. It is a great tool for stock trading. The indicator has three buttons: NEW - call up a triangle for calculation. DEL - delete the selected triangle. DELS - completely remove all constructions. The probability of achieving the goals is more than 80
Bastion Sentinel Core
Matthew David Cracknell
Bastion Sentinel Core — Daily Zones, 4-Hour Rejection Signals Overview Bastion Sentinel Core identifies supply and demand zones on the Daily timeframe — price levels where the market has previously attempted to break through and failed — and marks non-repainting BUY/SELL arrows when price re-tests and rejects those zones on the 4-Hour timeframe. Timeframes are fixed in this edition: zones are always mapped from Daily, and rejections are always confirmed on the 4-Hour close.  This is an analysis
IQ FX Gann Levels a precision trading indicator based on W.D. Gann’s square root methods . It plots real-time, non-repainting support and resistance levels to help traders confidently spot intraday and scalping opportunities with high accuracy. William Delbert Gann (W.D. Gann) was an exceptional market analyst, whose trading technique was based on a complex blend of mathematics, geometry, astrology, and ancient mathematics which proved to be extremely accurate. We don't offer free or bonus indic
Product Overview Global Session Zones System is a chart indicator designed for both   MT4 and MT5   platforms. It visualizes the four major global trading sessions (New York, London, Tokyo, Sydney) by drawing session background boxes, key price levels, and a statistical panel. It helps traders identify market volatility and trend strength, providing reliable breakout signals. Core Features Session Visualization : Customizable start/end times and colors for the four major sessions. Technical Anal
Master Edition, piyasa yapısını hacim ve para akışı merceğinden görselleştirmek için tasarlanmış profesyonel kalitede bir analiz aracıdır. Standart hacim göstergelerinin aksine, bu araç doğrudan grafiğinizde bir Günlük Hacim Profili görüntüleyerek, fiyat keşfinin tam olarak nerede gerçekleştiğini ve "akıllı paranın" nerede konumlandığını görmenizi sağlar. Bu Master Edition, netlik ve hız için tasarlanmıştır ve yüklendiğinde grafik düzeninizi anında güzelleştiren benzersiz bir Otomatik Tema Senkr
Graded Liquidity Sweep
Kaustubh Pradeep Deshmukh
This indicator marks the candles where price runs through a liquidity level and turns back. It finds and ranks the levels by itself, so there is nothing to draw by hand. It is made for manual trading on any symbol and timeframe. What you see on the chart A buy or sell arrow on the candle that confirms the reversal. Arrows appear only after that candle has closed, and they do not repaint. For every signal: the level that was swept, a stop level and two target levels. A label with the type of leve
Session Flow Board A session scoreboard for XAUUSD and NAS100. One glance tells you who has been leaning on the session: buyers, sellers, or neither. It splits session tick volume into a buy proxy and a sell proxy from where each bar closed inside its range. Close near the high, the bar counts more as buy. Close near the low, more as sell. That running difference is the session CVD. What you see Session buy and session sell Session CVD and the last closed bar's delta Tilt, in percent POC, VAH an
Delta Profile Volume
Teresinha Moraes Correia
Technical Description of the Indicator – Delta Profile for MetaTrader 5 The Delta Profile is an indicator developed for MetaTrader 5 focused on detailed analysis of volume flow within a defined range of candles. It organizes and displays information about the imbalance of positive volumes (associated with upward movements) and negative volumes (associated with downward movements) at different price levels. The result is a clear view of the chart points where the highest concentration of trades o
OrderFlow Supply and Demand Pro: Institutional Liquidity Engine The OrderFlow Supply and Demand Pro is a high-performance analytical engine designed to pinpoint institutional footprint on your charts. By combining algorithmic price action filters with a real-time pressure engine, this tool identifies high-probability liquidity zones where large-scale market participants are likely to re-enter the market. Core Institutional Logic Our proprietary detection system filters out market "noise" by enfo
Angus Orderflow Heatmap
Mr Monthon Chaipreechapat
Volume Footprint & Heatmap Indicator This indicator combines Volume Footprint and Heatmap visualization, inspired by the Order Flow and Heatmap concepts found in Bookmap. Unlike futures markets, the Forex market does not provide real exchange-traded volume data. Instead, it only offers Tick Volume . This indicator is designed to simulate Bookmap-style market visualization as closely as possible using the available Tick Volume data. Because the indicator relies on Tick Volume, the quality and acc
View Trade Status
Jose Pablo Estrella Mejia
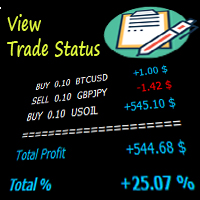
This indicator will help you have a better visualization of the status of your open trades. You can see profits or losses in USD or %, as well as a total of all trades and the percentage of profit or loss according to your account size. You can change the font size and color. I hope you find it useful and it makes monitoring your trades easier.  This indicator adjusts to the size of your screen and will be positioned in the bottom right corner of your screen for better convenience.
Indicator LTS for MT5 (Level + Trends + Speed) The LTS indicator was specially created for quick analysis of consolidations on the chart, which greatly facilitates decision-making when trading. LTS marks resistance and gives information about the forces affecting it, as well as the current speed and average travel. The indicator is easily customizable and can analyze any timeframe.    LTS uses a unique trend analysis algorithm based on 4 parameters from global to local.
Overview The Market Perspective Structure Indicator is a comprehensive MetaTrader indicator designed to provide traders with a detailed analysis of market structure across multiple timeframes. It identifies and visualizes key price action elements, including swing highs and lows, Break of Structure (BOS), Change of Character (CHOCH), internal structures, equal highs/lows, premium/discount levels, previous levels from higher timeframes, and trading session zones. With extensive customization opt
Support Resistance Catcher Indicator Features and Explanation Overview: The Support Resistance Catcher is a custom MT5 indicator designed to identify and visualize supply (resistance) and demand (support) zones based on candlestick price action. It detects zones where price has reversed after rallies or drops, using wick rejections and clustering. The indicator draws horizontal rectangles for active and historical zones, with customizable colors, labels, and alerts. Key Features: 1. Zone Det
ALYAS TrendAngle ALYAS TrendAngle is a professional MetaTrader 5 chart indicator designed to help traders analyze market structure, trend direction, and the strength and slope of dynamic support and resistance. The indicator automatically identifies confirmed swing highs and swing lows, draws dynamic support and resistance trendlines, and calculates their normalized slope angles using ATR-based analysis. Whether you are a beginner looking for a clearer view of the current market structure or an
Breakout Boxes with Volume Pressure This indicator automates the identification of key consolidation zones (Supply and Demand) based on Market Pivots and Volatility (ATR). Unlike standard support/resistance tools, this indicator provides a unique   Volume Pressure Analysis   inside every box, giving you insight into the battle between Buyers and Sellers before a breakout occurs. Key Features Automated Supply & Demand Zones:   Automatically detects significant Pivot Highs and Lows to draw dyna
RAD CRITICAL LEVES RAD indicator tracks “Relevant Volume” in real time, identifying accumulation and distribution processes, projecting them in the chart as SUPPORT or RESISTANCE zones. Natural   support   and resistance levels are generated by Volume Accumulation and Distribution processes. As these processes evolve, levels at which the relevant volume in the market place is positioned, become difficult areas to cross upwards or downwards. By using this information, traders can identify very s
Zone Structure Scanner Panel for MT5 Find better setups faster — without scanning charts for hours. The Zone Structure Scanner Panel for MT5 helps you automatically scan multiple symbols, detect key weekly and daily support/resistance zones, read market structure, highlight confluence, and flag H4 rejection-confirmed setups from one powerful panel. Instead of jumping from chart to chart, you get ranked opportunities in one place so you can focus on the setups that matter most. Why it stands
WAPV Box Effort x Result
Eduardo Da Costa Custodio Santos
MT5 için WA_PV_BOX_EFFORT X SONUÇ WAPV Box Effort x Result Indicator, Paket Göstergeleri grubunun (Wyckoff Academy Wave Market) bir parçasıdır. MT5 için WAPV Box Effort x Result Indicator , fiyat ve hacmi okumanıza yardımcı olur. Okuması, çaba x sonucunun tanımlanmasına yardımcı olmaktan ibarettir. grafik tarafından oluşturulan dalgalarda. Kutu yeşil olduğunda MT5 için WAPV Kutusu Eforu x Sonuç Göstergesi, hacmin talebin lehine olduğu ve kutunun kırmızı olduğu anlamına gelir hacim arzdan yana. K
Vector Fibo Scalp is a speed and breakout-oriented intraday indicator. It monitors current price movements against daily high/low channels and provides immediate signals upon breakout confirmation. Key Features: Vector Velocity: Fast detection of daily breakouts using moving average channels. Visual candles: 4-color candle highlighting engine for active scalping states. Breakout Targets: Automatic projection of profit targets up to 161.8% Fibo ratio. R:R Panel: Dynamic calculations of risk-to-re
Part of the Shved Market Analysis System (SMAS). Identifies areas of maximum Supply and Demand zone density and confluence, providing deeper market insight as part of the integrated SMAS ecosystem. Shved Supply and Demand Cluster Profile is a revolutionary, high-performance visualization tool designed to map market volume density and supply/demand zone clusters, created by a professional trader for traders. The Shved Supply and Demand Cluster Profile is a core component and the analytical hear
Bu göstergeye benzersiz ve keskin bir avantaj kazandıran kavramlar, en iyi mentorlardan biri olan Arjo tarafından tasarlanıp derlenen "Adil Değer Boşlukları Teorisi"ne dayanmaktadır ve ben de açıklanan kavramlara geliştirme yönünü ekledim. Video serisi, kapsamlı açıklamalar için orijinal YouTube bağlantılarını ve derlenmiş MT4/5 sisteminin çalışır durumdaki ekran görüntülerini içerecektir. Yayınlanan tüm sistemler, tüm platformlara ve kullanıcı isteklerine uyum sağlamak için MT4 ve MT5'te ayrı a
Babel Assistant
Iurii Bazhanov
4.33 (9)
Babel assistant 1 MT5 netleştirme (netting) robotu "Babel_assistant_1", M1, M5, M15, H1, H4, D1 ve W1 zaman dilimlerinde Fibonacci seviyeleri oluşturmak için ZigZag göstergesini kullanır ve alım ile satım trendlerinin gücünü hesaplar. Belirtilen 4,925 trend seviyesi aşılırsa, "Lot for open a position" ayarını kullanarak bir pozisyon açar. Ardından Babel, belirli Fibonacci seviyelerinde bekleyen emirler (pending orders) yerleştirir ve belirtilen Stop Loss (Zarar Durdur) ile Take Profit (Kâr Al) ç
FREE
GDS Renko Entry Helper - Free Renko Price Interaction Indicator for MetaTrader 5 GDS Renko Entry Helper is a free Renko price interaction indicator for MetaTrader 5. It helps traders highlight important areas where price reacts, slows down, returns to a zone or changes behavior around support and resistance. The tool is designed for manual Renko analysis. It does not generate buy or sell signals and does not tell the trader when to enter the market. Its purpose is to help focus attention on area
Fluxo smart L
Natanael Bastos Alves
After purchasing the product, please contact us at: escritorioremotoiq28@gmail.com or Natanael.playoff@gmail.com. ​Upon contacting us, you will receive an additional indicator (included in the image) along with a detailed guide on how to use it. The files and instructions will be sent directly to your email. **Flow Code: Institutional Liquidity & Amplitude Analyzer** **The Flow Code is the ultimate tool for those who want to trade the real market flow.** Developed for **professional traders*
Представлен принципиально новый индикатор ZigZag, который отличается от стандартного абсолютной легкостью, быстродействием расчетов и очень высокой точностью. В основе индикатора заложен принцип цикличности рынка с совокупностью анализа количества текущих баров и их основных ценовых уровней. Чем меньше баров для определения расчетов, тем более агрессивная постройка линий индикатора. Как и в  стандартном индикаторе перерисовывается только последняя линия, при изменении достигнутого экстремума. П
Bu ürünün alıcıları ayrıca şunları da satın alıyor
Neuro Poseidon MT5
Daria Rezueva
4.75 (52)
Neuro Poseidon is a new indicator by Daria Rezueva. It combines precise trading signals with adaptive TP/SL levels - creating best possible trades as a result! Message me and get  Neuro Poseidon Assistant  as a gift to automize your trading process! What makes it stand out? 1. Proven profitability on all assets and timeframes 2. Only confirmed BUY and SELL signals present on the chart 3. Adaptive TP & SL levels generated by the software for each trade 4. Easy to understand - suitable for al
RelicusRoad Pro MT5
Relicus LLC
4.96 (25)
İşlemlerinizi tahminle yapmayı bırakın. Ne zaman gireceğinizi, nereden çıkacağınızı ve piyasanın hangi yöne eğildiğini, hepsini tek grafikte görün. RelicusRoad Pro, neredeyse yirmi aracı tek bir göstergede toplar; işlem tarzınıza uyan araçları açarsınız. Net girişler. Net çıkışlar. Her grafikte bir plan. Tanıdık geliyor mu? Alım yaparsınız, bir dakika sonra fiyat aleyhinize döner. Erken kapatırsınız, sonra hareketin sizsiz devam ettiğini izlersiniz. Grafikte beş gösterge, beş farklı cevap. Zarar
Merhaba yatırımcılar! Birçok bireysel yatırımcı yavaş web komut dosyaları kullanıyor. Kârlı işlem yapmak için sistematik bir yaklaşım şarttır. Astro AI göstergesi sadece bir grafik üzerindeki görselleştirme değildir. Doğrudan terminal içinde çalışan iki ajandan oluşan gelişmiş bir sinir ağıdır. Sistemin teknik detayları: 1. Ajan 1: Analist (Grafiksel Sinir Ağı – GNN) Piyasa, tek tek fiyat çubuklarından değil, birbirine bağlı verilerden oluşan bir ağdan oluşur. İşlev: Ajan 1, bu karmaşık, d
Quant Direction MT5
Georgios Kalomoiropoulos
Quant Direction, 3 boyutlu bir piyasa analiz aracıdır. Çeşitli parametrelerdeki yüzdesel sapmaları hassas bir şekilde hesaplayan, tamamen objektif, algoritma tabanlı piyasa analizi sunar. Gelişmiş yapay zeka tabanlı modelleme araçları kullanılarak geliştirilen ve titizlikle test edilen bu algoritma, piyasayı benzersiz bir hassasiyetle analiz eder. Platformda herhangi bir döviz çiftini veya finansal enstrümanı analiz edebilirsiniz. İster kısa vadeli, ister günlük, isterse swing trading yapın, Qua
Btmm state engine pro
Garry James Goodchild
5 (4)
BTMM State Engine Pro by G-Labs — Beat The Market Maker indicator for MetaTrader 5. Asian session range, London and New York kill zones, level progression (L1/L2/L3), peak formation detection (PFH/PFL), entry signals, and a multi-pair scanner from one chart. Stop scanning charts one pair at a time. The State Engine tracks the BTMM daily cycle automatically — Asian box, room boundaries, level blocks, peak formations, and filtered entries — while the scanner dashboard shows level, peak status, d
The Oracle Pro
Ottaviano De Cicco
5 (1)
The Oracle Pro: Synthetic Multi-Timeframe Bias Engine for MT5 ️ Summer Launch Offer — Get The Oracle Pro for USD 199 (early buyers). Price rises with traction; final price USD 399. The Oracle Pro is a premium multi-timeframe bias engine for MetaTrader 5, built for demanding and professional traders. It answers one question with discipline: what is the directional bias on each timeframe right now, how strong is it, and how much do the timeframes agree? Everything is computed on closed bars only
Spike Fakeout Detector
Brighton Mufaro Mudzingwa
PainX 400 FAKEOUT DETECTOR MT5 Custom Indicator  ·  Sell-Side Bias  ·  Scalping  ·  RSI(6) Filtered   OVERVIEW   The Spike Fakeout Detector is a non repaint precision technical indicator built exclusively for Crash / PainX synthetic indices on the platform. It is engineered around one of the most consistent and exploitable patterns on this instrument — the false breakout above resistance followed by a sharp price drop. Crash/PainX is a growing index that produces a significant price drop app
Mahra Pro Indicator MT5
Mahra Said Mohammed Al Kaabi
Mahra Pro Indicator MT5 Overview Mahra Pro is a MetaTrader 5 chart indicator designed to support structured analysis of XAUUSD (Gold). It combines trend, momentum, volatility and price-structure conditions to identify potential buy and sell setups and display them directly on the chart. The indicator does not open, modify or close trades. All trading decisions and order execution remain under the user's control. Main features • Buy and sell signal arrows on the chart. • Fast and slow EMA lines w


Azimuth Pro
Ottaviano De Cicco
5 (7)
Azimuth Pro V2: Synthetic Fractal Structure and Confirmed Entries for MT5 Overview Azimuth Pro is a multi-level swing structure indicator by Merkava Labs . Four nested swing layers, swing-anchored VWAP, ABC pattern detection, three-timeframe structural filtering, and closed-bar confirmed entries — one chart, one workflow from micro-swings to macro-cycles. This is not a blind signal product. It is a structure-first workflow for traders who care about location, context, and timing. ️ Summer Sale
UZFX {SSS} Scalping Smart Signals v5.0 MT5, hızlı hareket eden piyasalarda doğru ve gerçek zamanlı sinyaller bekleyen scalperlar, günlük işlemciler ve swing işlemciler için tasarlanmış, yeniden çizilmeyen yüksek performanslı bir işlem göstergesidir. (UZFX-LABS) tarafından geliştirilen bu gösterge, fiyat hareketi analizi, trend teyidi ve akıllı filtrelemeyi bir araya getirerek tüm döviz çiftleri ve zaman dilimlerinde yüksek olasılıklı alım ve satım sinyalleri, Uyarı Sinyalleri ve Trend Devam Fırs
By the time you've clicked through forty charts looking for a first red day at a monthly high, the setup you wanted has already closed. Market Maker Reversal Scanner reads your Market Watch, finds a fixed set of reversal and exhaustion patterns, scores each one on a transparent 10-point scale, and puts the results in a single sortable panel on one chart. You stop hunting. You start choosing. New in v12.1: a DAYS / SESSIONS switch. Sessions mode runs the same scanner on closed H4 candles and tags

Meravith Scanner
Ivan Stefanov
5 (3)
MERAVITH SCANNER, MetaTrader 5 için profesyonel bir finansal piyasa göstergesidir ve birden fazla analiz aracını tek bir entegre sistemde birleştirir. Tüm hesaplamaları, özel hacim ağırlıklı ortalama fiyat (VWAP) metodolojisini kullanarak otomatik olarak gerçekleştirir ve subjektif yorumları tamamen ortadan kaldırır. Bu gösterge, tüm varlık sınıflarında (Forex, Hisseler, Endeksler, Emtialar, Kripto Paralar) ve M1’den Aylık’a kadar tüm zaman dilimlerinde çalışır. Temel prensip, fiyatın hacmi taki
Meravith MT5
Ivan Stefanov
5 (3)
MERAVITH, MetaTrader 5 için çok zaman dilimli bir hacim ve likidite göstergesidir; her zaman diliminde trendi, destek ve direnç bölgelerini, girişi, hedefleri ve stop loss seviyesini gösterir. Size piyasanın tam bir likidite haritasını, hedge fon tarzı bir likidite aracını verir ve tüm hesaplamaları kendine özgü bir hacim ağırlıklı ortalama fiyat yöntemiyle otomatik yapar, bu yüzden öznel yorum yoktur. Forex, altın (XAUUSD), endeksler ve kriptoda, her zaman diliminde çalışır. Satın alma sonrası
Volatility Master for MetaTrader is a real-time dashboard tool that scans up to  50 symbols  to identify high-volatility , trending markets instantly. With bullish/bearish signals, customizable alerts, and a user-friendly interface, it helps you avoid range-bound conditions and focus on high-probability trades. Clarity leads to confidence. Trade confidently and protect your capital effectively with this powerful dashboard. We don't offer free or bonus indicators in exchange of reviews from you.
This indicator automatically detects internal & swing market structure, Fibonacci Retracement and Fibo Levels. Features Full internal & swing market structure labeling in real-time Fibonacci Retracement Fibonacci Levels After purchasing the indicator, the full source code is provided, and via indicator buffers it can be easily integrated into your Expert Advisors (EAs) for automated trading strategies.
First time on MetaTrader, introducing IQ Star Lines, an original Vedic Astrology Based Intraday Trading Indicator. We don't offer free or bonus indicators in exchange of reviews from you. You won't need any free products with this indicator to make it work. ;) Enjoy! Welcome to the new and updated  IQ Star Lines , the ultimate fusion of ancient planetary cycles and modern quantitative trading, published for the first time on Metatrader. This is an indicator built by the developer, who has spent
Volume Arrow Signal Product Description Volume Arrow Signal is a smart trading indicator designed to help traders identify potential buy and sell opportunities using price action, volume behavior, and directional arrow signals. The indicator places clear arrows directly on the chart, making it easy to spot possible market reversals, trend continuations, and entry opportunities without spending hours analyzing charts manually. Whether you are trading Gold (XAUUSD) , Forex pairs, Indices, or Crypt
Gem SIGNAL
Shengzu Zhong
5 (1)
GEM Signal Pro GEM Signal Pro, MetaTrader 5 için geliştirilmiş bir trend takip göstergesidir ve daha net sinyaller, daha düzenli işlem kurulumları ve daha pratik risk yönetimini doğrudan grafik üzerinde görmek isteyen yatırımcılar için tasarlanmıştır. Sadece basit bir ok göstermek yerine, GEM Signal Pro işlem fikrinin tamamını daha temiz ve daha okunabilir bir şekilde sunmaya yardımcı olur. Koşullar onaylandığında, gösterge giriş fiyatını, stop loss seviyesini ve take profit hedeflerini grafik ü
ORB Seeker MT5
Marcela Goncalves De Oliveira
Ürünün sınırlı sayıda bulunmasını ve kıtlığını korumak için özel fiyat! Sadece 599 dolar! Satın alma işleminden sonra, bonus ORB Seeker EA ve kişisel olarak optimize edilmiş set dosyalarını almak için benimle iletişime geçin. Temiz antrenman seanslarında güvenle mola verin! ORB Seeker MT5, doğruluk, sadelik, esneklik ve net grafik yapısı isteyen yatırımcılar için tasarlanmış profesyonel bir Açılış Aralığı Kırılımı (ORB) göstergesidir. Otomatik olarak herhangi bir enstrüman için piyasa öncesi v
KenKem Master Volume Profiler - Brief Introduction A Display-only volume-profile cockpit for XAUUSD, BTCUSD and other liquid symbols. Draws profile structure, multi-timeframe flow, EMA trend and study-only setup markers. Places no orders. Not a signal service.  It maps where the market has actually traded and reads recent order flow, so you can see structure and lean at a glance.  What it shows: Master and local volume profiles (POC and value-area high/low) - the price shelves that matter. A liv
Presenting one-of-a-kind Gann Indicator for XAUUSD IQ Gold Gann Levels is a non-repainting, precision tool designed exclusively for XAUUSD intraday trading. It uses W.D. Gann’s square root method to plot real-time support and resistance levels, helping traders spot high-probability entries with confidence and clarity. William Delbert Gann (W.D. Gann) was an exceptional market analyst whose trading technique was based on a complex blend of mathematics, geometry, astrology, and ancient calculation
Navigator Equilibrium: tek pencerede piyasa fazı, momentum, zirveler ve uyumsuzluklar Momentum osilatörü, trend filtresi, volatilite göstergesi ve uyumsuzluk (divergence) tarayıcısı arasında gidip gelmeye son. Navigator Equilibrium hepsini renk kodlu tek bir pencerede toplar; böylece momentumun güçlenip güçlenmediğini, kontrolün kimde olduğunu, piyasanın trendde mi yoksa konsolidasyonda mı olduğunu ve fiyatla momentumun nerede ayrıştığını tek bakışta görürsünüz. Piyasayı net okumak isteyen manue
Kısa ve öz Bu gösterge, iki uzmanı – RSI ve MACD'yi – tek bir sistemde birleştirir . İki ayrı grafiğe bakıp tahmin yürütmek yerine, kararı sizin için verir: Her iki gösterge de aynı fikirde olduğunda bir ok çizer (al veya sat). En önemlisi: Oklar yeniden çizilmez . Bir kere belirdi mi, olduğu yerde kalır. Backtest yapabilir ve canlı işlemlerinize güvenebilirsiniz. "Combo" ne anlama geliyor? Normalde bir trader, RSI'ye (hareketin gücü) ve MACD'ye (trend yönü) ayrı ayrı bakar. Burada ikisi takım h
Ace Trend
Mikhail Sergeev
5 (3)
Size trend ticareti dünyasında oyunun kurallarını değiştiren devrim niteliğinde bir gösterge sunuyoruz. Gösterge, performansı yeniden düşünmek ve ticaret deneyiminizi benzeri görülmemiş bir yüksekliğe çıkarmak için tasarlanmıştır. Göstergemiz, onu rakiplerinden ayıran benzersiz bir gelişmiş özellik kombinasyonuna sahiptirize trend ticareti dünyasında oyunun kurallarını değiştiren devrim niteliğinde bir gösterge sunuyoruz. Gösterge, performansı yeniden düşünmek ve ticaret deneyiminizi benzeri gör
Göstergemiz, piyasada ilgi gösterilen bölgeleri vurgular ve ardından emir birikim bölgelerini gösterir. Büyük ölçekli bir emir defteri (order book) gibi çalışır. Bu, büyük sermaye için geliştirilmiş bir göstergedir. Performansı olağanüstüdür. Piyasada ne tür bir ilgi olursa olsun, onu görürsünüz . (Bu, tamamen yeniden yazılmış ve otomatikleştirilmiş bir versiyondur – artık manuel analiz gerekmez.) İşlem Hızı (Transaction Speed) , piyasada büyük emirlerin nerede ve ne zaman biriktiğini gösteren v
KURAMA GOLD SIGNAL PRO (MT5) — 7 Katmanlı Filtre, Otomatik TP/SL, Kalite Puanı ve Sinyal Geçmişi Kaydı | Eksiksiz XAUUSD Ticaret Sistemi Gerçek zamanlı olarak yeniden çizmez. Bir sinyal belirdiği anda ok, giriş, TP ve SL anında sabitlenir ve sonradan hareket etmez. Sizin işlem yaptığınız şey bu gerçek zamanlı sinyaldir. Ve v7.20'de, gerçekten gönderilen her sinyal otomatik olarak kaydedilir ve yeniden başlatmanın ardından olduğu gibi geri yüklenir. ALICILARA ÖZEL HEDİYE
The Louis SMC & Liquidity Master is a complete, institutional-grade market structure and liquidity mapping system built for MetaTrader 5. Designed for serious Smart Money Concepts (SMC) traders, this tool dynamically tracks multi-timeframe trends, supply and demand zones, and critical liquidity sweeps without cluttering your chart. Whether you trade major Forex currency pairs or highly volatile synthetic indices like Boom and Crash, the indicator automatically adapts to price action, filtering
TrendMaestro5
Stefano Frisetti
note: this indicator is for METATRADER4, if you want the version for METATRADER5 this is the link:  https://www.mql5.com/it/market/product/108106 TRENDMAESTRO ver 2.5 TRENDMAESTRO recognizes a new TREND from the start, he never makes mistakes. The certainty of identifying a new TREND is priceless. DESCRIPTION TRENDMAESTRO identifies a new TREND in the bud, this indicator examines the volatility, volumes and momentum to identify the moment in which there is an explosion of one or more of these da
Piyasanın Gerçekte Ne Yaptığını Görün.   3 piyasa evresini gözünüzün önünde canlı izleyin (Sıkışma, Genişleme, Trend) ve Trend evresinin erken aşamasında daha iyi   girişler yapın.      Tahmin etmeyi bırakın. Piyasayı kurumların ve akıllı paranın okuduğu gibi okumaya başlayın.   MT5 için Apex Market Structure Pro, gürültüyü ayıklayan ve her mumun altındaki gerçek yapıyı gösteren hassas bir akıllı para   analiz aracıdır: likidite, yapı değişimleri, birikim bölgeleri ve trend eğilimi — hepsi tek
Title:FX-AIEA Supply and Demand Zone Indicator (MT5) — Technical Overview Version: 2.51 | Platform: MetaTrader 5 Introduction Supply and demand zones are considered a core manifestation of institutional order flow, providing a more direct reflection of buying and selling pressure than traditional support/resistance levels. This indicator attempts to automate the identification of high-probability supply and demand zones using an adaptive ZigZag algorithm, reducing the subjectivity and time asso
Yazarın diğer ürünleri
MT5 Kill Zones Indicator is a session-based market structure tool for MetaTrader 5 that highlights major trading sessions and projects key reference levels derived from each zone. It supports Asia, London, New York, and Custom sessions, session high/low pivots, middle pivot levels, pivot extension logic, ten additional custom pivots, and flexible alerts including popup, sound, and email notifications. Kill Zones Concept Explained Kill Zones are predefined trading session windows widely used in
Filtrele:
Değerlendirme yok
Değerlendirmeye yanıt