Level SR Statistical Zone Detector
- Göstergeler
-
Salvatore Colombo
 Trading is not a lottery.
You don't gain by luck and you don't lose by chance. You gain because the probabilities are on your side and you lose because you don't understand that yet. - Sürüm: 1.2
- Güncellendi: 12 Haziran 2026
Short Description
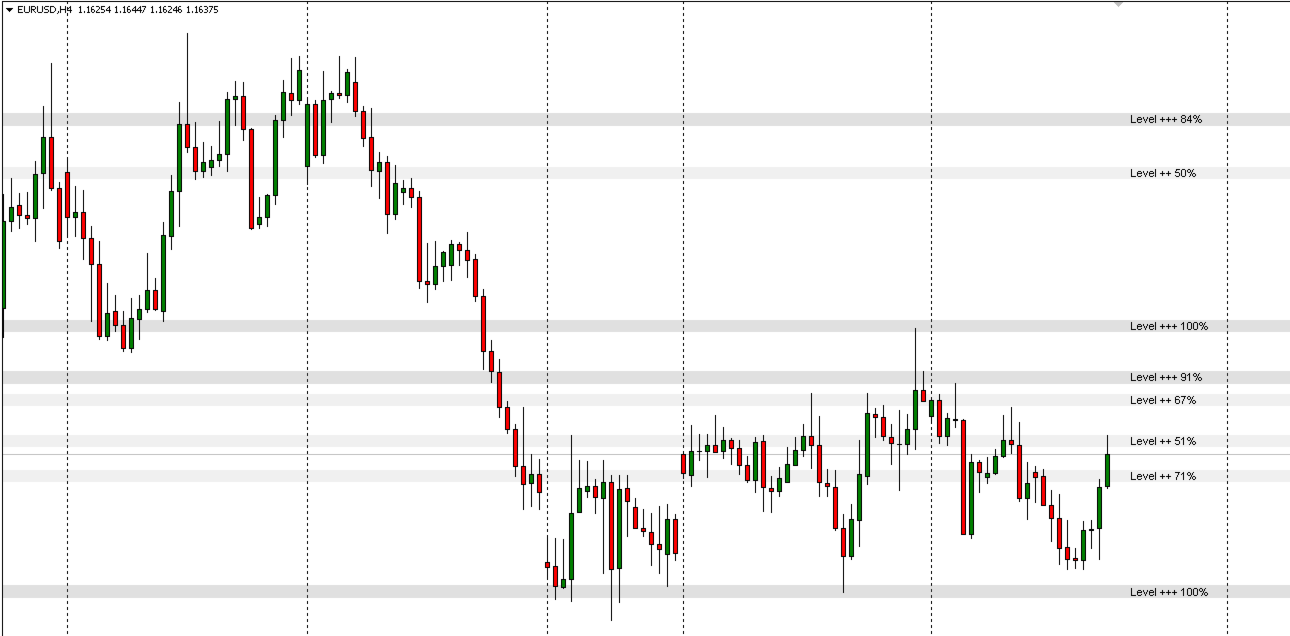
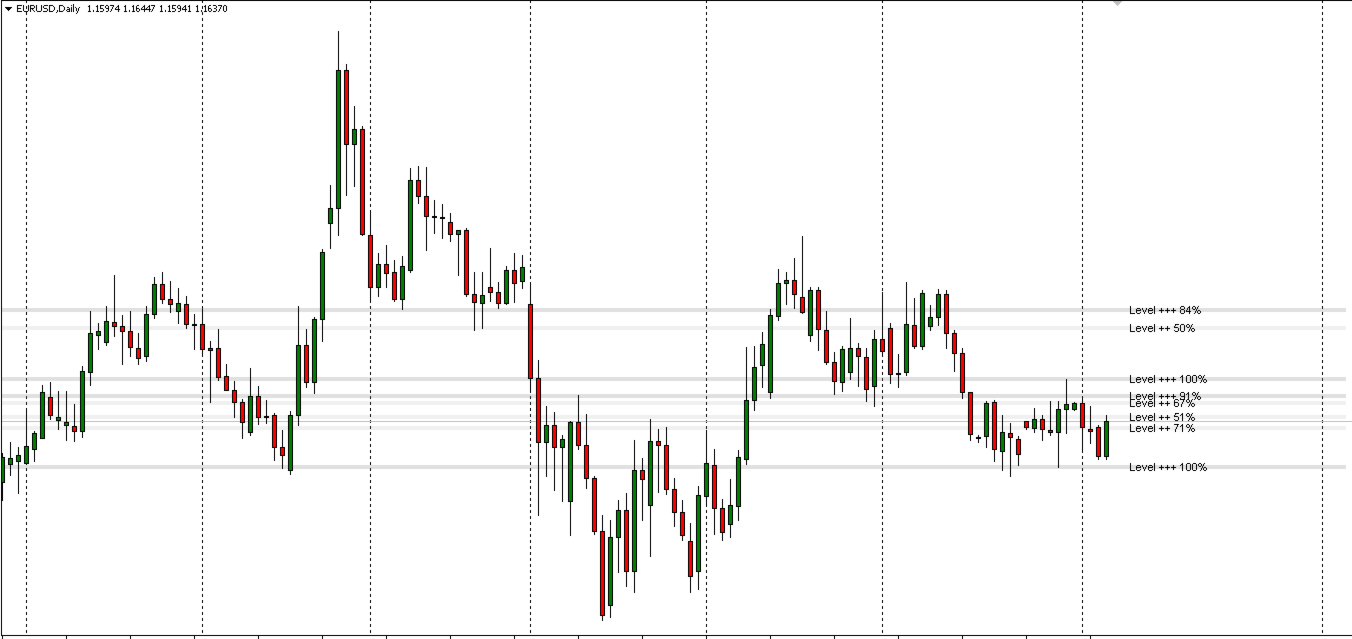
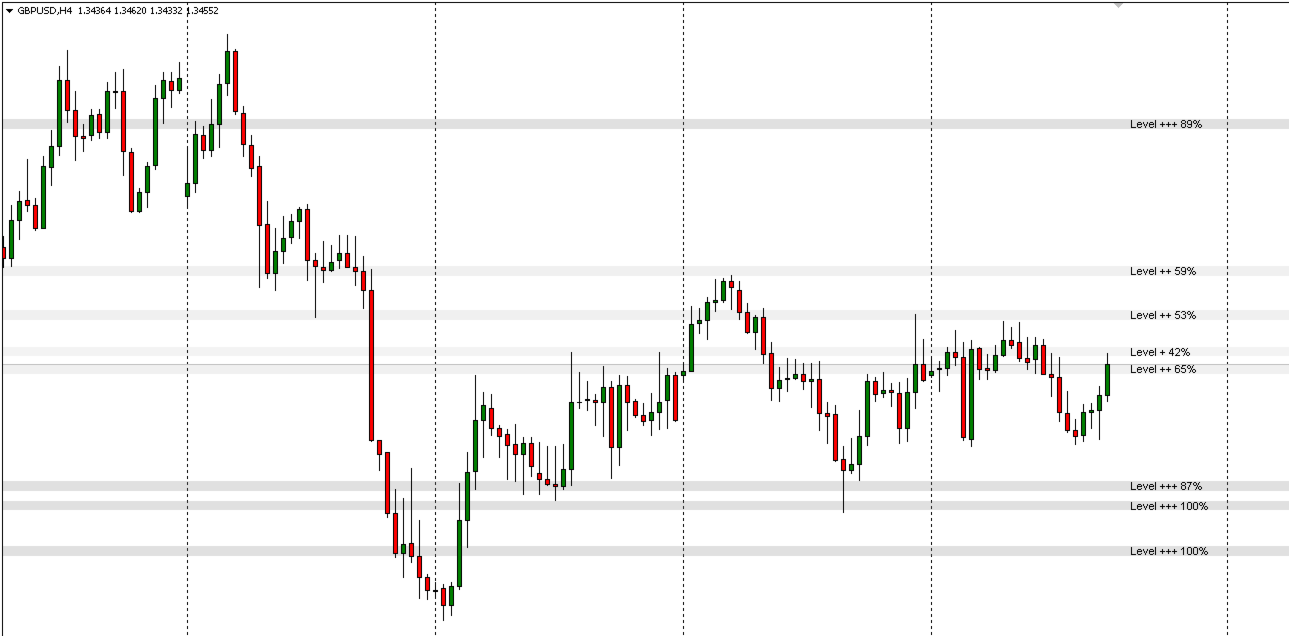
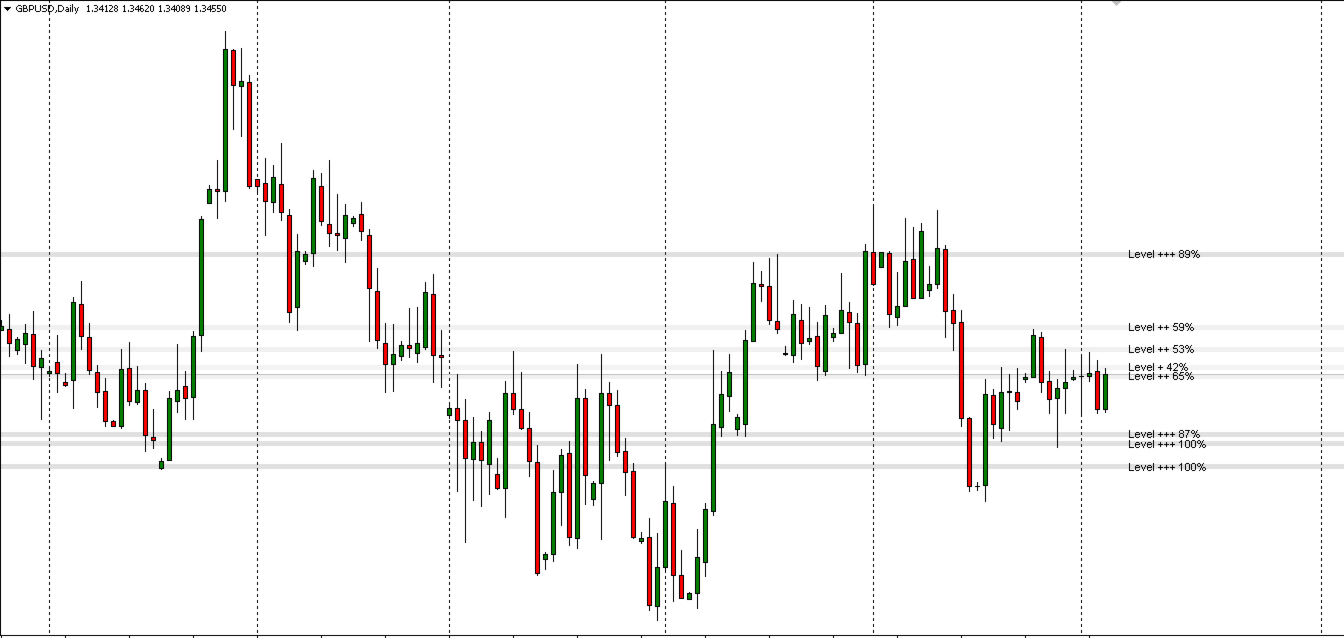
Statistical Support & Resistance zones with probability-based strength ratings. Automatically identifies key price levels where the market has historically reacted.
Historical Level SR
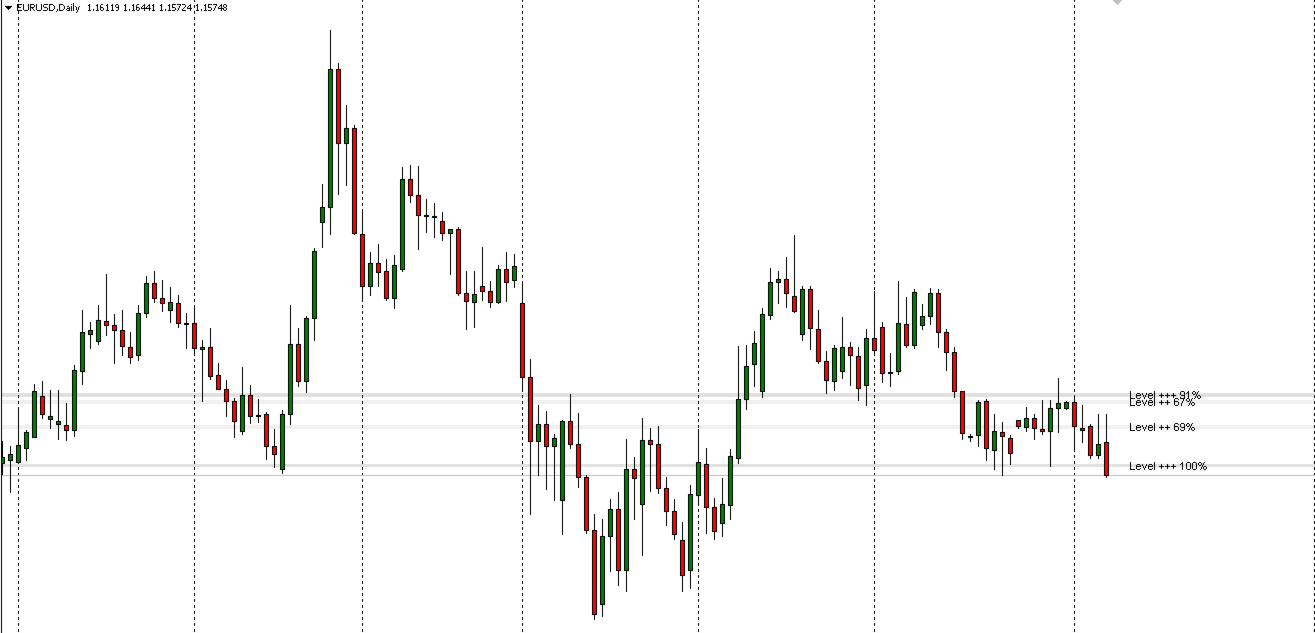
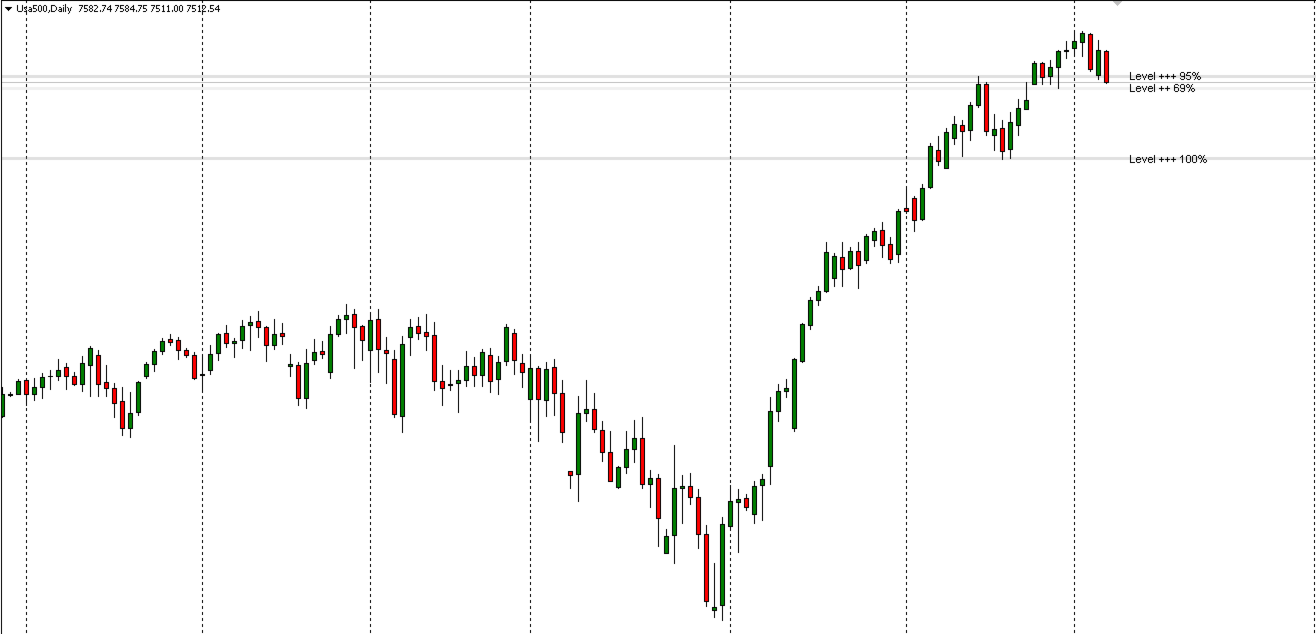
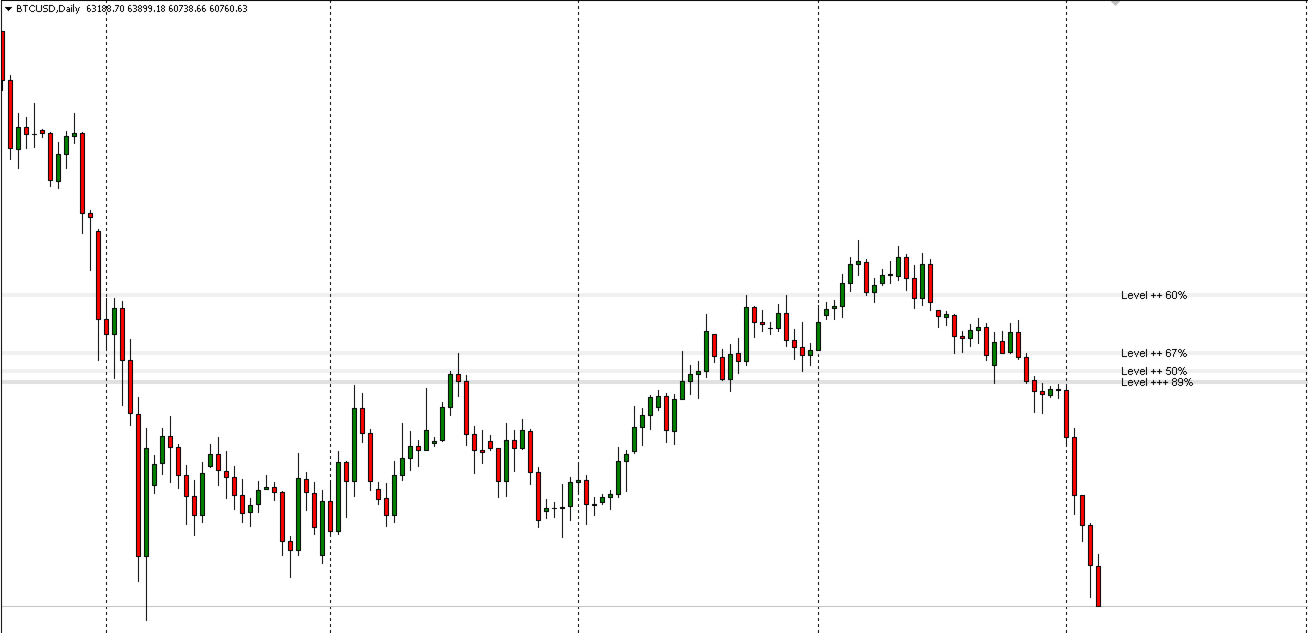
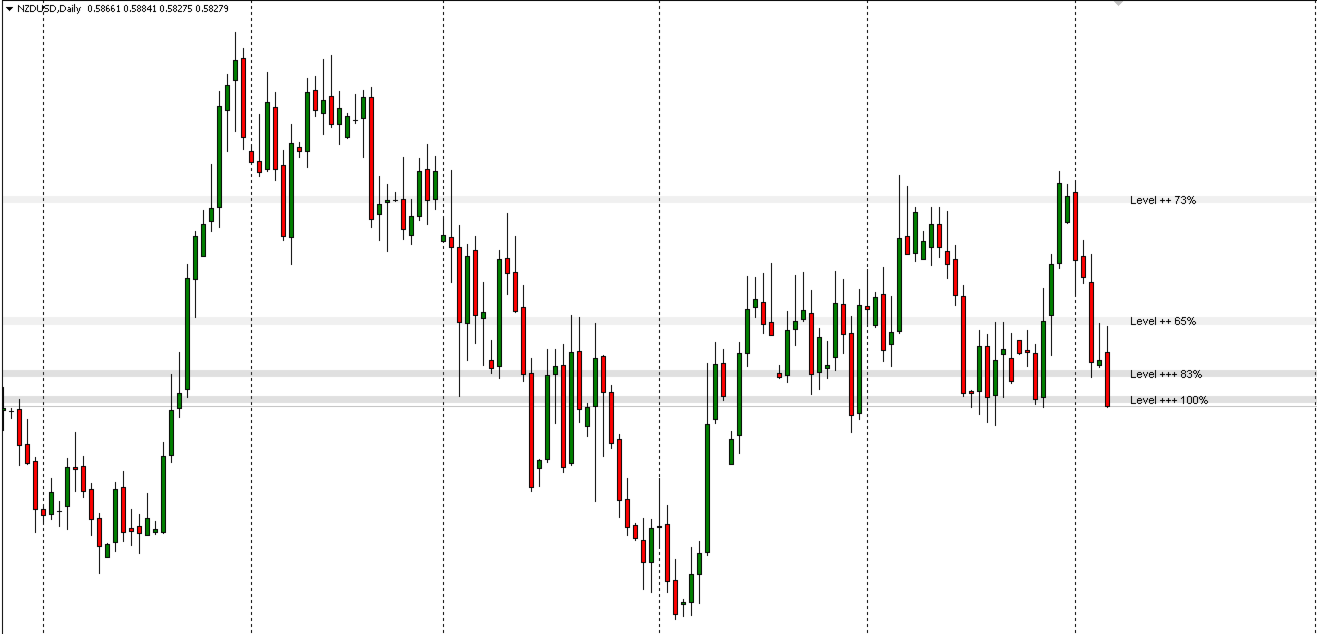
Historical Level SR automatically detects significant Support & Resistance zones using statistical analysis of historical Daily pivots. Instead of relying on subjective chart drawing, the indicator evaluates each zone using real H1 market behavior, measuring how often price interacted with the level and the quality of those reactions.
Each detected zone receives a probability-based strength rating:
+++ High-Probability Zone — strong historical reaction and reliability
++ Medium-Probability Zone — moderate historical reaction
+ Low-Probability Zone — weaker historical reaction
No subjective drawing. No manual analysis. Just statistics.
Features
— Automatic Support & Resistance zone detection from Daily pivots
— Statistical probability rating for every zone
— Based on real historical market reactions
— Works on Forex, Indices, and Cryptocurrencies
— Fully customizable parameters
— On-chart dashboard with active settings
— Non-repainting calculations
Parameters
BarsToAnalyze — number of historical bars to scan (default: 2000)
MaxZones — maximum number of zones displayed on the chart (default: 4)
MinTouches — minimum number of touches required to validate a zone (default: 5)
MinProbability — minimum combined probability required for a zone to be displayed (default: 0.60)
Website
StatsMood — statsmood.com