Multi Subwindow Charts
- Göstergeler
-
Shinya Suzuki
 I have been involved in the markets—including stocks, futures, foreign exchange, and CFDs/FX—for about 25 years.
Having experienced both discretionary trading and fully automated system trading, I believe that building a strategy with clearly defined rules is beneficial for most traders. - Sürüm: 1.1
- Güncellendi: 9 Haziran 2026
- Etkinleştirmeler: 5
Multi Subwindow Charts
One chart. Multiple markets. One scroll.
On standard MT5, comparing two markets means two separate chart windows, two separate scroll positions, and constant switching back and forth. The insight is there. The workflow isn't.
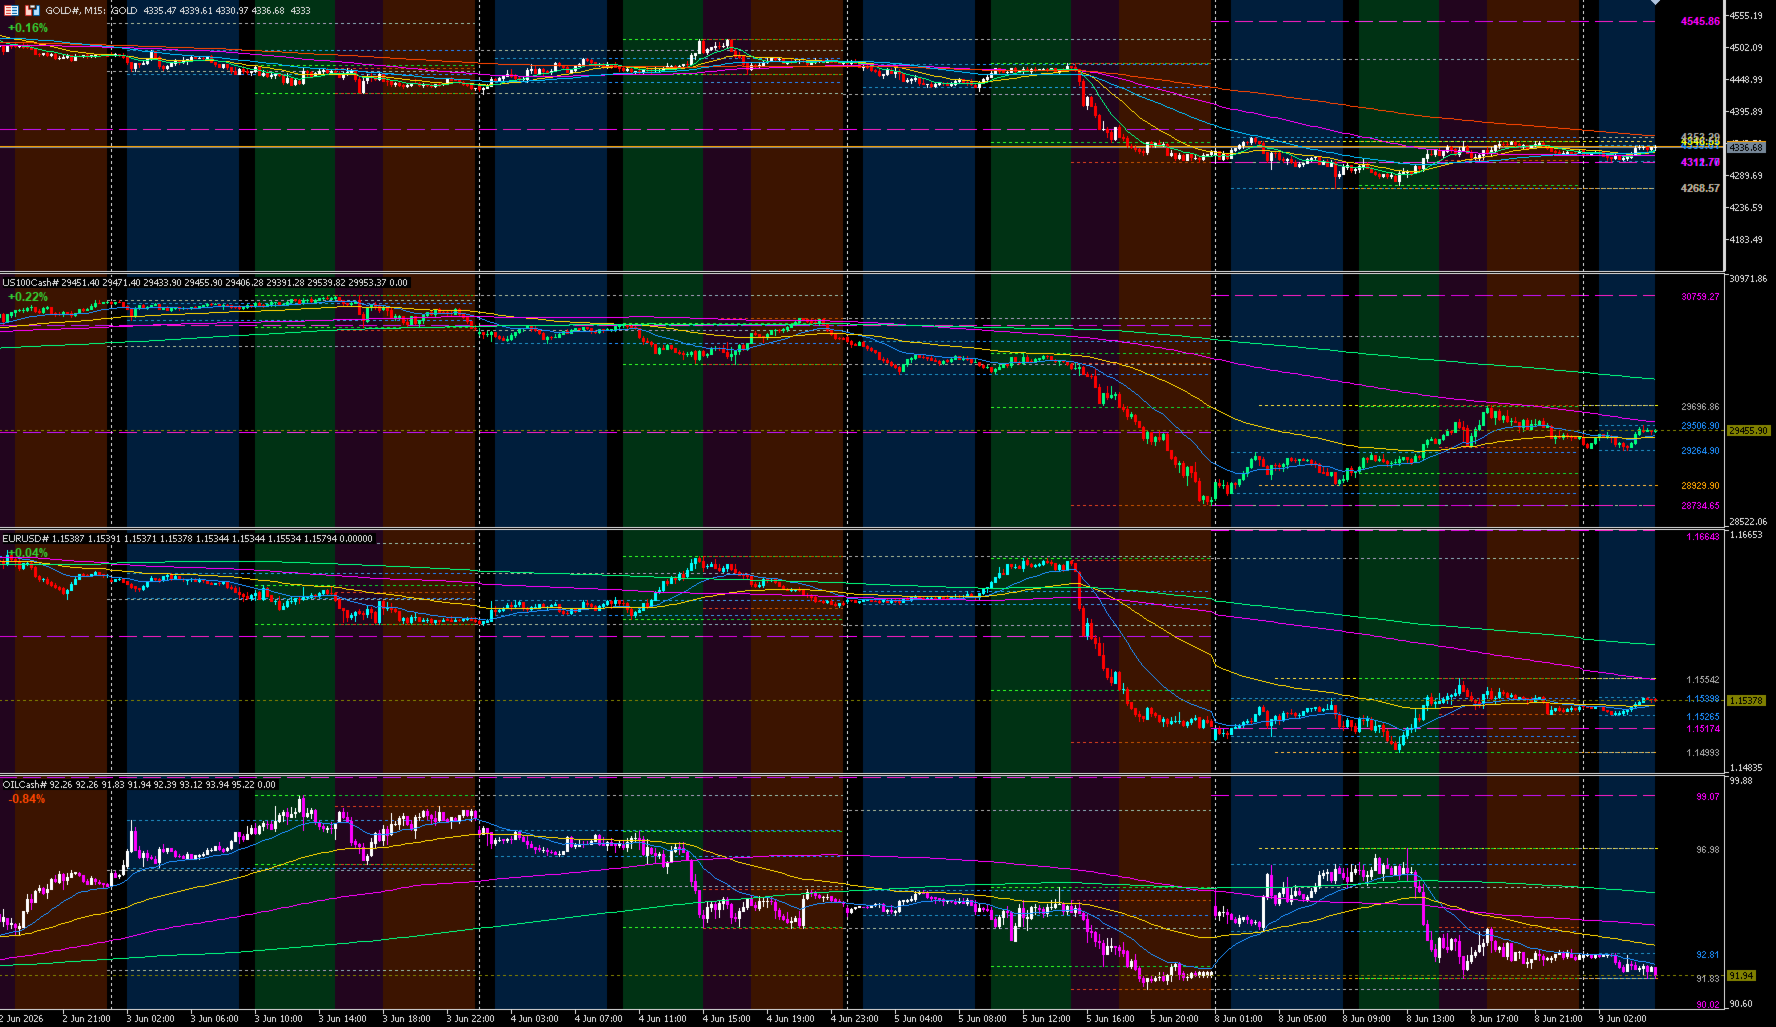
Multi Subwindow Charts renders a fully independent symbol — complete with candles, moving averages, and all key levels — inside a sub-window of your existing chart. Scroll once. Every market follows. No re-centering. No missed correlations.
If you've ever used TradeStation's linked-window layout and missed it on MT5, this is exactly what you have been looking for.
What's Included
Candlestick Chart
- Full OHLC candlestick rendering of any symbol inside a sub-window
- Bull and bear candle colors fully configurable
Moving Averages
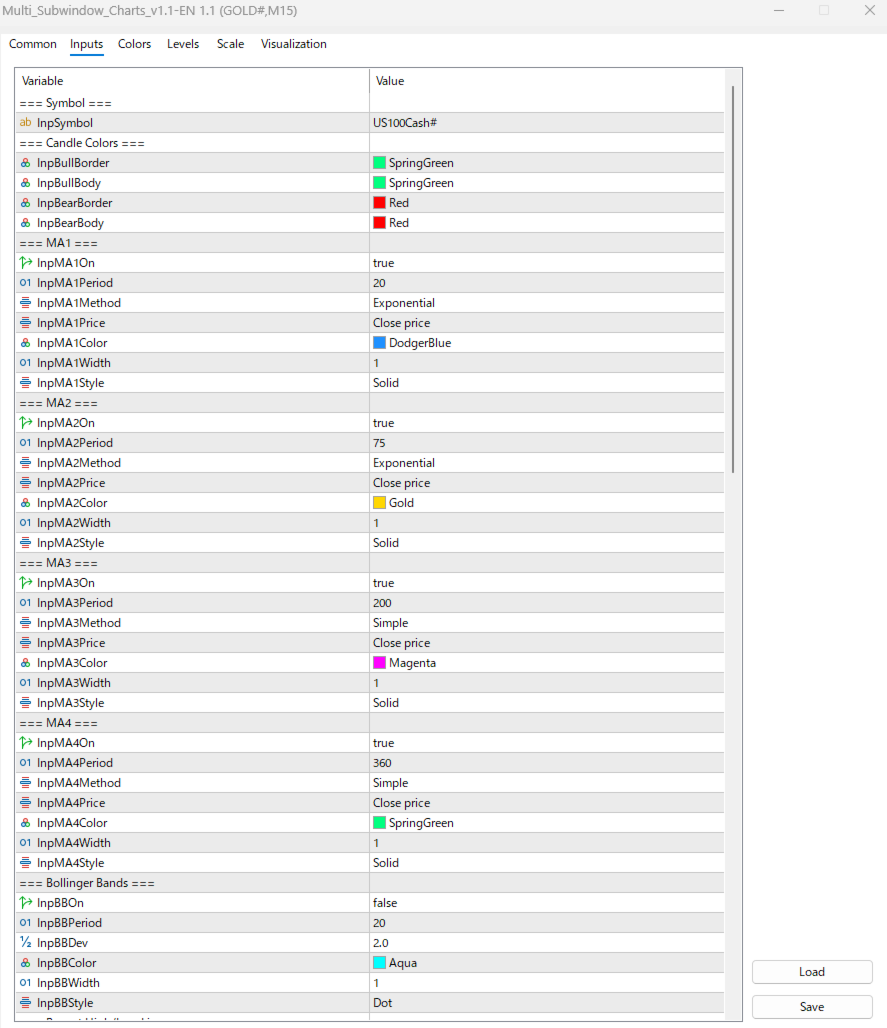
- Up to 4 independent MAs — EMA or SMA, any period, any color and style
- Each MA can be enabled or disabled individually
Bollinger Bands
- Configurable period and standard deviation
- Can be enabled or disabled independently
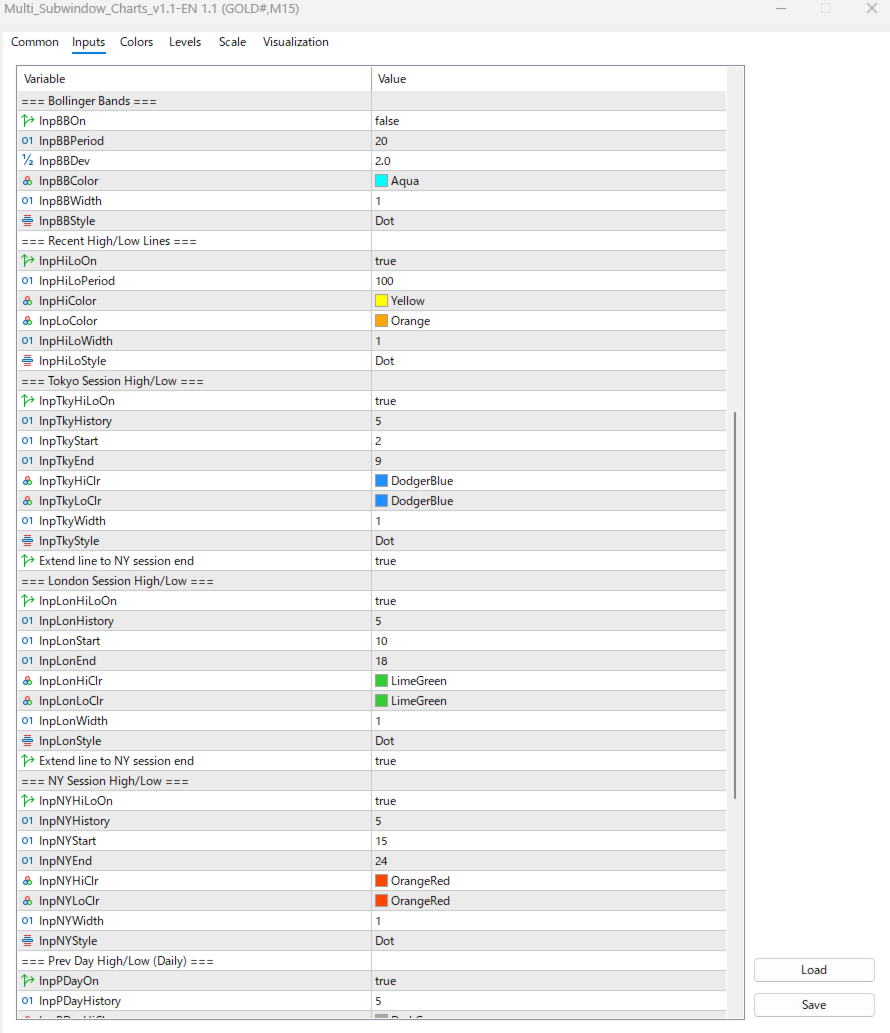
Key Levels
- Session high/low lines for Tokyo, London, and NY — same boundaries as Session Overlay
- Previous day high/low — configurable number of days of history
- Previous week high/low — configurable number of weeks of history
- Recent high/low lines — period-limited segments, exact bar lookback
Live Display
- Live bid line — updates every tick, no flicker
- Return % label — live, color-coded, vs. prior day close
Performance
- Flicker-free rendering — object updates are decoupled from OnCalculate via OnTimer, eliminating the visual instability common in multi-window indicator setups
How to Use
Adding a sub-window Drag Multi Subwindow Charts onto your main chart. When the parameter window opens, enter the symbol you want to display in the InpSymbol field. The sub-window will appear below the main chart, displaying a fully synchronized candlestick chart for that symbol.
Adding more symbols To monitor additional symbols, repeat the same procedure. Each instance of Multi Subwindow Charts creates one additional sub-window. There is no hard limit, but considering available screen height, three sub-windows alongside the main chart is the practical limit for most displays.
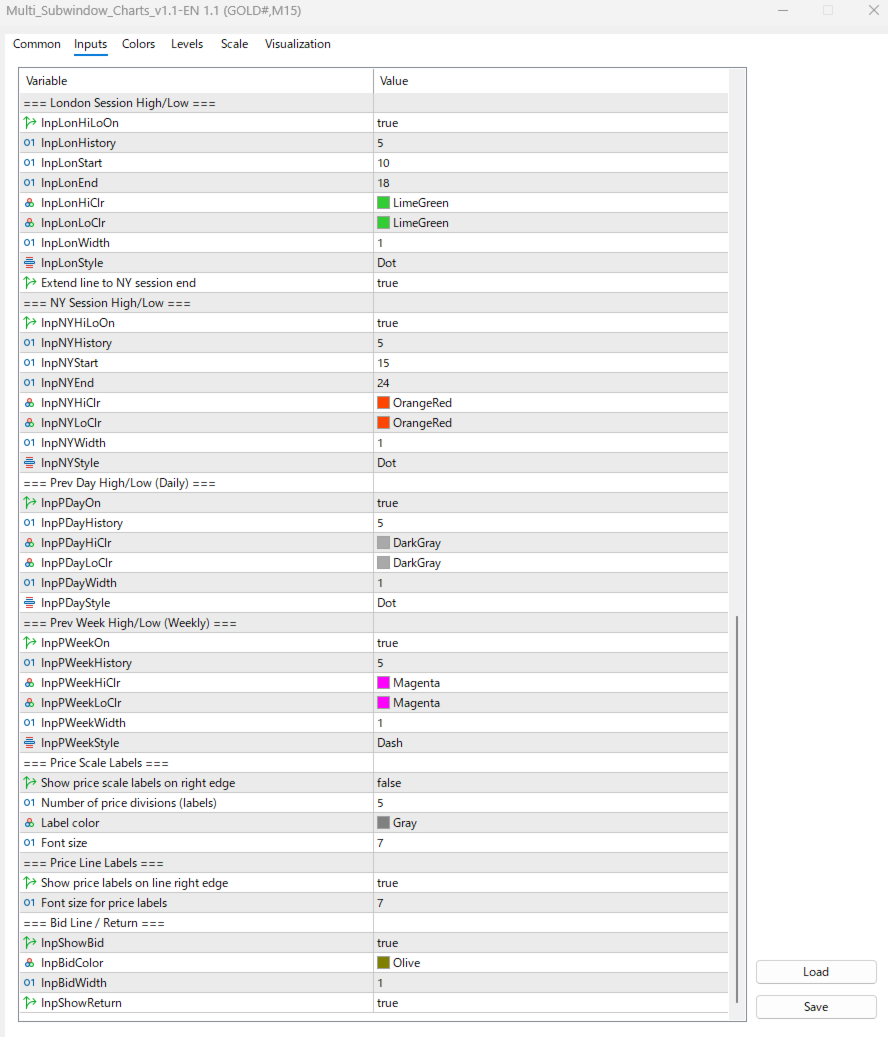
Modifying settings To change the parameters of a sub-window that is already displayed, double-click the candlesticks in that sub-window to open the Parameters window. Alternatively, right-click anywhere on the chart, open the Indicator List, select the Multi Subwindow Charts instance you wish to edit, and adjust the parameters from there.
Getting the Most Out of This Setup
Configure the same MAs and high/low levels across all sub-windows to visually compare how each symbol behaves at key levels at the same point in time.
For example — one symbol may be breaking to a new session high while another is holding below its previous day high. That contrast is difficult to see when charts are in separate windows. Here, it is immediate.
Use these observations to assess the relative strength of each symbol and to identify market conditions where an edge may exist.
Troubleshooting
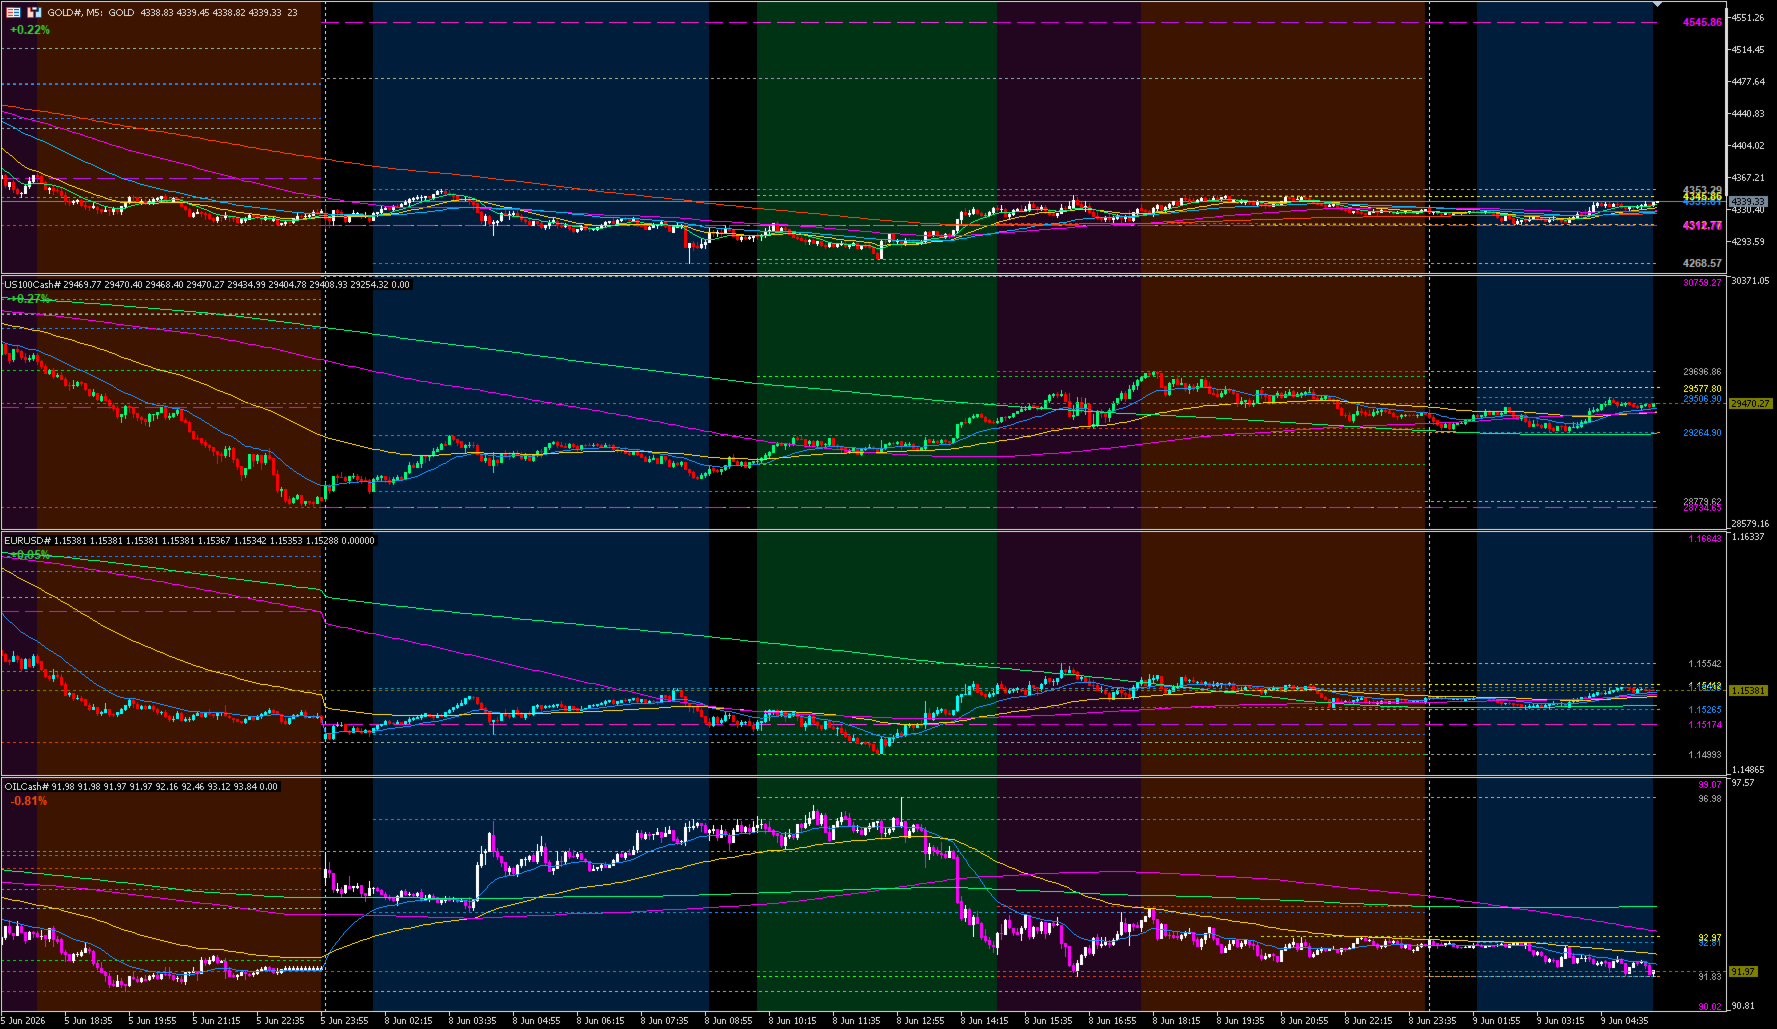
Candlesticks not appearing in the sub-window? This can occur after a holiday or market closure. Switch the chart to a different timeframe and switch back — this refreshes the display and typically resolves the issue. (Example: blank sub-window on 5-minute chart → switch to 15-minute → switch back to 5-minute)
Symbol not displaying correctly? Ensure that the symbol string in InpSymbol exactly matches what your broker shows in the Market Watch. Some brokers append suffixes to symbol names (e.g. US100.cash , JP225m ).
Designed to Work with Session Overlay (Free)
Multi Subwindow Charts is designed to be used alongside the free Session Overlay indicator. When both are active, Session Overlay's session shading automatically extends across every sub-window, giving you a unified session view — same boundaries, same time axis, across every market you follow.
We recommend installing Session Overlay first.
Note
This indicator does not generate buy or sell signals and does not display arrows or alerts. It is a market analysis tool designed to help you see multiple markets clearly, in context, and in sync.