Volatility Channel Indicator X TM5
- Göstergeler
- Sürüm: 1.0
- Etkinleştirmeler: 5

Trend Channel Indicator
Version: 1.01
Overview:
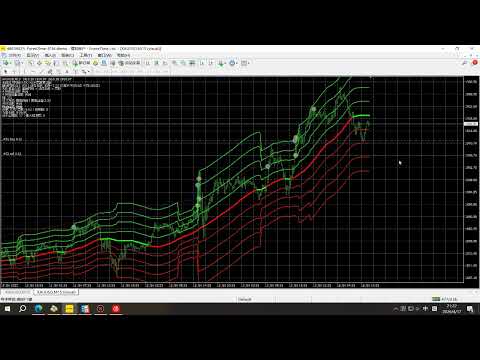
The Trend Channel Indicator is a multi-layered channel system based on a moving average. It dynamically calculates the maximum deviation between price and the MA, generating multiple channel lines to help traders identify trend strength, support/resistance levels, and potential overbought/oversold zones.
Key Features:
-
Base MA: Customizable period moving average (default 260, supports SMA/EMA/etc.) as the trend center
-
Channel Layers: Divides the maximum deviation into 4 equal parts, creating 4 upper and 4 lower channel lines (8 total)
-
Trend Coloring: MA line changes color (green when price is above, red when below) for quick trend direction recognition
-
Multi-level S/R: Channel lines provide multiple support and resistance levels – 1/4, 1/2, 3/4, and full deviation represent different strength zones
Parameters:
| Parameter | Default | Description |
|---|---|---|
| MA Period | 260 | Number of bars for MA calculation |
| MA Shift | 0 | Horizontal shift of MA (in bars) |
| MA Method | SMA | MA type (SMA/EMA/SMMA, etc.) |
| Apply to | CLOSE | Price type for MA calculation |
| Range for High/Low | 260 | Lookback period to calculate max price deviation |
Applications:
-
Trend Following: When price stays on one side of MA, trade along the channel direction
-
Pullback Trading: 1/2 or 3/4 channel lines serve as overbought/oversold reference levels
-
Breakout Confirmation: Breaking the outermost (full deviation) channel often signals trend acceleration or reversal
Recommendations:
-
Default parameters work well for daily chart trend analysis; adjust period and range according to your trading timeframe
-
Best used alongside momentum indicators like RSI or MACD