Pure Path

ST Pure Path Indicator Description for Metatrader ST Pure Path Indicator Description for Metatrader

This document aims to provide a clear and accessible description of the ST Pure Path indicator, developed for the Metatrader platform. It is designed to assist traders, especially those with little experience, in identifying market trends and decision points visually and intuitively.

1. Visual Identification

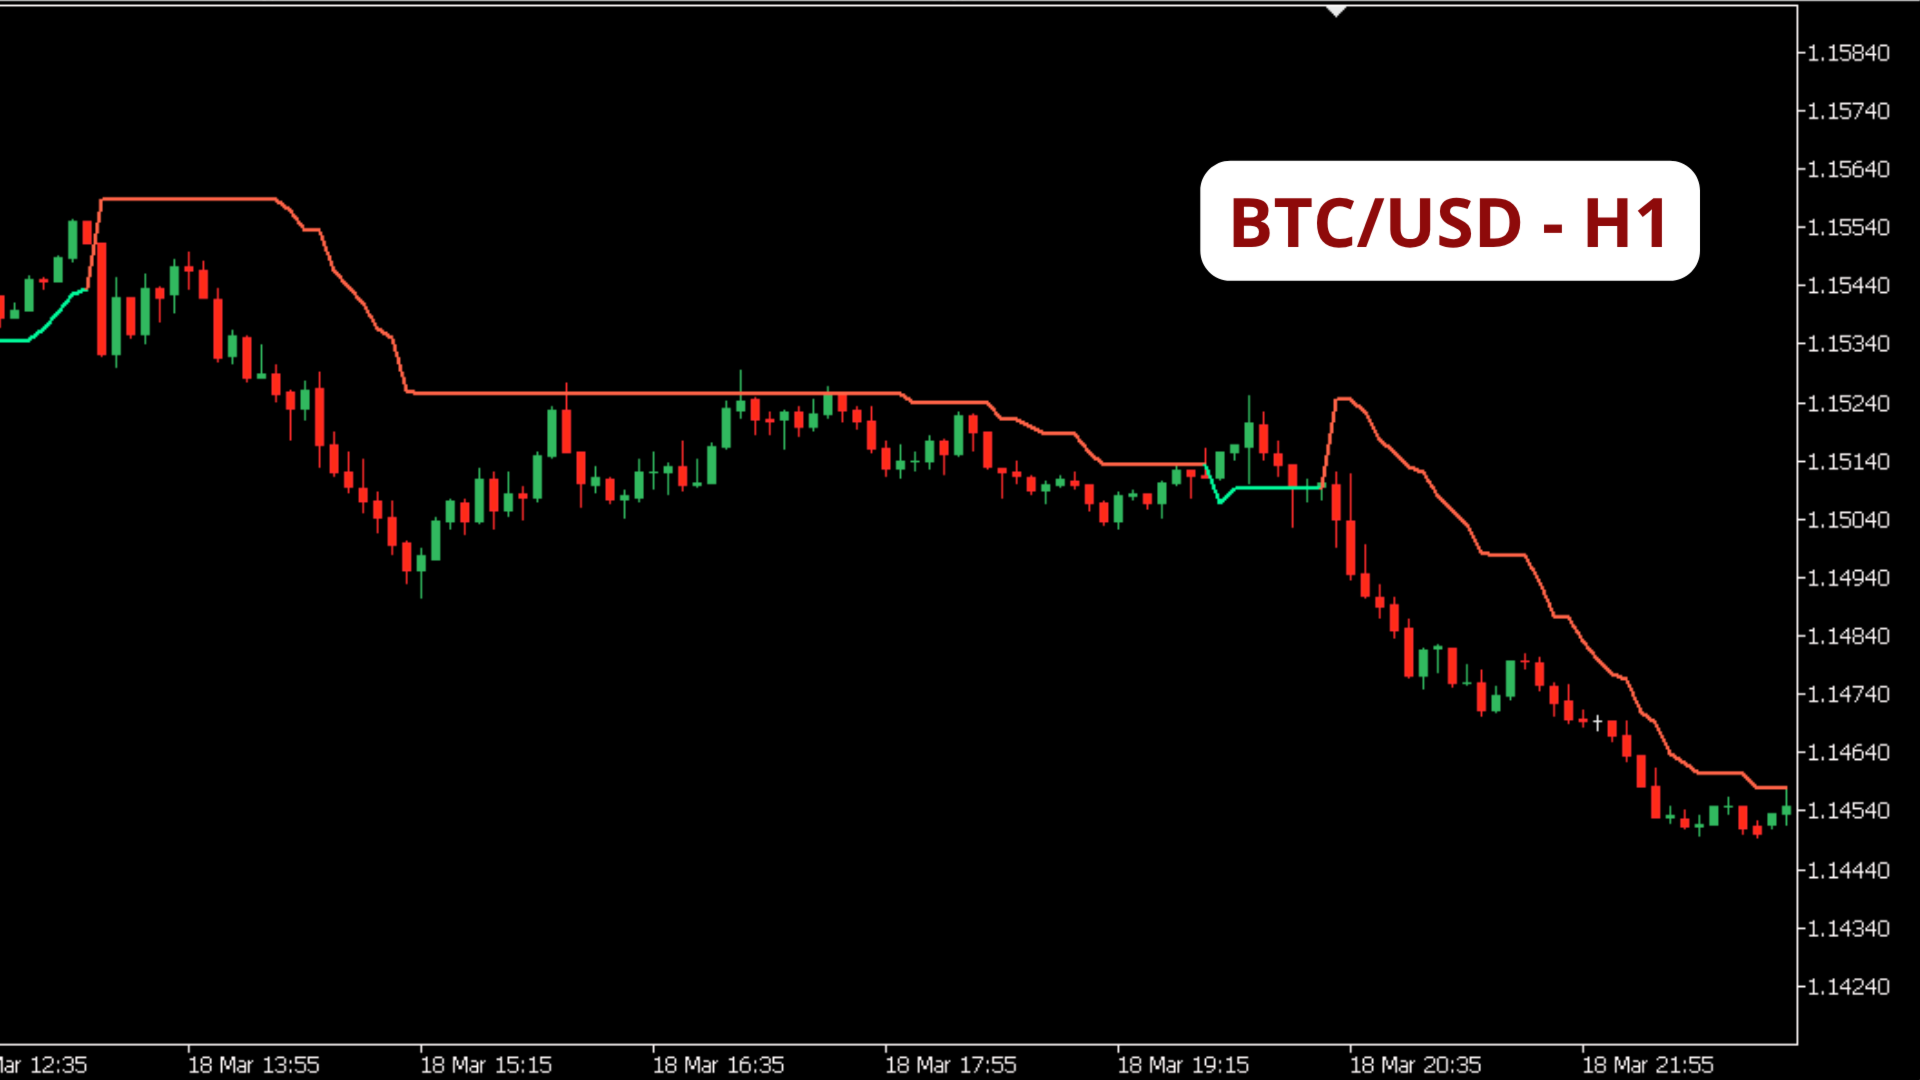
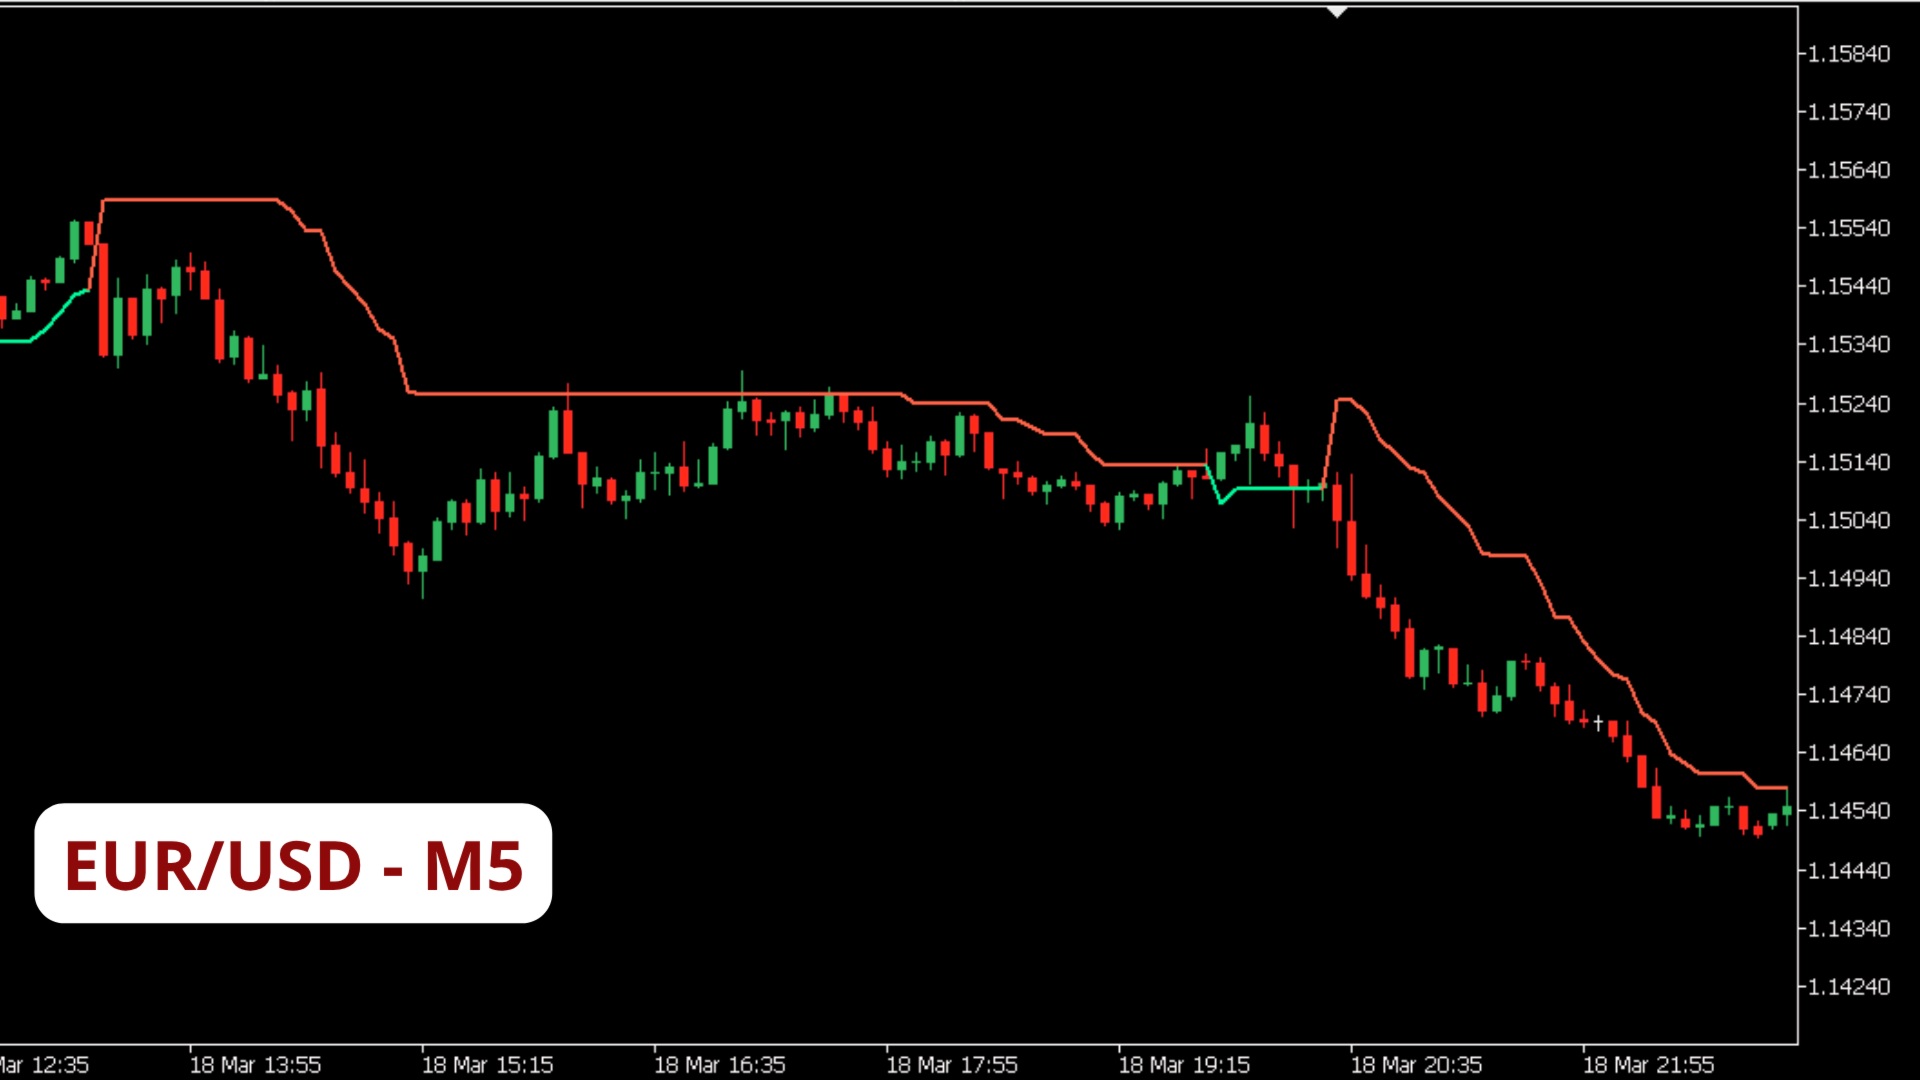
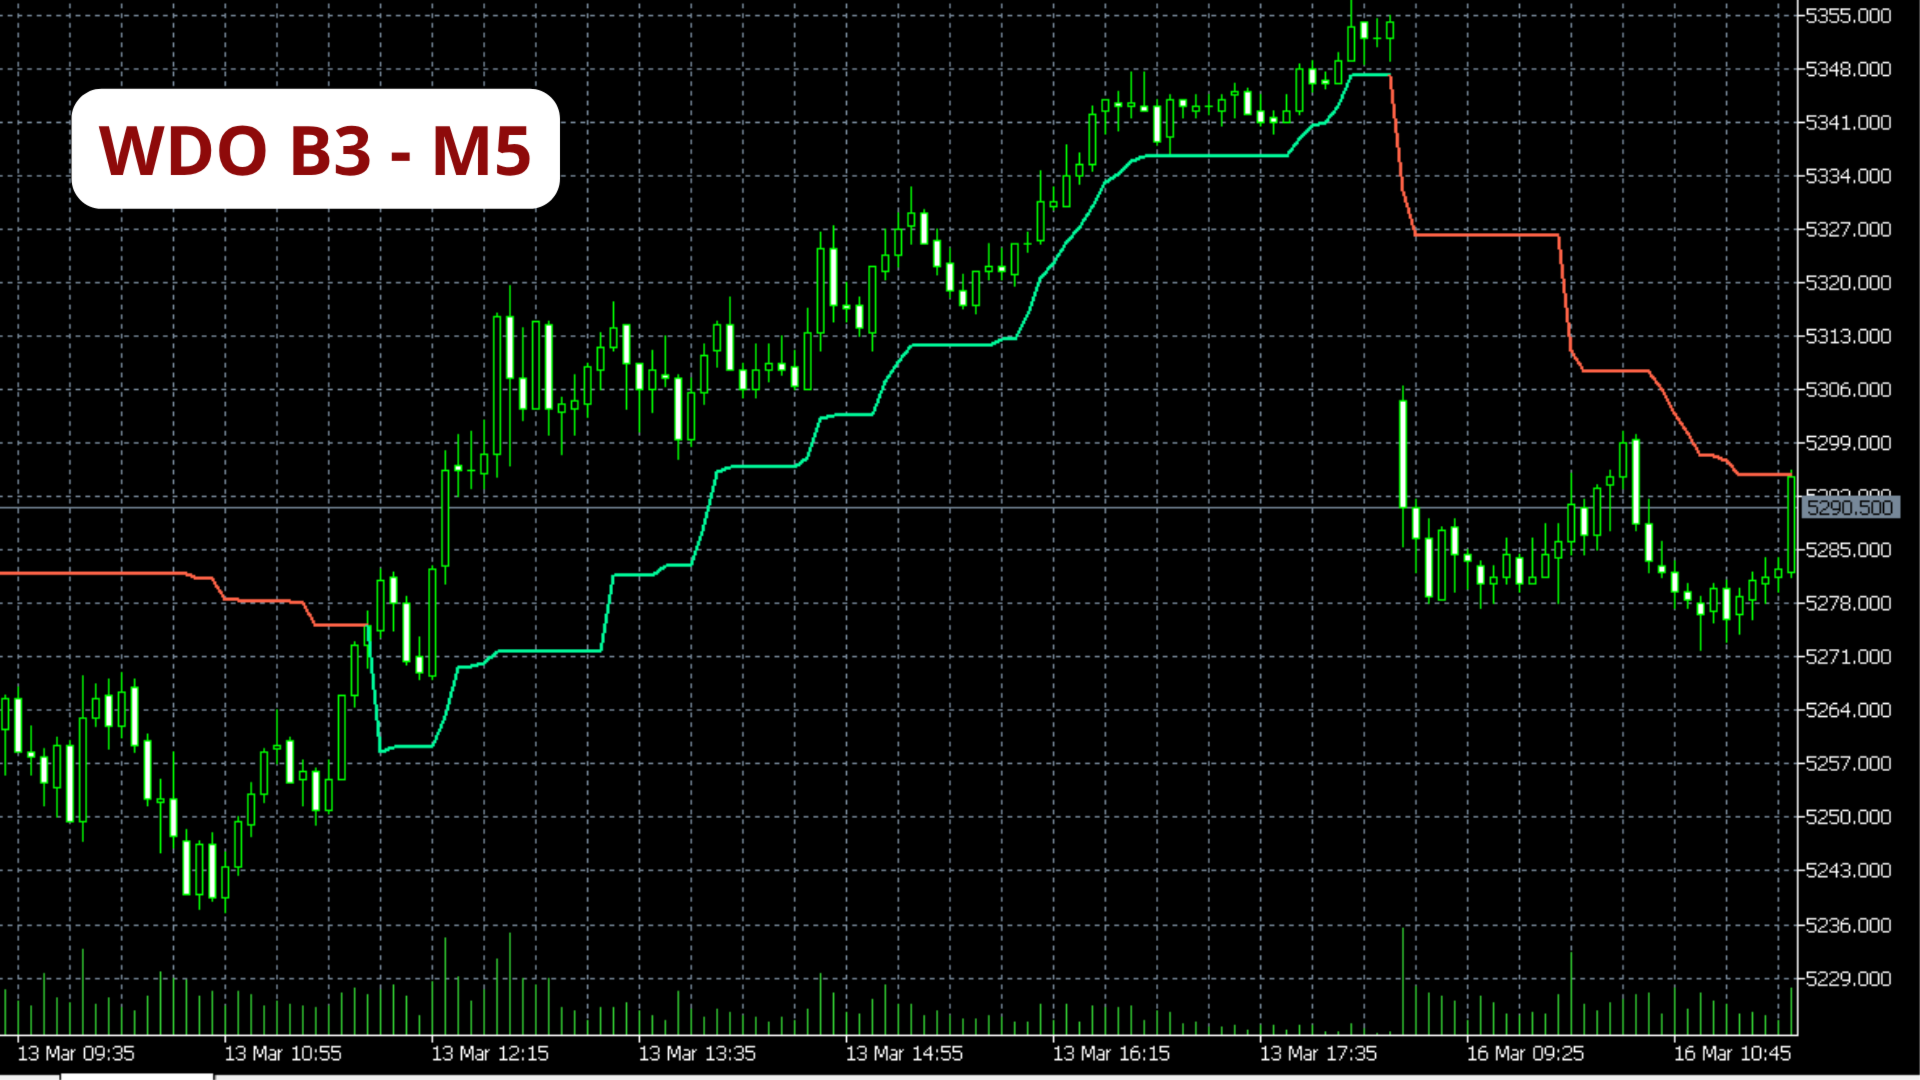
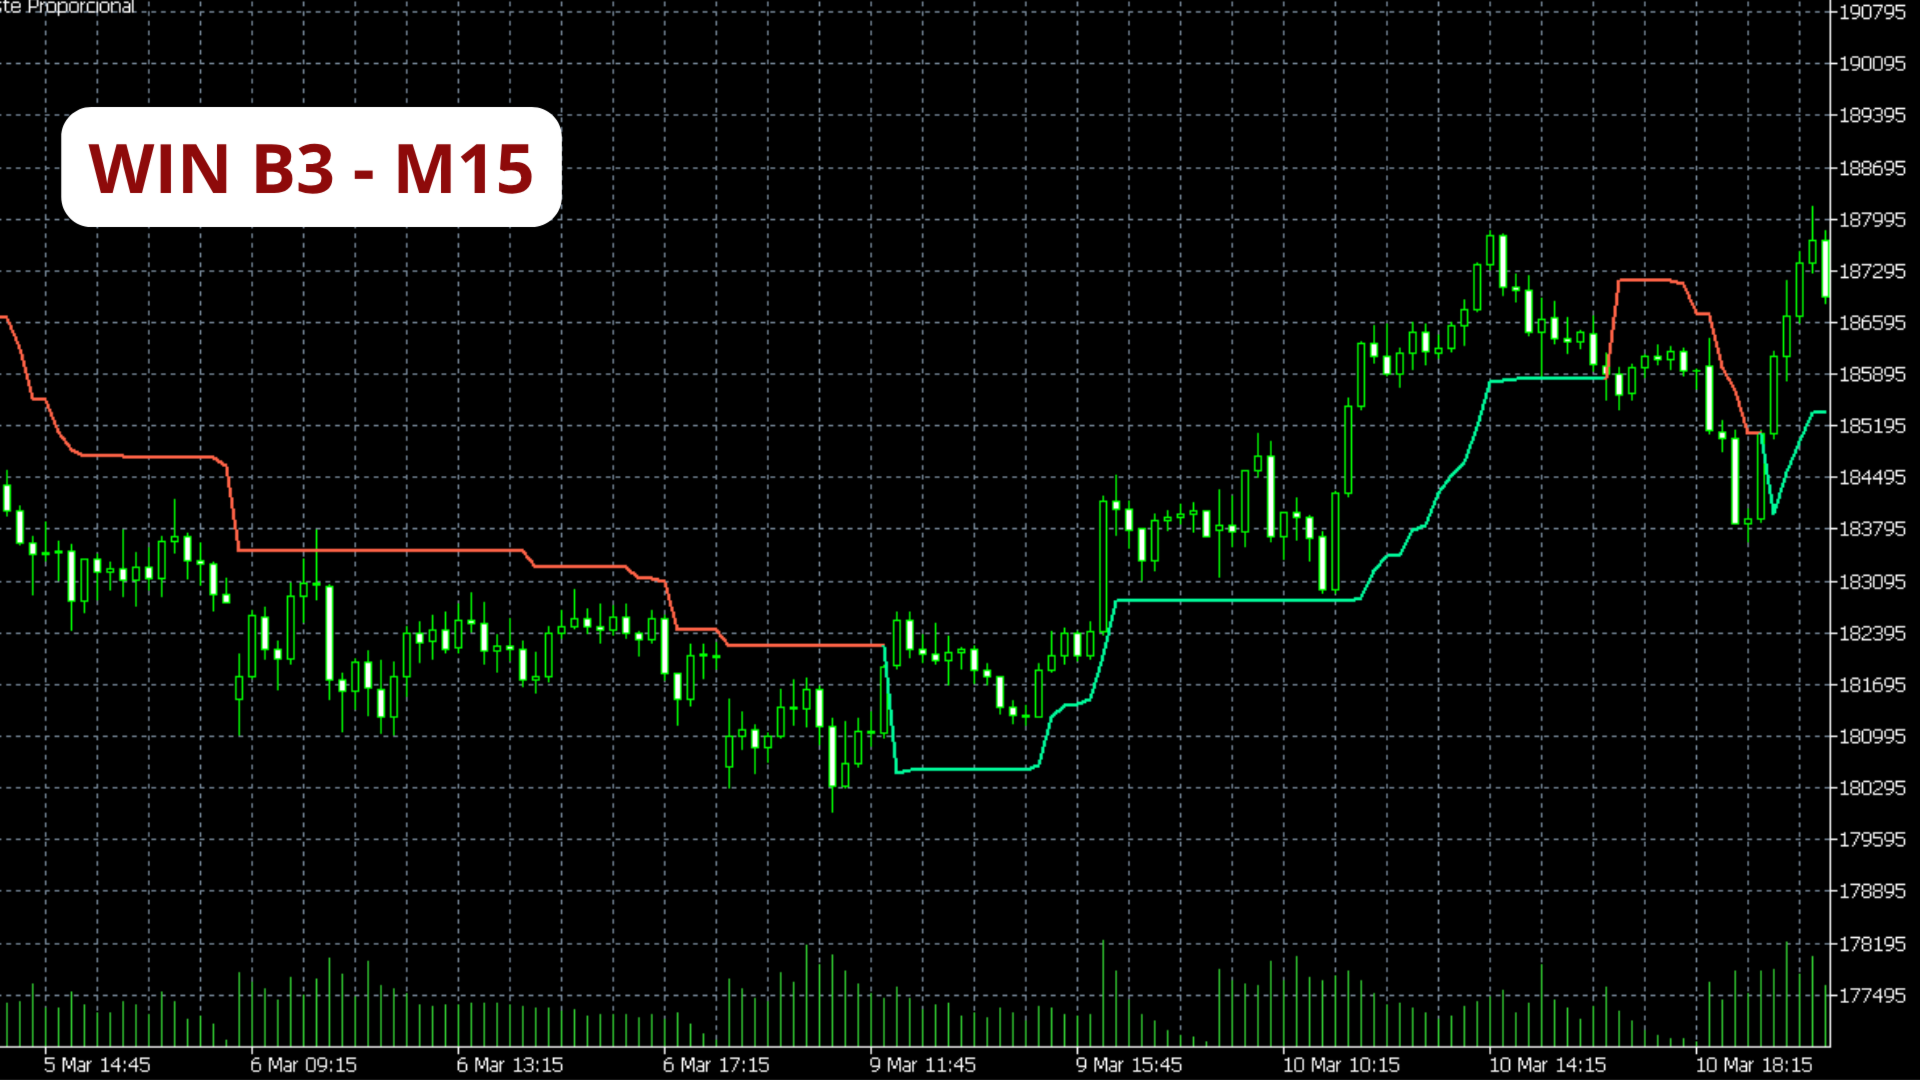
The ST Pure Path appears on the chart as a continuous, solid line, with a thickness of 2 pixels, moving in sync with the price. Its appearance resembles a ladder or steps, smoothly adapting to market movements. A fundamental characteristic is its discretion: the indicator does not clutter the chart with clouds, histograms, or invasive arrows, keeping the background clean for focused visual analysis.

Colors and Their Meanings:

Line Color Main Meaning Hexadecimal Code (MT5 Standard)
Green Bullish Trend #00FA9A (MediumSpringGreen)
Red Bearish Trend #FF6347 (Tomato)

2. Color and Position Semantics

The color and position of the ST Pure Path line relative to the candlesticks (price bars) are crucial for its interpretation:

  • Green Line (Bullish Trend): When the line is green, it indicates that the market is in an uptrend. The line is positioned below the candlesticks, acting as dynamic institutional support. This means that if the price falls and touches this line, there is a good probability of finding buyers and resuming the upward movement.
  • Red Line (Bearish Trend): When the line is red, it signals a downtrend. In this scenario, the line is located above the candlesticks, functioning as dynamic institutional resistance. If the price rises and touches this line, it is likely to encounter sellers and fall back down.

Distance between Price and Line:

The distance between the current price and the indicator line reflects market volatility, adjusted by an Adaptive ATR. This distance offers important insights:

  • Excessive Deviation: If the price moves too far from the line (whether green or red), it may indicate trend exhaustion. This suggests that the current movement may be losing strength, and a correction or reversal may be imminent.
  • Touch on the Line: A candlestick touching the indicator line (green or red) is a structure test. In the case of the green line, it's a support test; for the red line, it's a resistance test. These touches are points of interest for potential entries or exits.

3. Numerical Data on the Chart

The ST Pure Path was designed to be visually clean. Therefore, it does not display text, scores, or price labels directly on the chart. To obtain the current price, it is necessary to observe the Y-axis (right vertical) of the MetaTrader 5 platform.

4. Entry and Exit Criteria (Analysis)

Although the indicator provides clear visual signals, the interpretation for buy and sell decisions can be summarized as follows:

  • Buy Signal (Bullish Context):
    • When a candlestick touches the Green line (dynamic support).
    • Immediately after the line changes from Red to Green (chromatic transition).
  • Sell Signal (Bearish Context):
    • When a candlestick touches the Red line (dynamic resistance).
    • Immediately after the line changes from Green to Red (chromatic transition).

Risk Management (Stop Loss):

The Stop Loss should be placed at the exact position of the indicator line at the moment the entry candlestick is formed. This provides a clear and objective reference for capital protection.

Target Projection (Profit):

The ST Pure Path does not offer visual targets for profit. To define profit objectives, it is recommended to use complementary tools, such as Fibonacci levels, drawn from the point where the candlestick touches the indicator line.

Yazarın diğer ürünleri
Fusion Cycles
Jean Carlos Souza
Professional Cycle Analysis with MACD Momentum Sync. Fusion Cycles is a high-performance indicator designed to identify market cycles by merging Stochastic dynamics with MACD momentum filtering. It offers a clear visual map of trend strength through its proprietary dynamic-color line system. Key Features: Momentum Synchronization: The main oscillator line changes color (Lime/Red) based on the MACD Histogram slope, preventing trades against the short-term flow. Strategic DNA Zones: Calibrated at
FREE
Dynamics Edge
Jean Carlos Souza
Dynamics Edge: Statistical Precision in Mean Reversion Dynamics Edge is a volatility boundary indicator designed to identify price exhaustion with high precision. Using an advanced standard deviation calculation ( $2.2 \sigma$ ), it maps the extremities where price is statistically likely to return to equilibrium (median). Key Features: Dynamic Exhaustion Edges: Solid lines that expand and contract based on volatility, identifying overbought (Blue) and oversold (Red) zones. OCR-Ready Price Tags:
FREE
Fibochian Flow
Jean Carlos Souza
Fibochian Flow: Mathematical Precision with 200-Period Trend Filter Fibochian Flow is a professional trading tool that combines dynamic channel volatility with the institutional strength of the 200-period Moving Average. Designed to capture trend ignitions (breakouts), the indicator provides a complete trade setup: Macro Filter, Entry Point, Stop Loss, and three Fibonacci-based Target levels. How Fibochian Flow Works: Trend Filter (Orange Line): Acts as the market's ultimate guide. We only look
FREE
ST Adaptive Flow: Triple Confluence & KAMA Intelligence ST Adaptive Flow is a next-generation indicator designed for traders who demand surgical precision in identifying institutional flow. It is not just a moving average; it is a decision algorithm that combines KAMA (Kaufman Adaptive Moving Average) with momentum filters (RSI) and macro trend (SMA 200). The Core of the Algorithm: Dynamic Adaptive Line: Uses Kaufman’s logic to adjust to market speed. It flattens in sideways markets and slopes a
FREE
Smooth Trend
Jean Carlos Souza
ST Smooth Trend: Silence the Market Noise Trading doesn't have to be a guessing game. Most traders lose money because they react to every small price wiggle. ST Smooth Trend was built to give you a crystal-clear view of the market by filtering out the chaos. Key Benefits for Your Trading: Intuitive Color System: No more confusion. Green means trend up, Red means trend down, and Gray tells you the market is flat—protecting your capital when there’s no clear direction. Visual Safety Zones: The dot
FREE
What is Cipher PRO? It is not a mere "signal" tool. It is a market decoder that identifies Price DNA (strength and volatility). It provides "The North" (context), helping you understand where the price is and where it is likely to head. Visual Identification: Cyan Square: Buy signal. Indicates price DNA has shifted bullish with real momentum. Pink/Magenta Square: Sell signal. Indicates price DNA has shifted bearish with real momentum. Dotted Blue Lines: Your North . The top one is Resistance (ce
FREE
ST Flow Context: The Professional Trader’s Compass ST Flow Context is a macro analysis tool developed to identify the predominant direction of institutional money. It filters out intraday noise and delivers the real market context, helping the trader never to trade against the main tide. Key Features: Trend Alignment: Identifies whether the daily flow is bullish or bearish based on multiple timeframes. Interest Zones: Maps where institutional volume is defending positions. Entry Filter: Use Flow
FREE
Heat MA
Jean Carlos Souza
Heat MA Description - English Heat MA Indicator: A Simplified Guide for Traders The Heat MA indicator is a powerful visual tool designed to identify the intensity of trading flow and market pressure directly on your chart. It appears as a continuous line that changes color, offering clear signals about price behavior and underlying volume. 1. How Heat MA Appears on the Chart Imagine a single, robust line (4 pixels thick) that moves along with the price. This line is not just a trace; it's a mark
FREE
ST Multi Regression Indicator Guide for Beginners Simplified Guide: ST Multi Regression Indicator for Beginners What is it? It's a visual tool that helps identify good times to buy or sell in the financial market, based on colors and signals that appear on the chart. How does it work? Main Elements: Main Line (Oscillator) Blue (Aqua): Good time to buy Orange: Good time to sell Dotted Line (Silver) Serves as reference for signals Arrows ️ Blue: Buy signal ️ Orange: Sell signal When to Trade?
FREE
Filtrele:
Değerlendirme yok
Değerlendirmeye yanıt