Setup Trade Cipher PRO

What is Cipher PRO? It is not a mere "signal" tool. It is a market decoder that identifies Price DNA (strength and volatility). It provides "The North" (context), helping you understand where the price is and where it is likely to head.

Visual Identification:

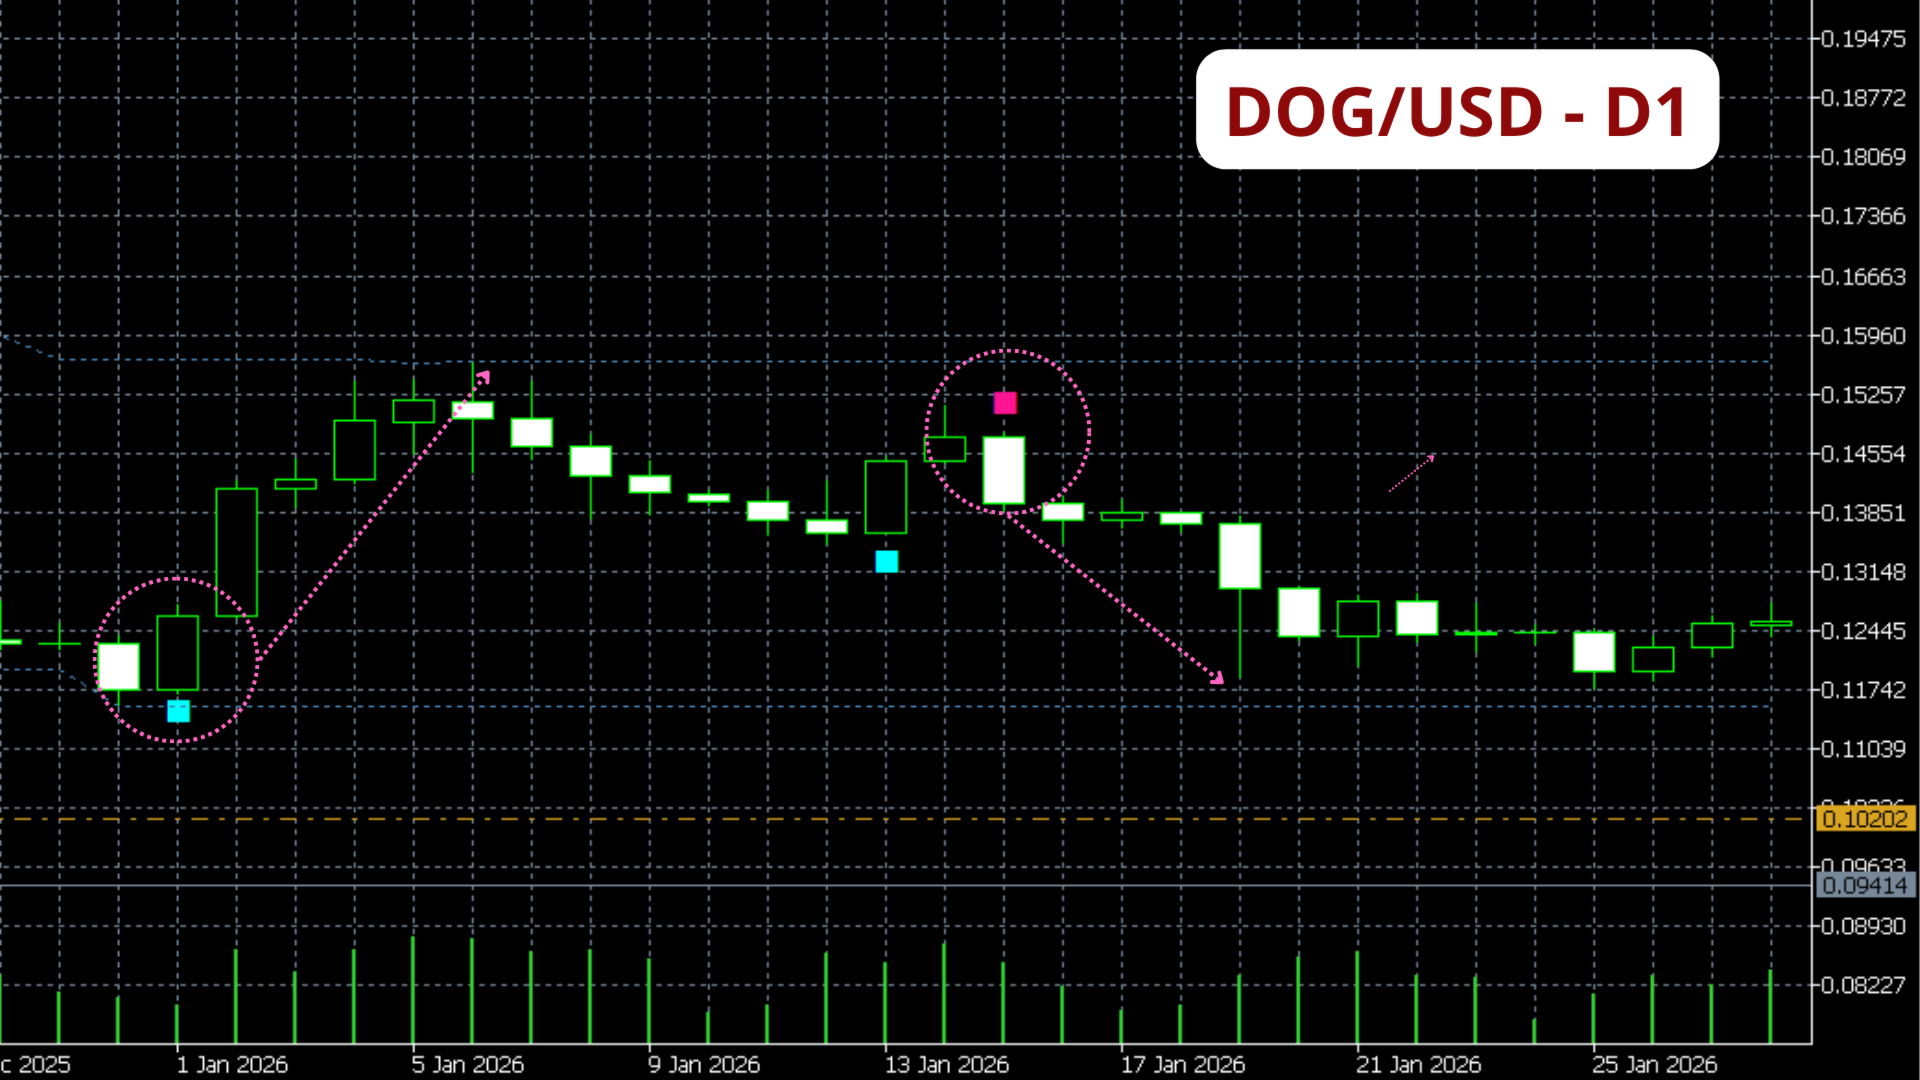
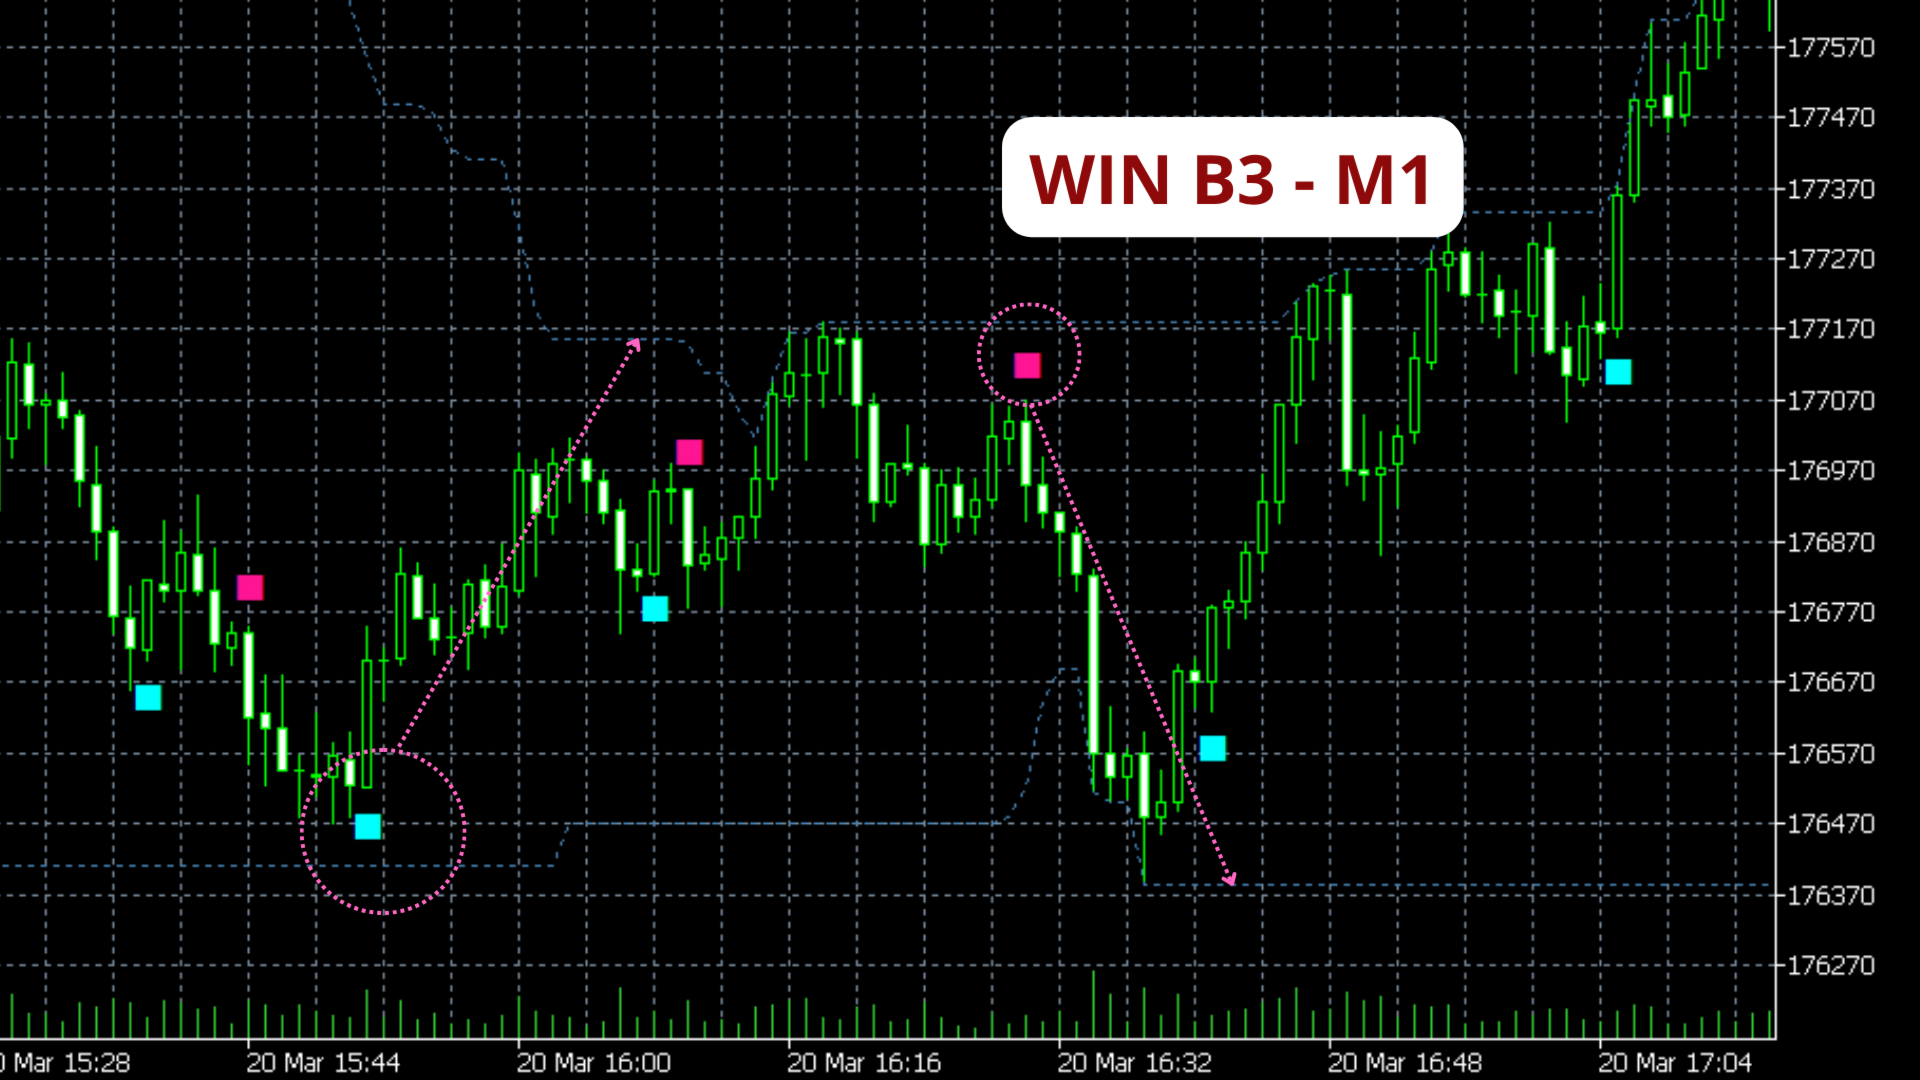
  • Cyan Square: Buy signal. Indicates price DNA has shifted bullish with real momentum.

  • Pink/Magenta Square: Sell signal. Indicates price DNA has shifted bearish with real momentum.

  • Dotted Blue Lines: Your North. The top one is Resistance (ceiling), and the bottom one is Support (floor).

  • Yellow Dashed Line: The Median. Represents price equilibrium.

How to Trade (The Golden Rule):

  1. Avoid the Middle: Do not trade if the signal appears near the yellow line.

  2. Buy Signal: Only valid if the Cyan square appears near the bottom blue line.

  3. Sell Signal: Only valid if the Pink square appears near the top blue line.


Yazarın diğer ürünleri
Fusion Cycles
Jean Carlos Souza
Professional Cycle Analysis with MACD Momentum Sync. Fusion Cycles is a high-performance indicator designed to identify market cycles by merging Stochastic dynamics with MACD momentum filtering. It offers a clear visual map of trend strength through its proprietary dynamic-color line system. Key Features: Momentum Synchronization: The main oscillator line changes color (Lime/Red) based on the MACD Histogram slope, preventing trades against the short-term flow. Strategic DNA Zones: Calibrated at
FREE
Dynamics Edge
Jean Carlos Souza
Dynamics Edge: Statistical Precision in Mean Reversion Dynamics Edge is a volatility boundary indicator designed to identify price exhaustion with high precision. Using an advanced standard deviation calculation ( $2.2 \sigma$ ), it maps the extremities where price is statistically likely to return to equilibrium (median). Key Features: Dynamic Exhaustion Edges: Solid lines that expand and contract based on volatility, identifying overbought (Blue) and oversold (Red) zones. OCR-Ready Price Tags:
FREE
Fibochian Flow
Jean Carlos Souza
Fibochian Flow: Mathematical Precision with 200-Period Trend Filter Fibochian Flow is a professional trading tool that combines dynamic channel volatility with the institutional strength of the 200-period Moving Average. Designed to capture trend ignitions (breakouts), the indicator provides a complete trade setup: Macro Filter, Entry Point, Stop Loss, and three Fibonacci-based Target levels. How Fibochian Flow Works: Trend Filter (Orange Line): Acts as the market's ultimate guide. We only look
FREE
ST Adaptive Flow: Triple Confluence & KAMA Intelligence ST Adaptive Flow is a next-generation indicator designed for traders who demand surgical precision in identifying institutional flow. It is not just a moving average; it is a decision algorithm that combines KAMA (Kaufman Adaptive Moving Average) with momentum filters (RSI) and macro trend (SMA 200). The Core of the Algorithm: Dynamic Adaptive Line: Uses Kaufman’s logic to adjust to market speed. It flattens in sideways markets and slopes a
FREE
Smooth Trend
Jean Carlos Souza
ST Smooth Trend: Silence the Market Noise Trading doesn't have to be a guessing game. Most traders lose money because they react to every small price wiggle. ST Smooth Trend was built to give you a crystal-clear view of the market by filtering out the chaos. Key Benefits for Your Trading: Intuitive Color System: No more confusion. Green means trend up, Red means trend down, and Gray tells you the market is flat—protecting your capital when there’s no clear direction. Visual Safety Zones: The dot
FREE
Pure Path
Jean Carlos Souza
ST Pure Path Indicator Description for Metatrader ST Pure Path Indicator Description for Metatrader This document aims to provide a clear and accessible description of the ST Pure Path indicator, developed for the Metatrader platform. It is designed to assist traders, especially those with little experience, in identifying market trends and decision points visually and intuitively. 1. Visual Identification The ST Pure Path appears on the chart as a continuous, solid line , with a thickness of 2
FREE
ST Flow Context: The Professional Trader’s Compass ST Flow Context is a macro analysis tool developed to identify the predominant direction of institutional money. It filters out intraday noise and delivers the real market context, helping the trader never to trade against the main tide. Key Features: Trend Alignment: Identifies whether the daily flow is bullish or bearish based on multiple timeframes. Interest Zones: Maps where institutional volume is defending positions. Entry Filter: Use Flow
FREE
Heat MA
Jean Carlos Souza
Heat MA Description - English Heat MA Indicator: A Simplified Guide for Traders The Heat MA indicator is a powerful visual tool designed to identify the intensity of trading flow and market pressure directly on your chart. It appears as a continuous line that changes color, offering clear signals about price behavior and underlying volume. 1. How Heat MA Appears on the Chart Imagine a single, robust line (4 pixels thick) that moves along with the price. This line is not just a trace; it's a mark
FREE
ST Multi Regression Indicator Guide for Beginners Simplified Guide: ST Multi Regression Indicator for Beginners What is it? It's a visual tool that helps identify good times to buy or sell in the financial market, based on colors and signals that appear on the chart. How does it work? Main Elements: Main Line (Oscillator) Blue (Aqua): Good time to buy Orange: Good time to sell Dotted Line (Silver) Serves as reference for signals Arrows ️ Blue: Buy signal ️ Orange: Sell signal When to Trade?
FREE
Filtrele:
Değerlendirme yok
Değerlendirmeye yanıt