HTFLiquidityDashboard
- Göstergeler
- Sürüm: 1.39
- Etkinleştirmeler: 5

🚀 HTF Liquidity & Breakout Dashboard – The Ultimate Multi-Symbol Scanner
Tired of scanning dozens of charts for crucial liquidity levels? The HTF Liquidity Dashboard is a professional, comprehensive multi-symbol panel for MetaTrader 5. It automatically monitors the most important Higher Timeframe (HTF) levels for up to 29 symbols simultaneously, showing you at a glance where liquidity lies, where breakouts occur, and where lucrative retests form.
Originally developed from an Algo Trading concept and massively expanded for MT5 (including ADR, Weekly Pivots, and Session Killzones), this indicator is the ultimate tool for Price Action, SMC (Smart Money Concepts), and ICT Traders.
🔥 Core Features & Benefits
-
Multi-Symbol Dashboard (1-Click Chart Switch): Monitor Forex, Indices, Crypto, and Stocks simultaneously in a clean, non-intrusive dashboard. A single click on a symbol in the panel instantly opens the corresponding chart!
-
Auto-Detection of HTF Liquidity: The system automatically draws and monitors:
-
Daily: Previous Daily High (PDH) & Low (PDL)
-
Weekly: Previous Weekly High (PWH), Low (PWL), Open (PWO) & Close (PWC)
-
Monthly: Previous Monthly High (PMH) & Low (PML)
-
-
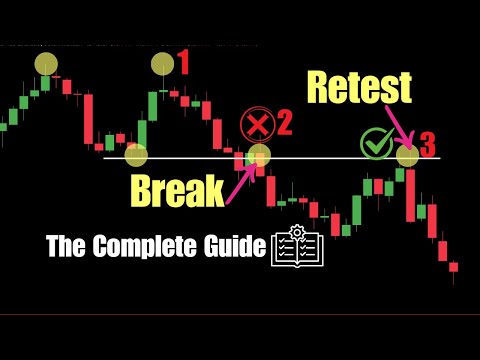
Breakout & Retest Logic (Smart Alerts): The dashboard not only displays whether a level was broken (Sweep/Exceed) or held (Failed), but it also detects exact Retests (highlighted in Gold) when the price returns to a level after a breakout.
-
Integrated ADR (Average Daily Range): Keep an eye on daily volatility. The dashboard shows the current daily range in pips and warns you via a percentage if an asset has exhausted its ADR (overextended).
-
Weekly Pivot Sectors: Integrated pivot points (PP, R1-R3, S1-S3). The system calculates the distance and shows you in real-time which pivot sector the price is currently trading in.
-
Session Killzones: Automatically draws customizable time windows for the London and New York sessions as colored boxes directly on your chart – perfect for session breakout strategies.
-
Active Trade Highlight: The dashboard automatically detects if you currently have an open position in one of the symbols and highlights it (e.g., in Blue) so you never lose track of your active trades.
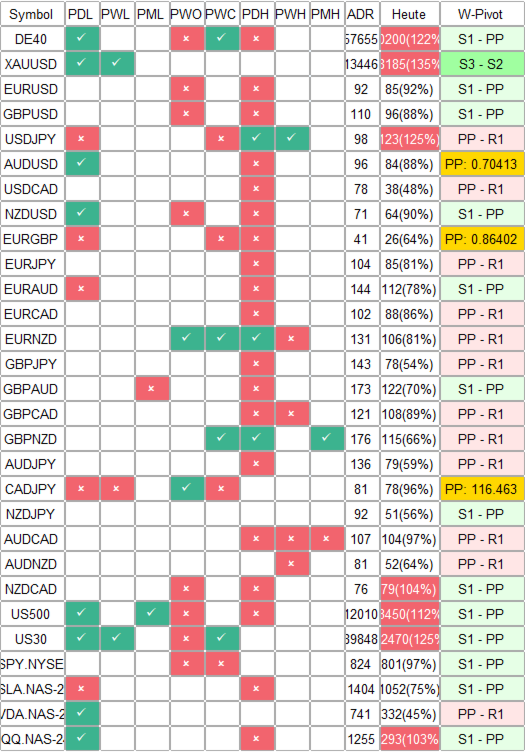
📊 How to Read the Dashboard:
The indicator uses an intuitive color and symbol system to provide immediate context:
-
White / Default: Price is trading within the HTF range.
-
Green (Exceed): The HTF level was successfully broken (Breakout).
-
Red (Failed): The price tested the level but was rejected (Rejection/Sweep).
-
Gold (Retest): The price previously broke the level and is now testing it from the other side (ideal for entries!).
⚙️ Key Parameters (Fully Customizable)
-
Symbols: Fully customizable list (Default: Major Forex, DE40, US500, XAUUSD, TSLA, etc.).
-
Retest Distance: Adjust how close the price needs to get to a level (in points) to be considered a valid retest.
-
Alerts: Push notifications to your phone and desktop pop-ups as soon as the price approaches a key HTF level (Proximity Alerts).
-
Broker Offset Hours: Perfectly align the session killzones (London/NY) with your broker's server time.
-
Visuals: 100% customizable colors, boxes, line styles, and dashboard positions to fit your own chart template.
💡 Trading Recommendations
-
Load the dashboard on a "Master Chart" (e.g., M5 or M15 timeframe).
-
Watch the dashboard for rejections (Red) at PDH/PDL for mean-reversion trades, or golden retests for clean trend continuations.
-
Click on a symbol showing a promising setup to jump directly into the chart. Look for your price action confirmation within the active Killzones (London/NY boxes).