Efficiency Ratio Indicator
- Göstergeler
-
Mattia Impicciatore
 Merhaba,
Ben Mattia. Fintech yazılım geliştiricisi ve trader’ım. MQL5, Python ve web teknolojileri konusunda uzmandım. - Sürüm: 1.40
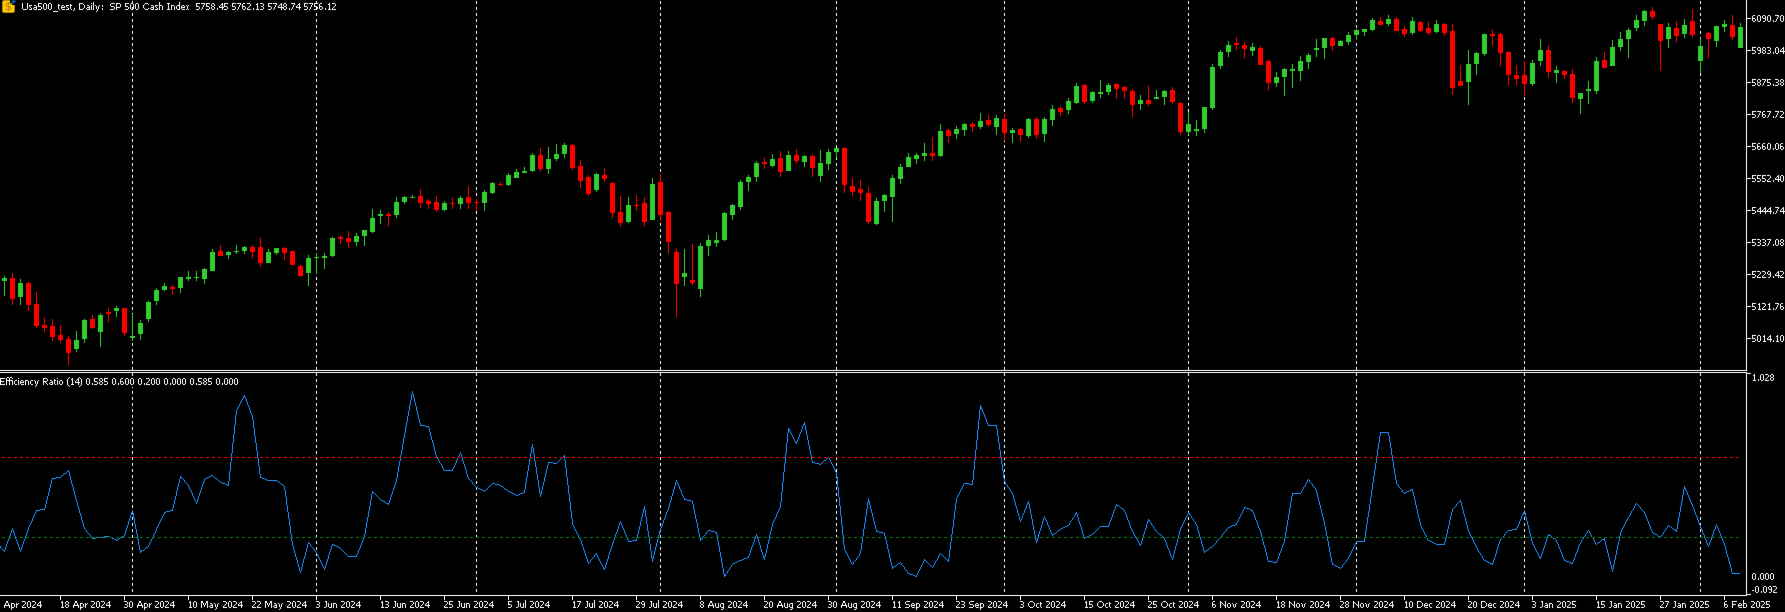
Short Description:
A powerful tool to measure trend efficiency and filter market noise. Toggle between a sleek line chart or a color-coded histogram with threshold alerts.
Key Features:
-
Dual Plot Styles: Line (RSI-like) or colored histogram (Trend/Neutral/Range).
-
Configurable Thresholds: Set your own upper (trend) and lower (range) levels.
-
Multi-Mode Visualization: Clear visual cues—green for strong trends, gray for consolidation, red for ranging markets.
-
Flexible Period: Adjustable calculation period (default 14).
-
Lightweight & Fast: Optimized MQL5 code ensures minimal CPU usage.
-
Seamless Integration: Drops into any chart as a separate window.
Inputs & Parameters:
-
ER calculation period (int): Number of bars for Efficiency Ratio (default = 14).
-
Upper threshold (double): ER value above which the market is in trend (default = 0.6).
-
Lower threshold (double): ER value below which the market is ranging (default = 0.2).
-
Plot style (enum): Choose between Line or Histogram presentation.
How to Use:
-
Attach the indicator to a chart.
-
Adjust the period and thresholds in the Inputs tab.
-
Select your preferred plot style: Line shows a clean ER curve; Histogram colors bars by state.
-
Monitor the ER transitions:
-
ER > upper threshold (trend signal)
-
ER < lower threshold (range signal)
-
Between thresholds (neutral)
-
Benefits:
-
Quickly spot trending vs. ranging conditions.
-
Improve entry/exit timing by confirming market efficiency.
-
Filter false breakouts in choppy markets.
Screenshots (suggestion):
-
Chart view: ER line with dotted threshold lines.
-
Chart view: ER histogram colored bars.
-
Inputs panel showcasing parameters.
Support & Updates:
-
Free updates and bug fixes for 12 months.
-
Email support: mattimp93@gmail.com