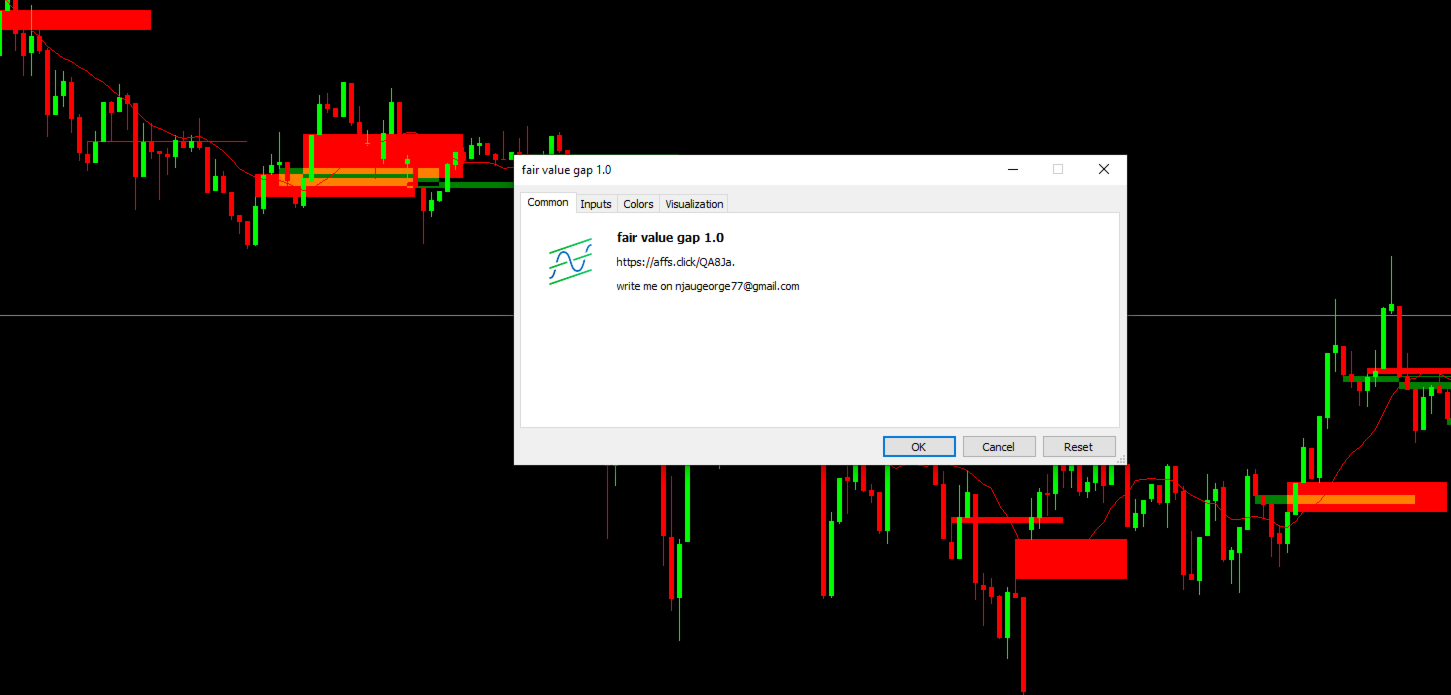
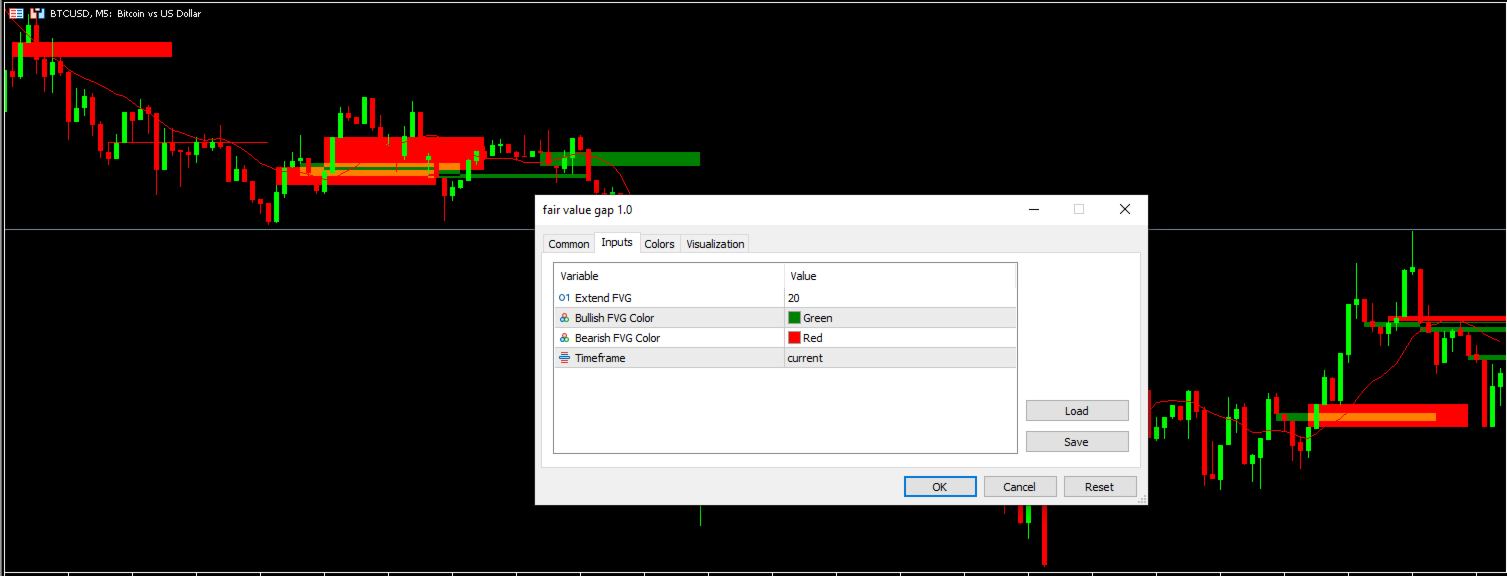
Fair Value Gap FVG
- Göstergeler
- Sürüm: 1.0
- Etkinleştirmeler: 5

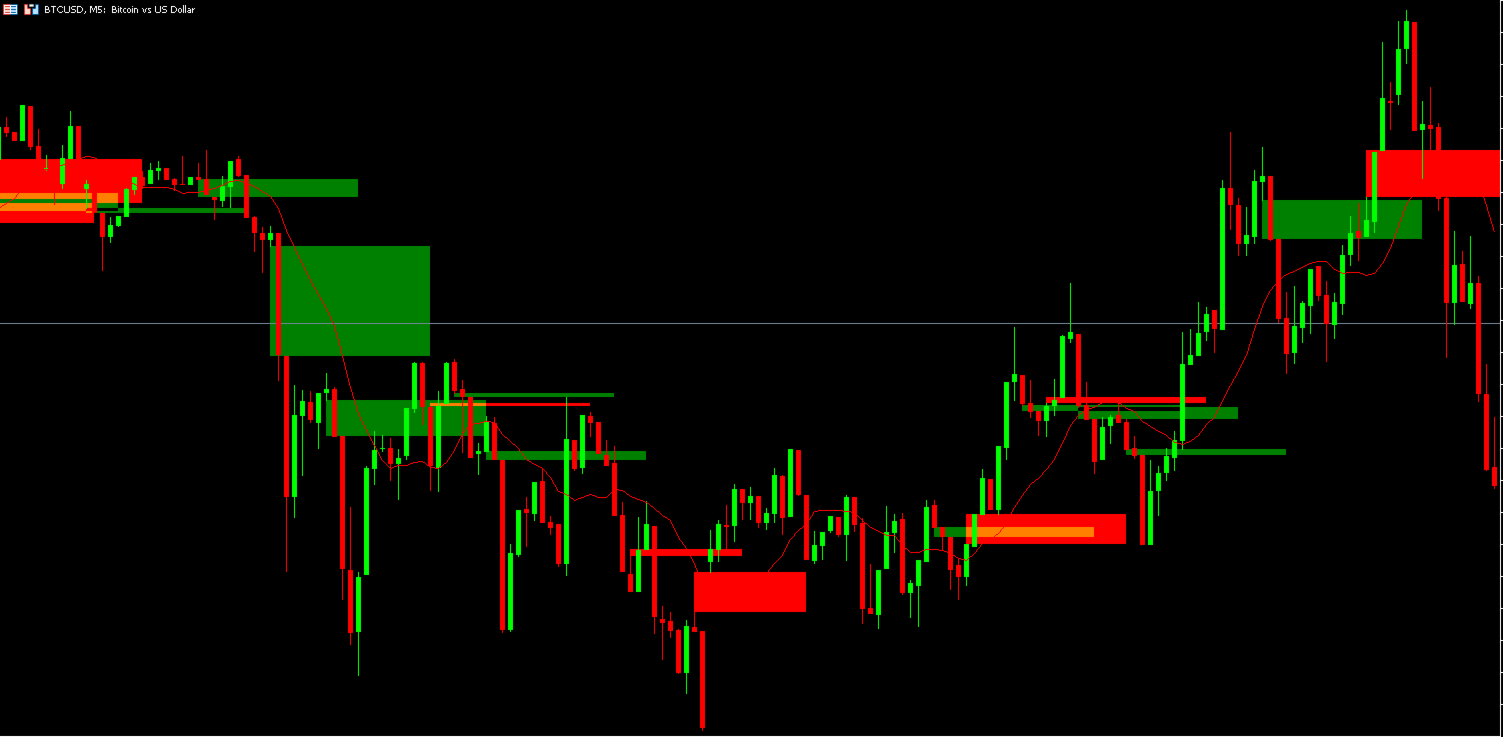
A fair value gap (FVG) is a temporary price gap that occurs when the price of a stock or security is out of line with its fair value. This gap is often caused by an imbalance between buyers and sellers.
How it works
- Price imbalanceWhen there is an imbalance between buyers and sellers, the price of a security can move too quickly.
Price gap
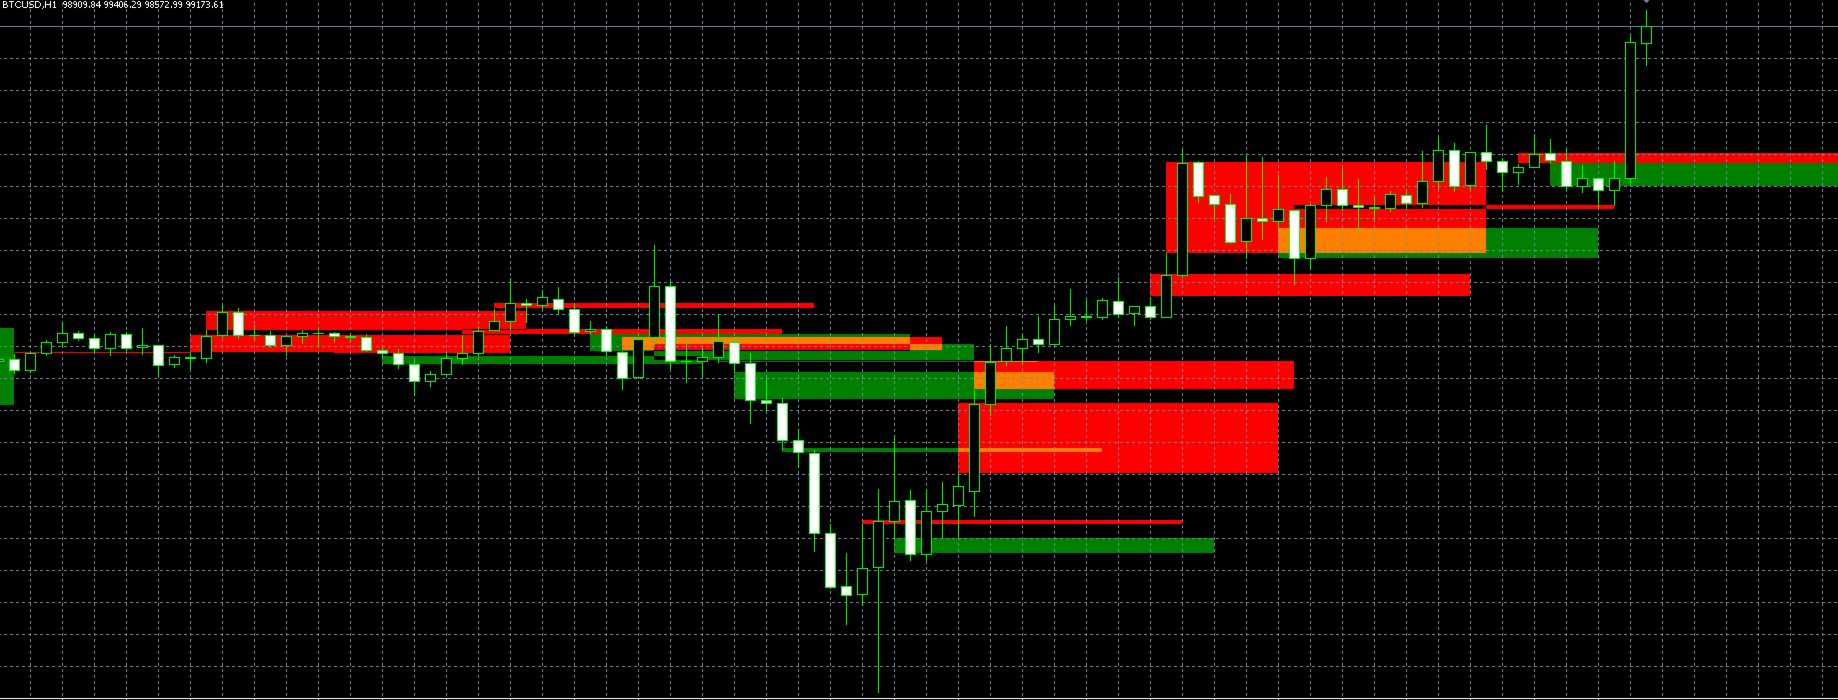
This creates an unadjusted area on the price chart, known as the fair value gap
Price correction
The price is often drawn back to the fair value gap, as if by a magnet, to correct the imbalance
Price continuation
Once the gap is filled, the price will often continue moving in the same direction as before.
Why it's important
-FVGs are a valuable tool for traders because they can help predict price movements.
-Traders can use FVGs to identify when to buy or sell.
-FVGs can be caused by major news events, such as interest rate increases, political news, or natural disasters.