CISD Change in State of Delivery
- Göstergeler
- Minh Truong Pham
- Sürüm: 1.0
- Etkinleştirmeler: 10
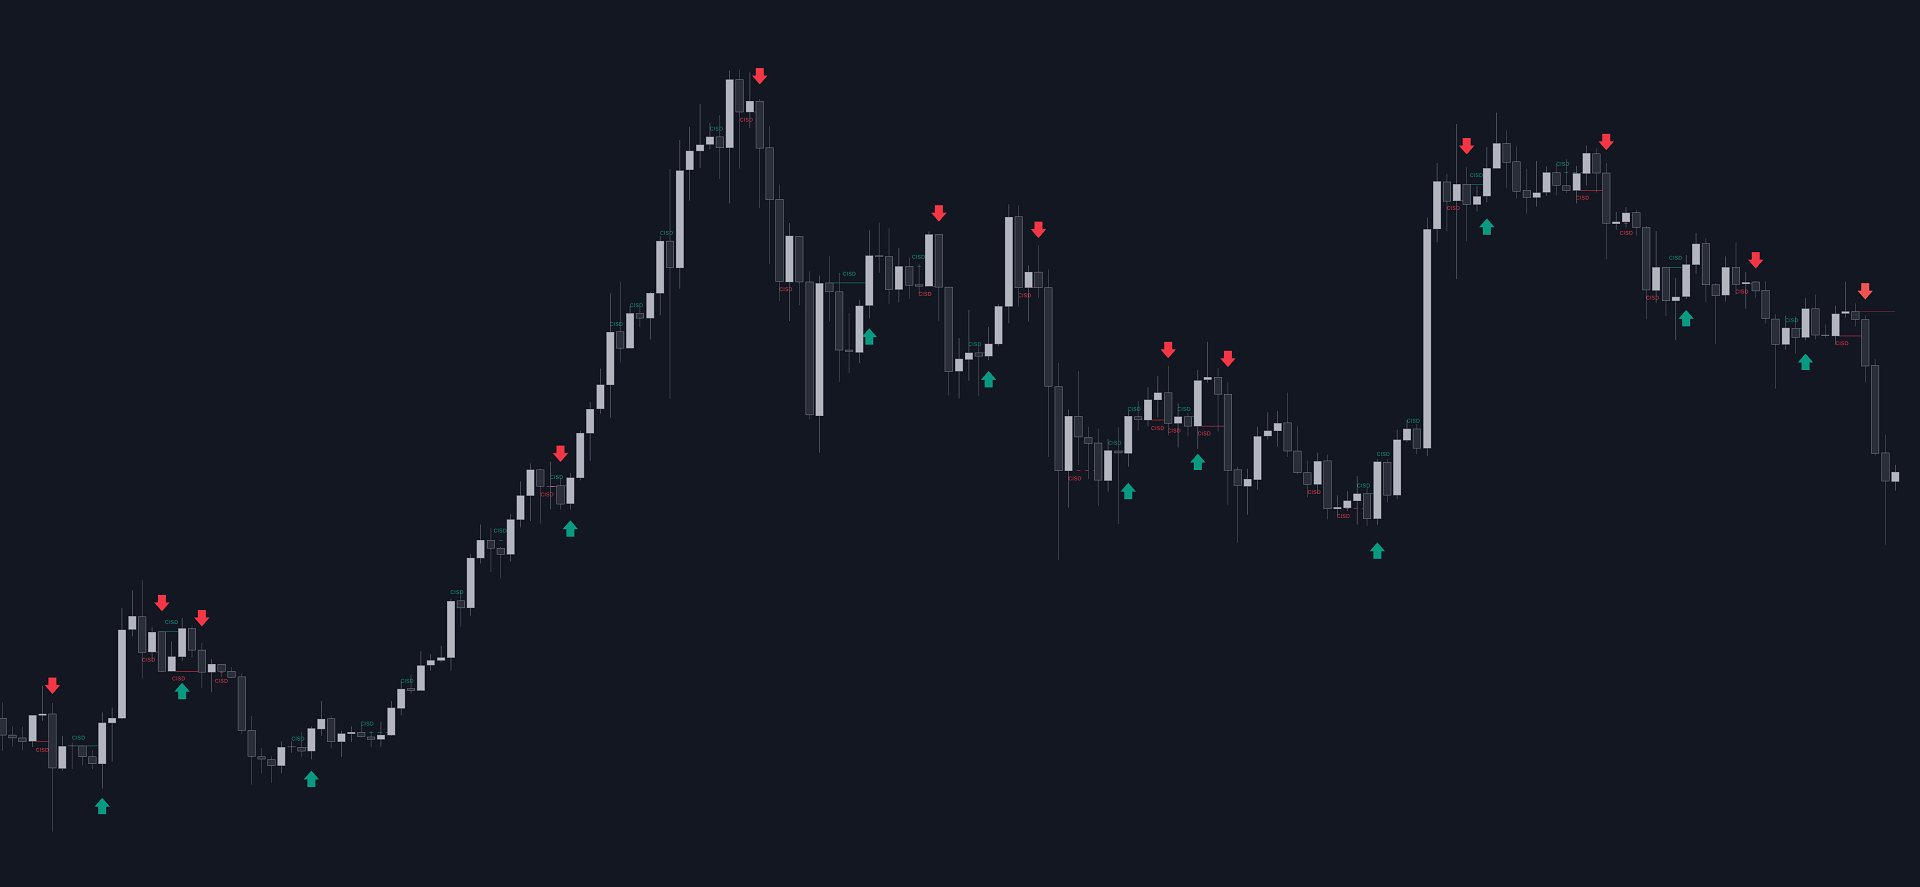
The Change In State Of Delivery (CISD) indicator detects and displays Change in State Of Delivery, a concept related to market structures.
Users can choose between two different CISD detection methods. Various filtering options are also included to filter out less significant CISDs.
🔶 USAGE
Figure 2
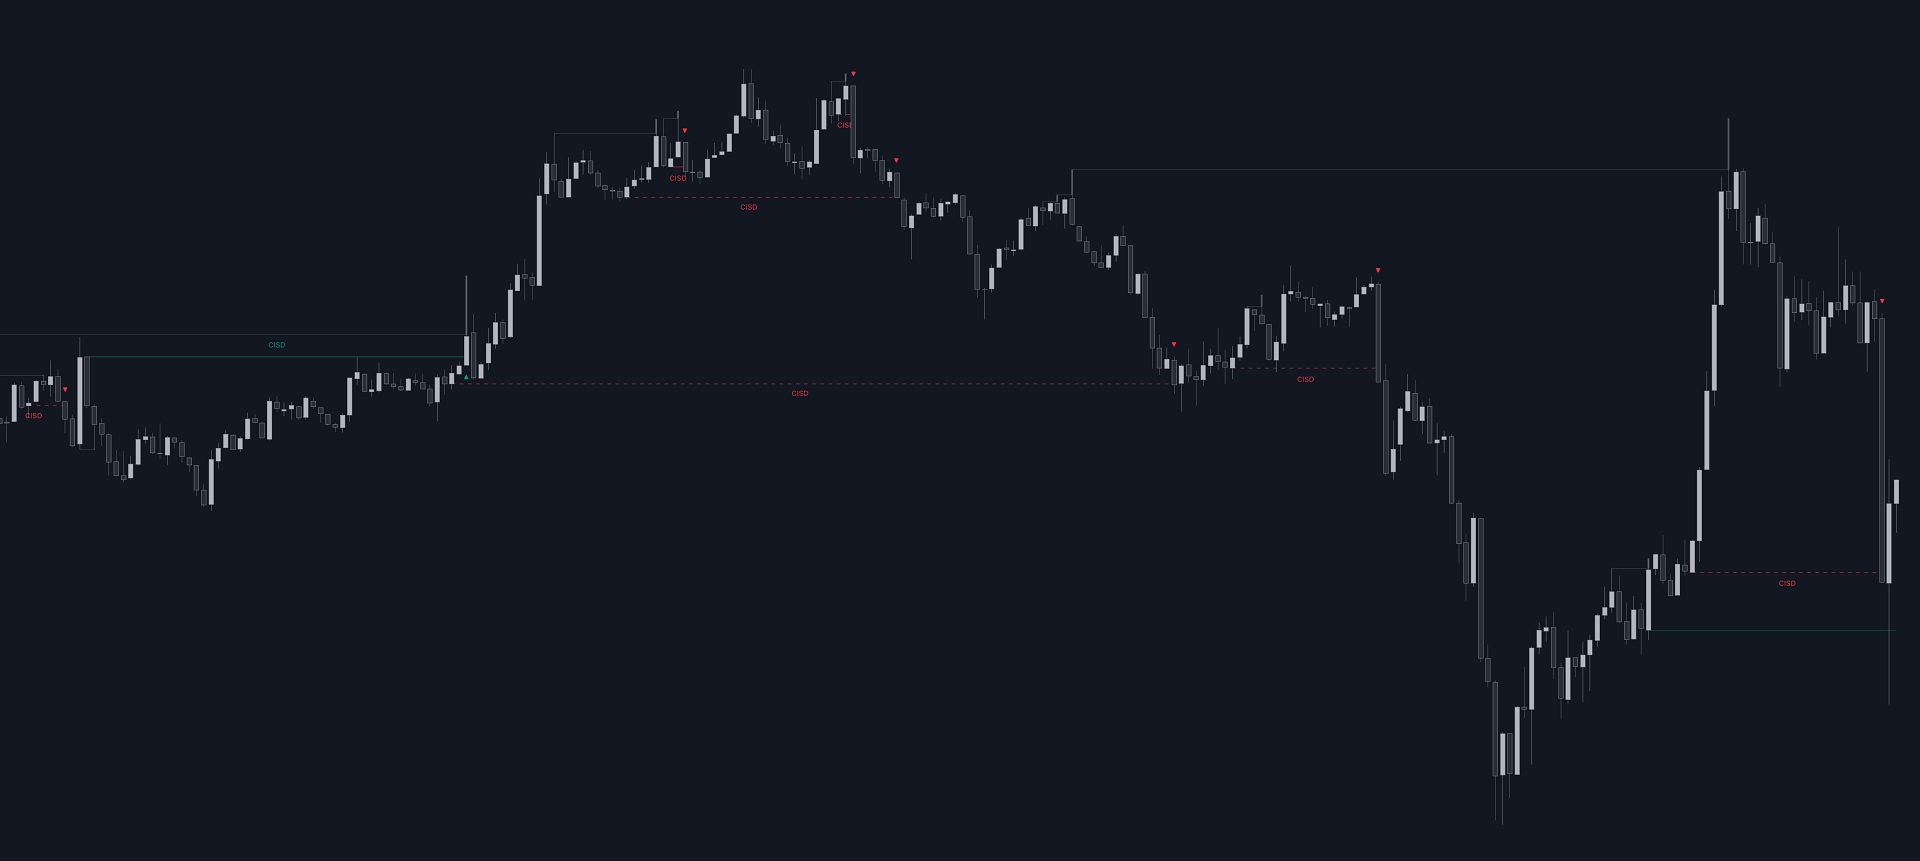
A Change in State of Delivery (CISD) is a concept closely related to market structures, where price breaks a level of interest, confirming trends and their continuations from the resulting breakouts.
Unlike more traditional market structures which rely on swing points, CISDs rely on a persistent sequence of candles, using the sequence extremes as breakout levels.
Figure 3
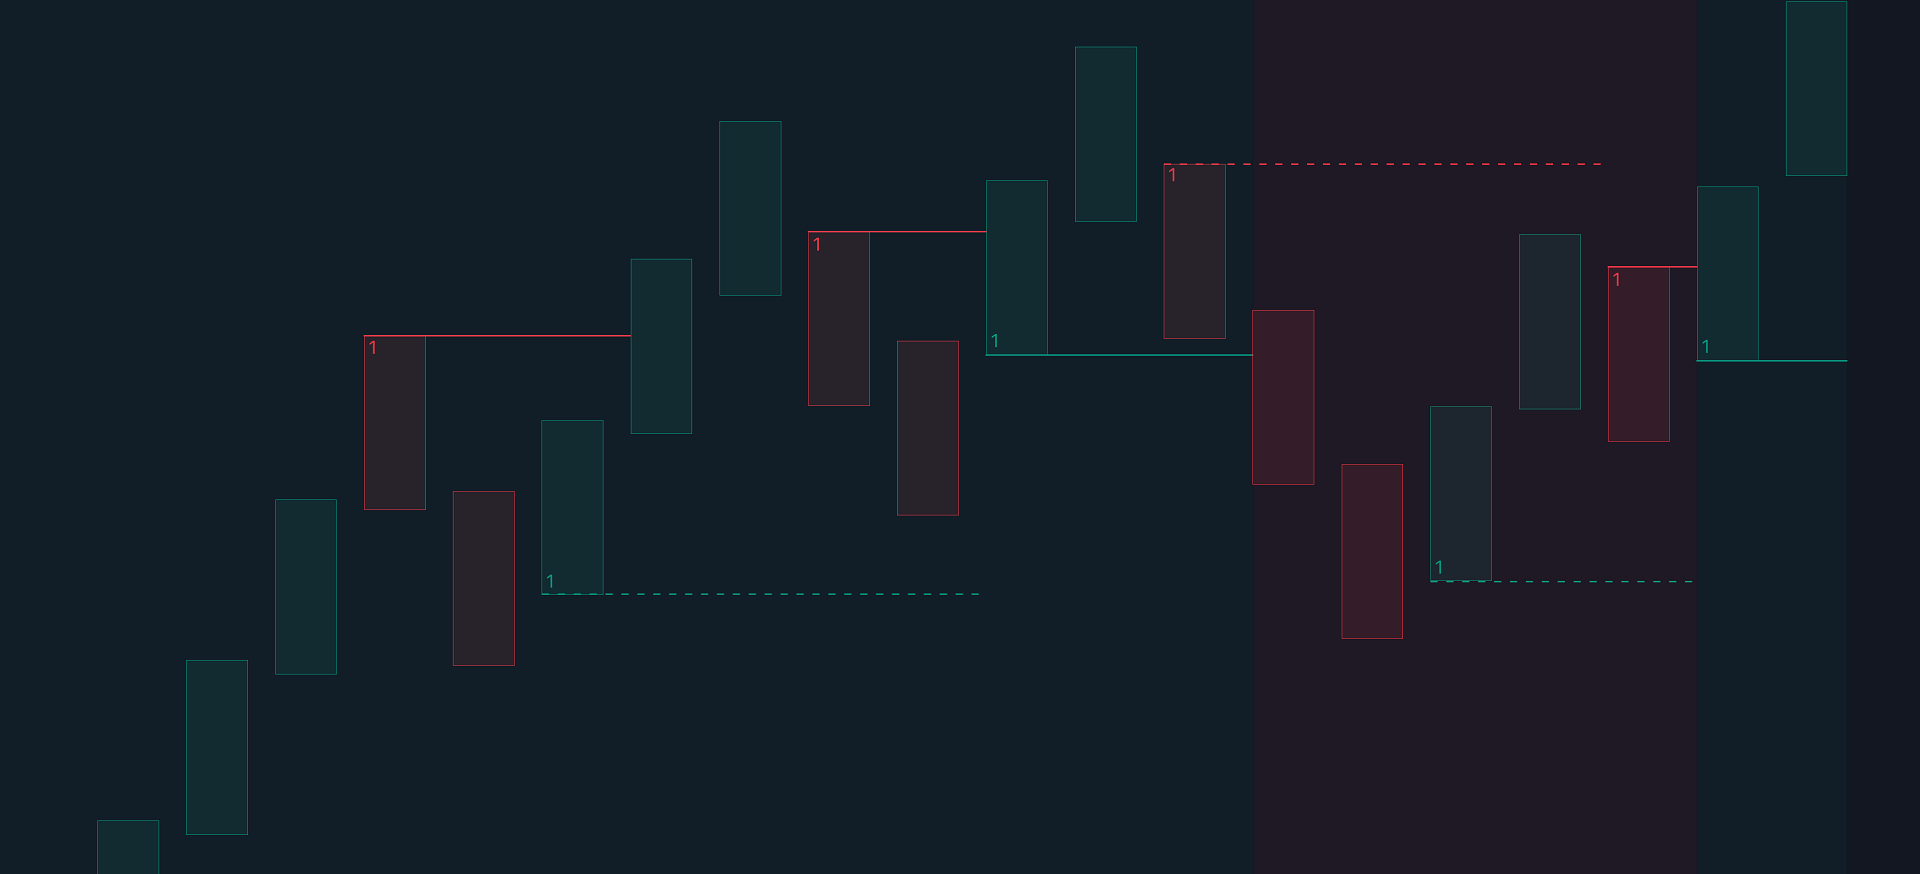
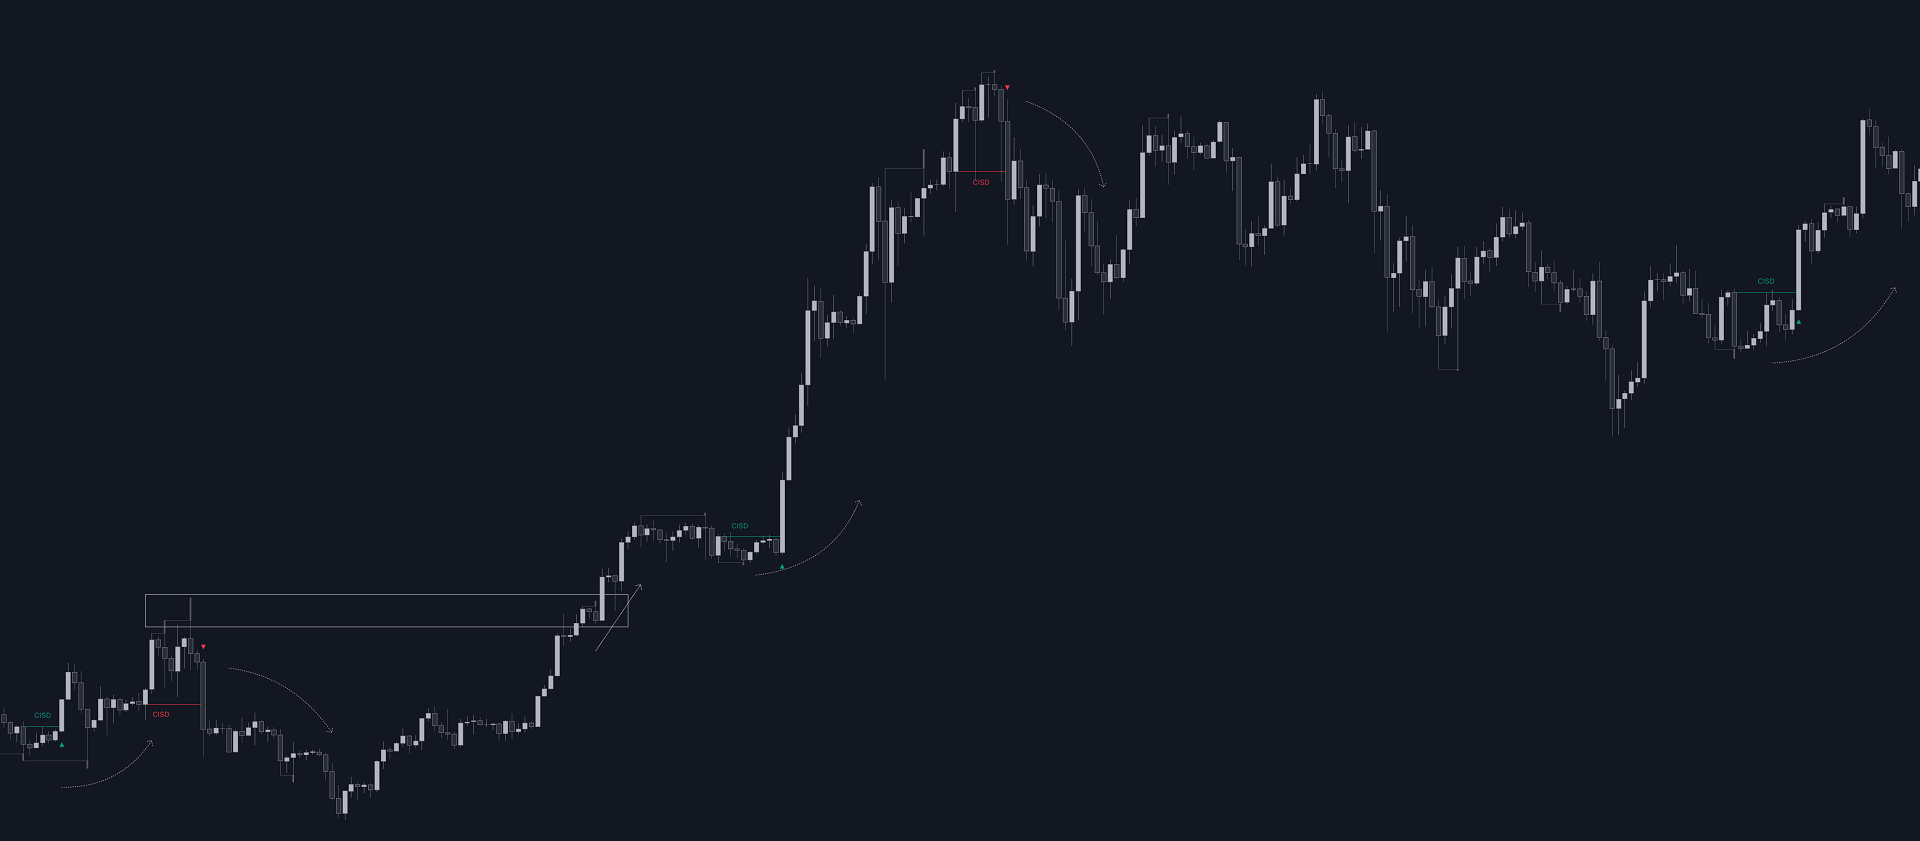
CISDs are detected as follows:- Bullish: The price closes above the opening price of the first candle in a sequence of bearish candles (or its own opening price if it's the only candle).
- Bearish: The price closes below the opening price of the first candle in a sequence of bullish candles (or its own opening price if it's the only candle).
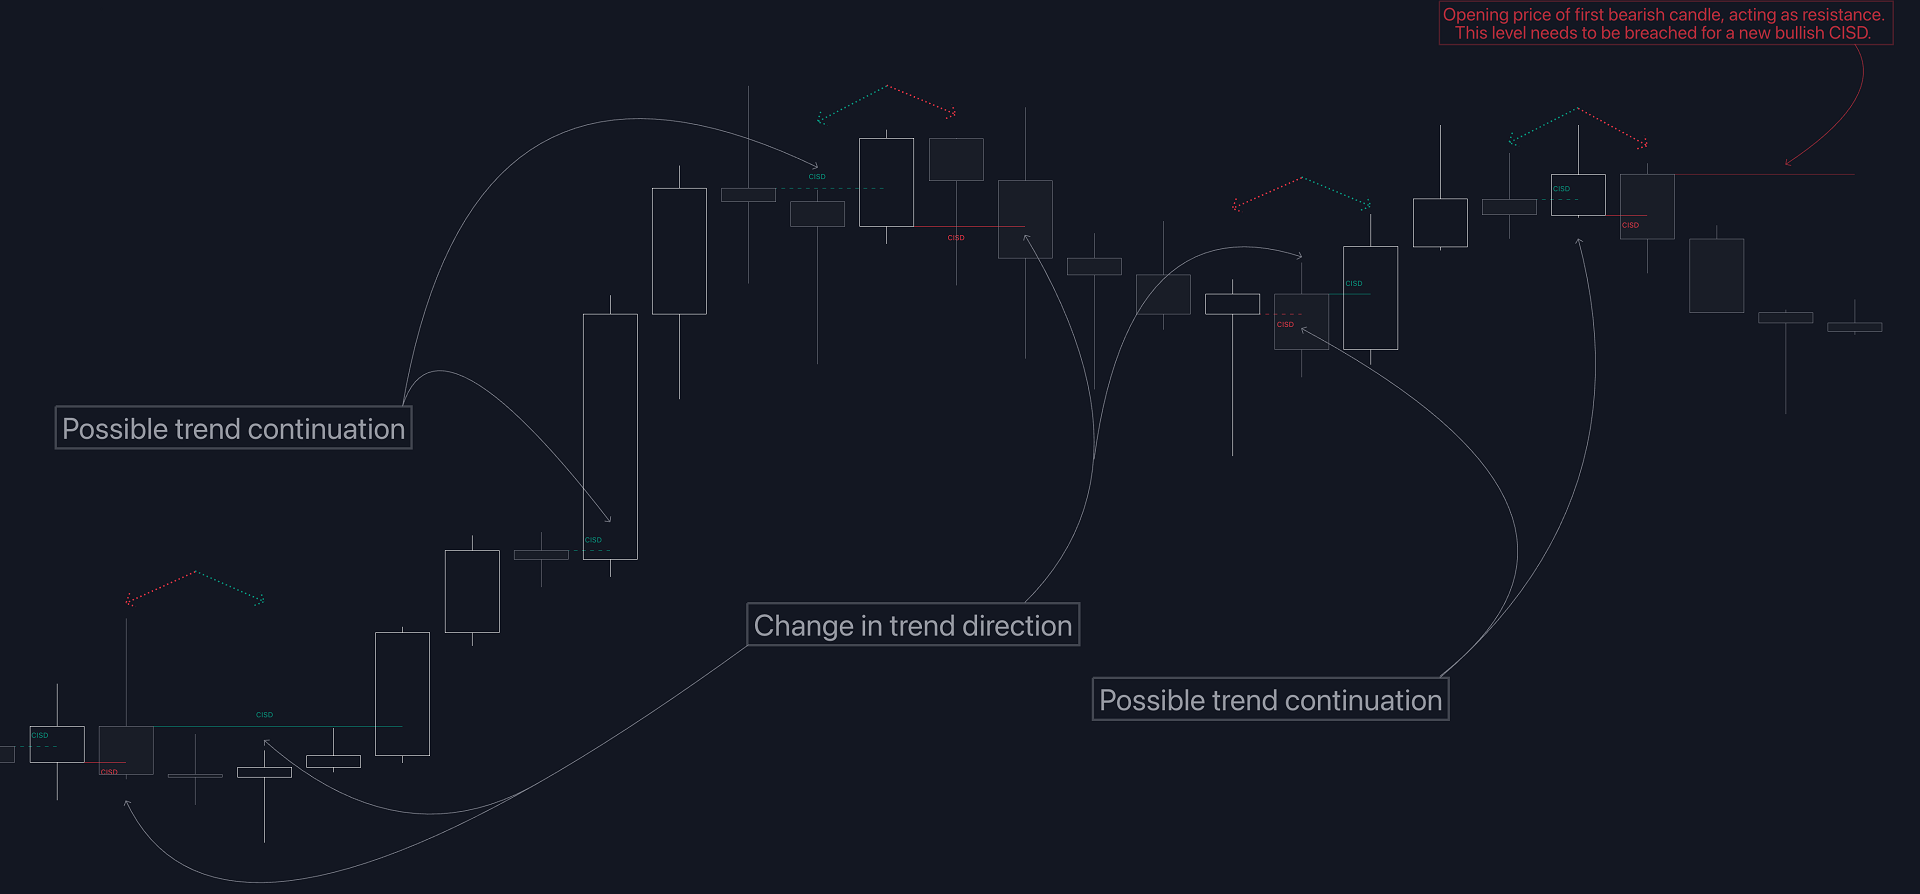
If a newly detected CISD aligns with the indicator's current established trend, this confirms a trend continuation (represented with a dashed line).
On the other hand, if a newly detected CISD is in the opposite direction to the detected trend it can confirm a trend reversal (represented with a solid line).
Figure 4
🔹 Liquidity Sweep Detection Method
Figure 5
Using Liquidity Sweeps to update CISD breakout levels allows us to obtain less frequent and more relevant levels that are less sensitive to noisy price variations.Sweeps are obtained from detected Swing Points, with a higher Swing Length allowing us to obtain longer-term swing levels and potentially more detected sweeps from a specific level over time.
Note: The 'Swing Length' setting is only applicable on the Liquidity Sweep Detection Method and will only change the Liquidity levels.
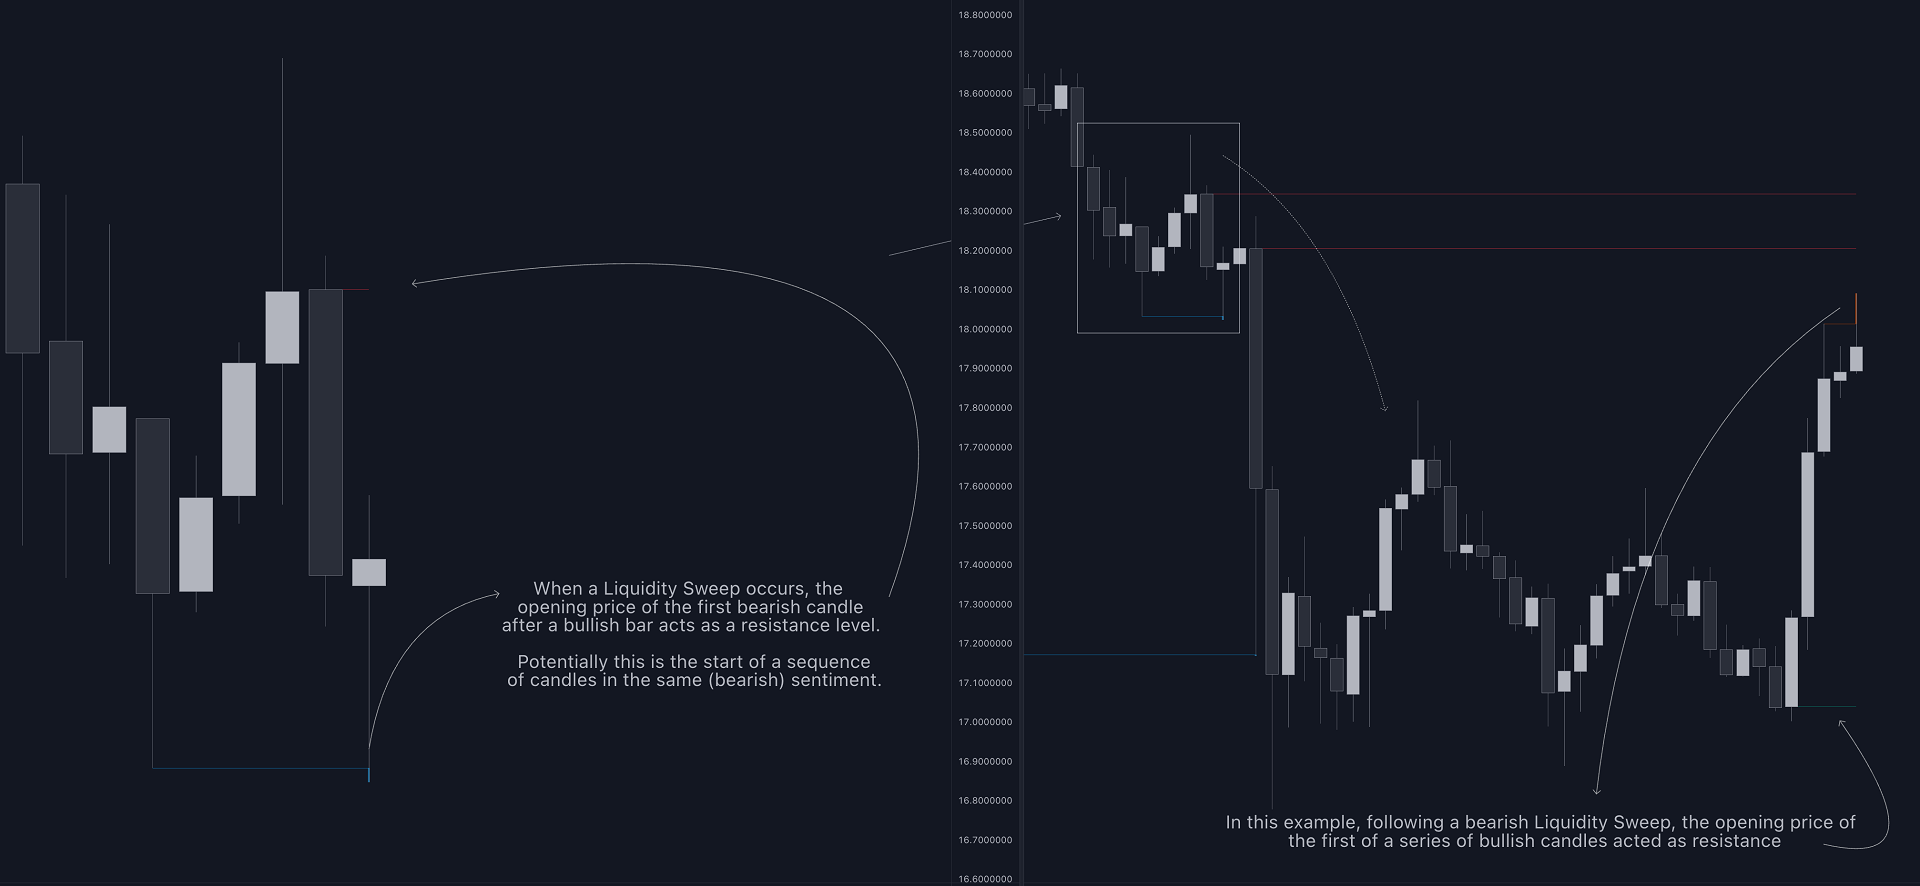
A Liquidity Sweep is valid when the price reaches an important liquidity level, after which the price closes below/above this level.
- Bullish scenario: The price goes below a previous unbroken Swing Low but closes above.
- Bearish scenario: The price goes above a previous unbroken Swing High but closes below.
Figure 6
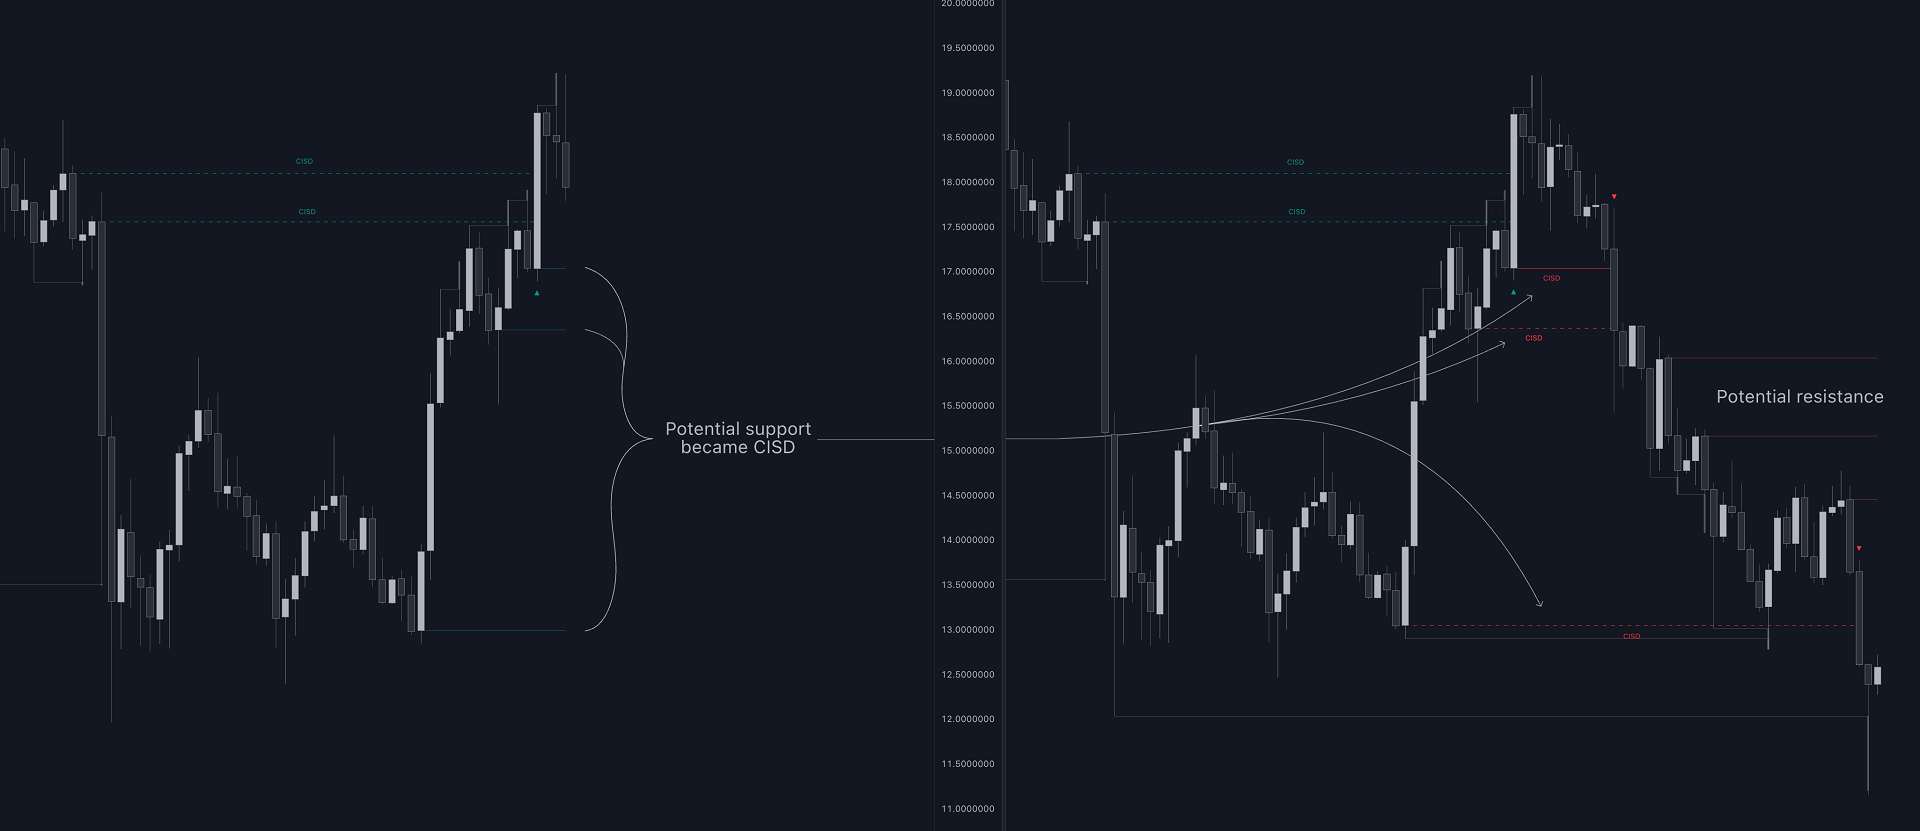
After a Liquidity Sweep has been detected, the last level of importance acts as support/resistance. Breaking this level in the other direction changes the state of delivery.
Figure 7
Users must keep observing the price and significant levels, as highlighted by the white rectangle in the above example.
🔹 CISD Filtering
Figure 8
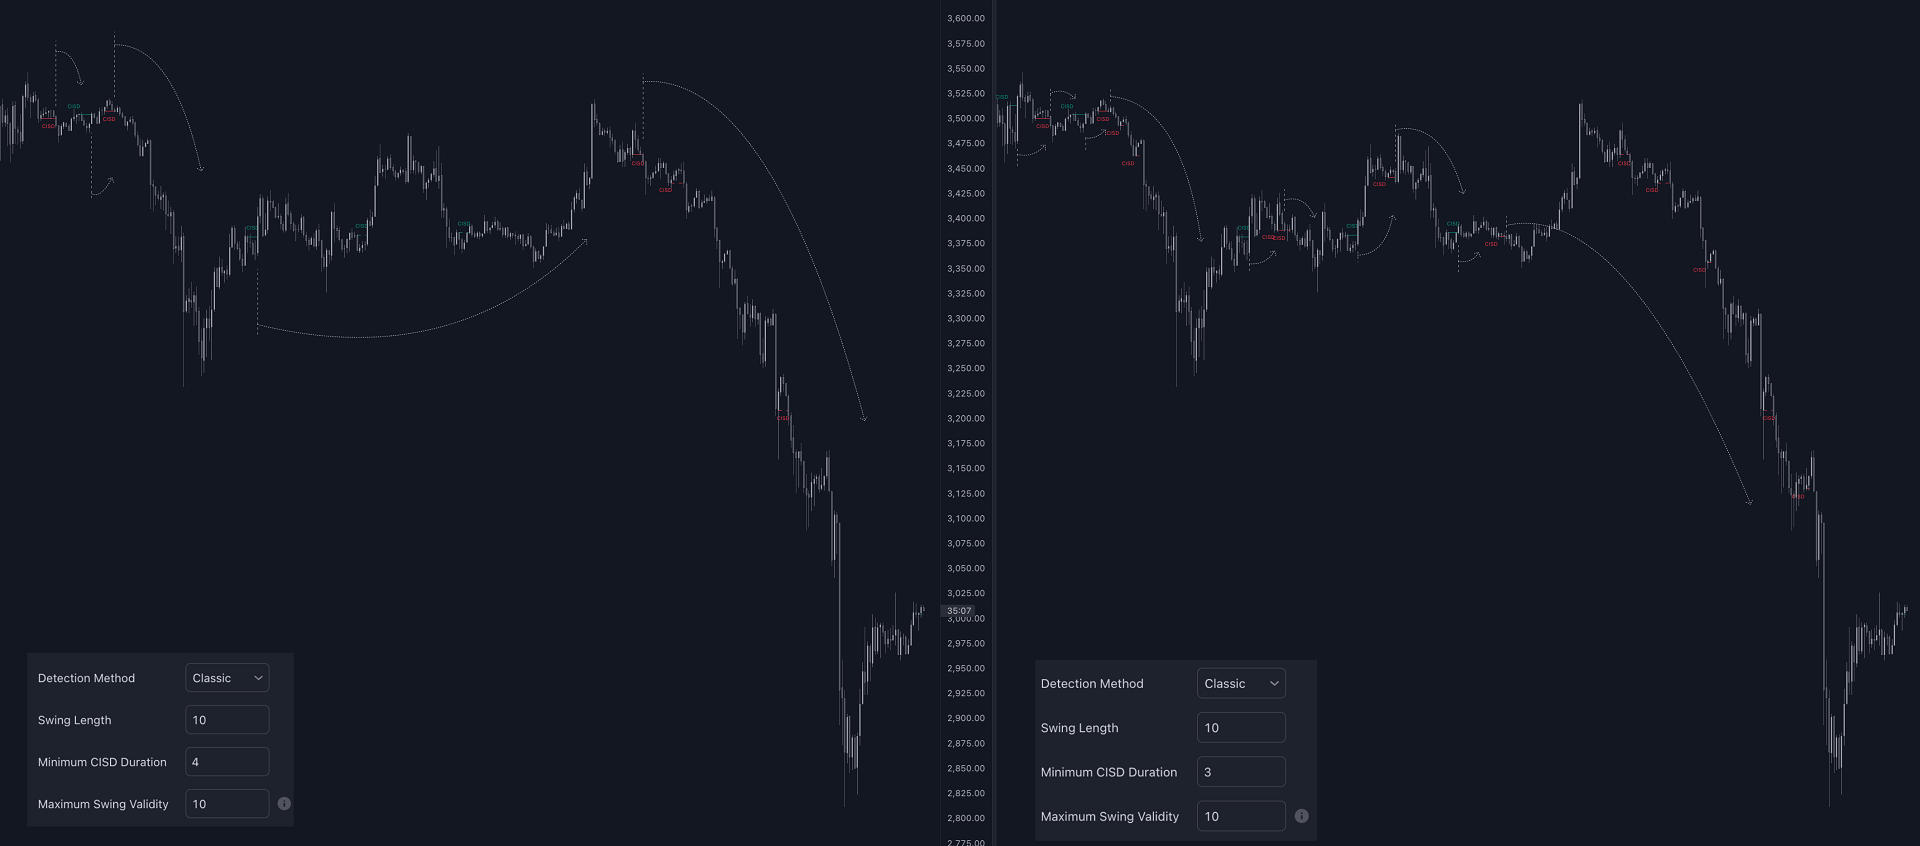
Users can adjust the following two settings:- Minimum CISD Duration: The minimum length of the 'CISD' line
- Maximum Swing Validity: The maximum length of the 'CISD' line; potential CISD lines that aren't broken are deleted when exceeding the limit.
Figure 9
The chart can get cluttered when the Minimum CISD Duration is low. Users could focus on a switch in trend (first solid line CISD), where the following dashed CISD lines can be seen as extra opportunities/confirmations.
🔶 DETAIL
🔹 Using Different Timeframes
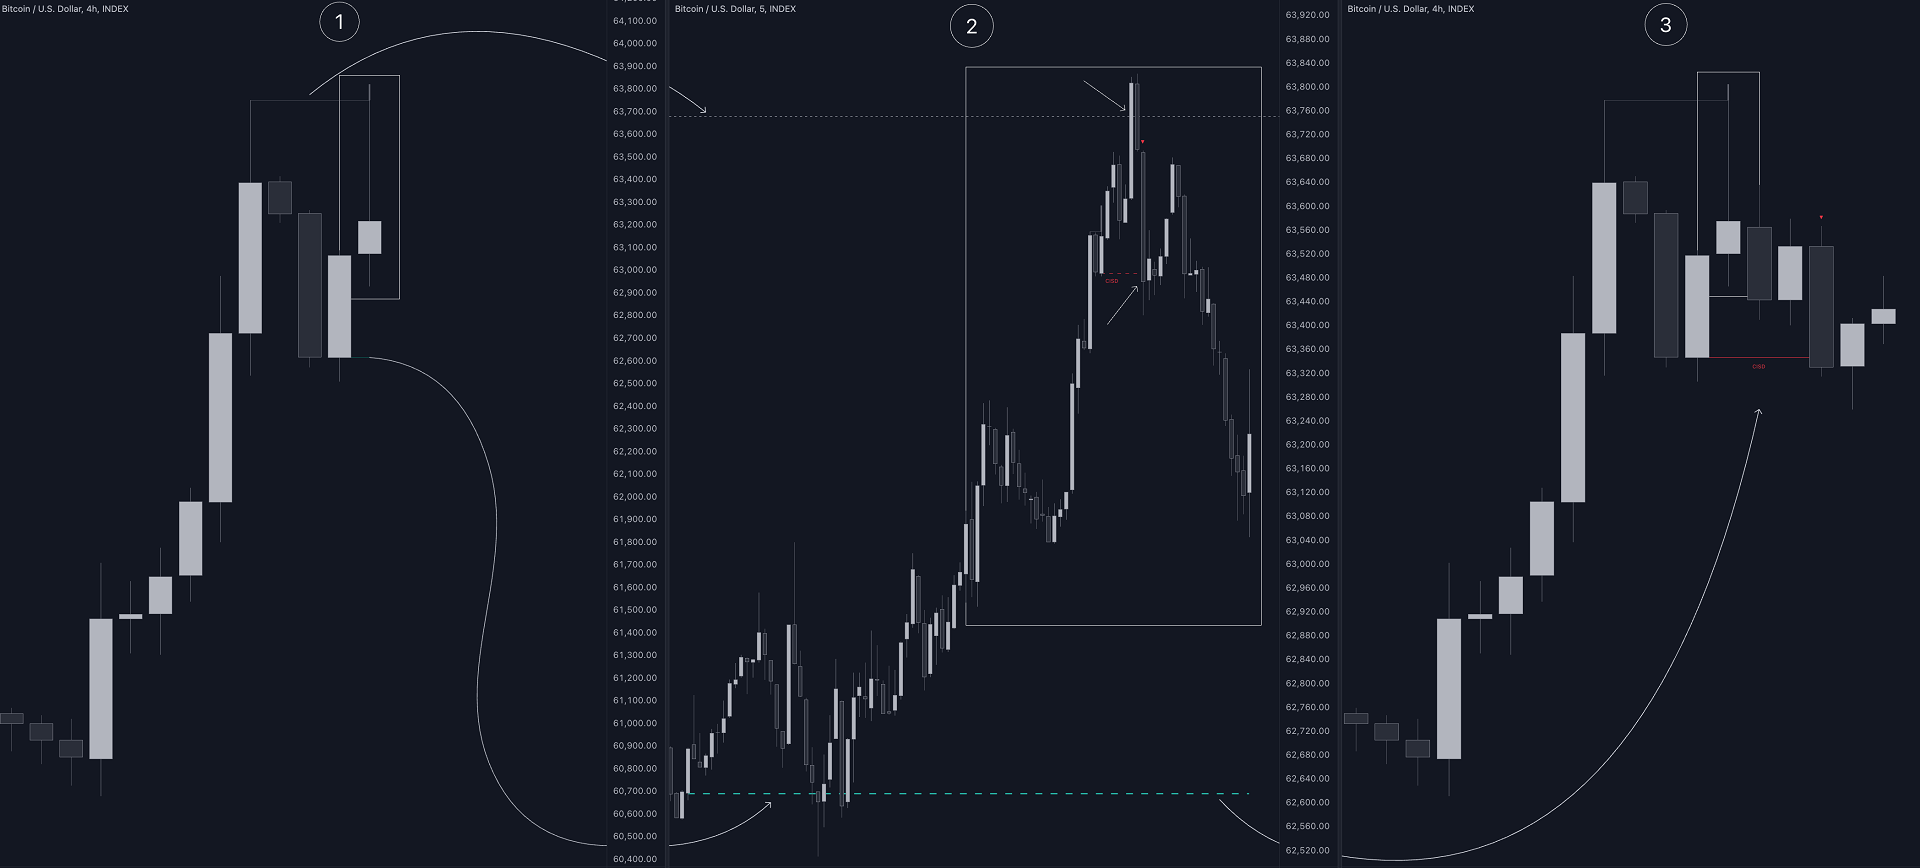
When an important liquidity level (Previous Swing high/low, FVG, etc.) is reached on the higher timeframe, the user can move to a lower timeframe to check whether there is a CISD.
Figure 10
Above example:- The high of the last candle breaches a liquidity level (previous Swing High). The opening price of the last candle acts as a trigger/confirmation level.
- A confirmed CISD is seen in a lower timeframe, just after this Liquidity Sweep. This could be an early opportunity.
- Later, a confirmed CISD on the higher timeframe is established.
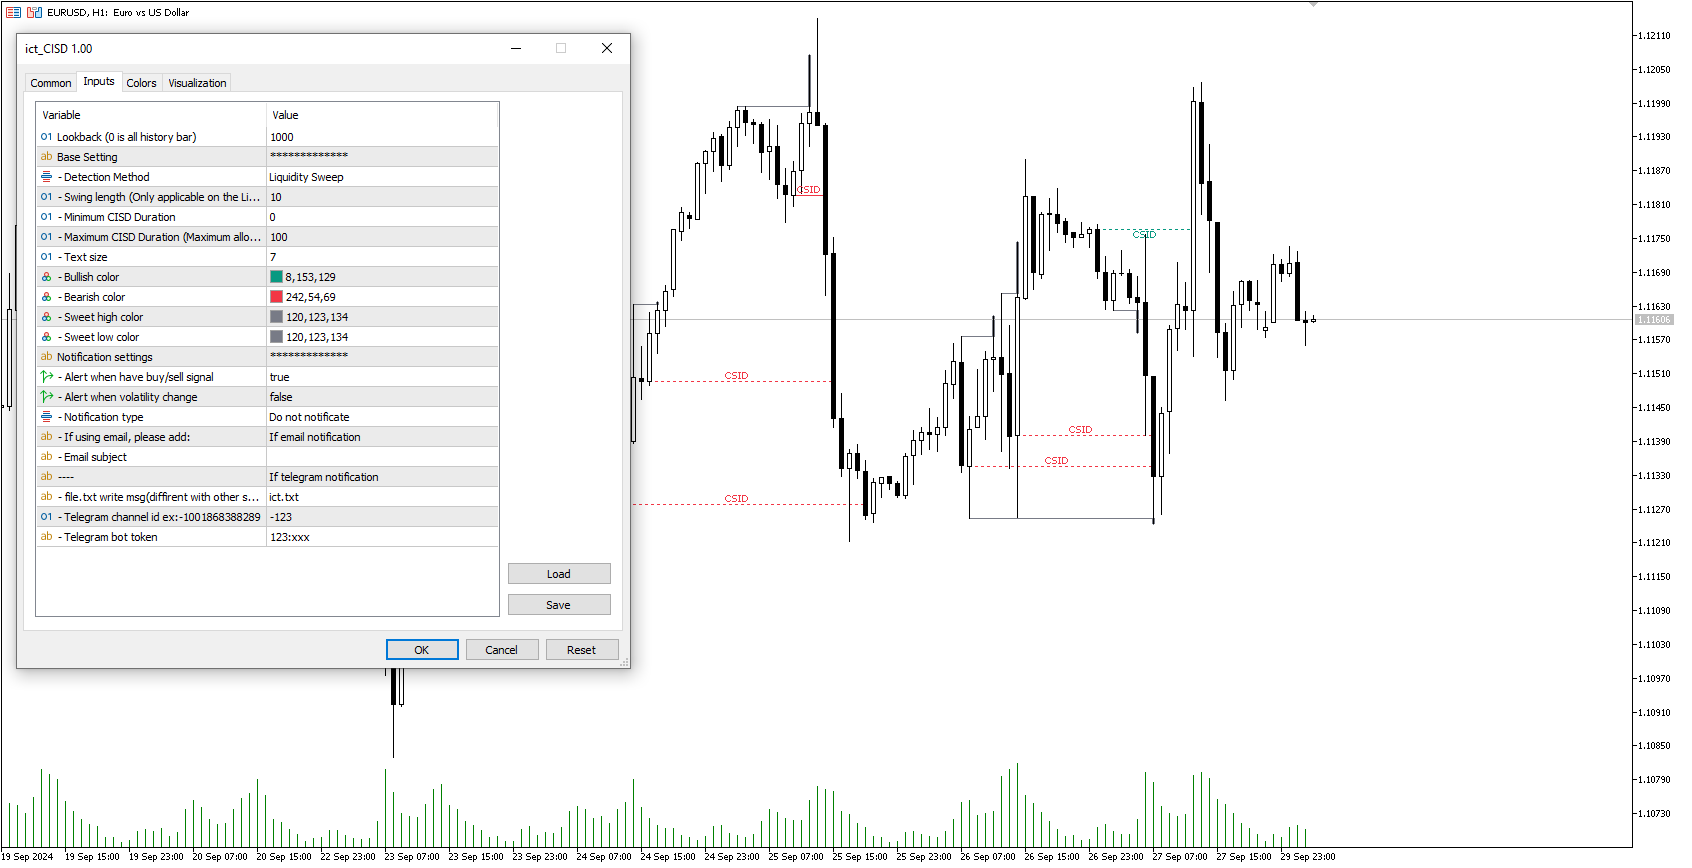
🔶 SETTINGS
- Detection Method: Classic or Liquidity Sweep
- Swing Length: Period used for the swing detection, with higher values returning longer-term Swing Levels.
- Minimum CISD Duration: The minimum length of the CISD line
- Maximum Swing Validity: The maximum length of the CISD line; potential CISD lines that aren't broken are deleted when exceeding the limit.
- Notification settings