• Genel bakış
  • İncelemeler
  • Yorumlar

Dashboard MACD Stochastic

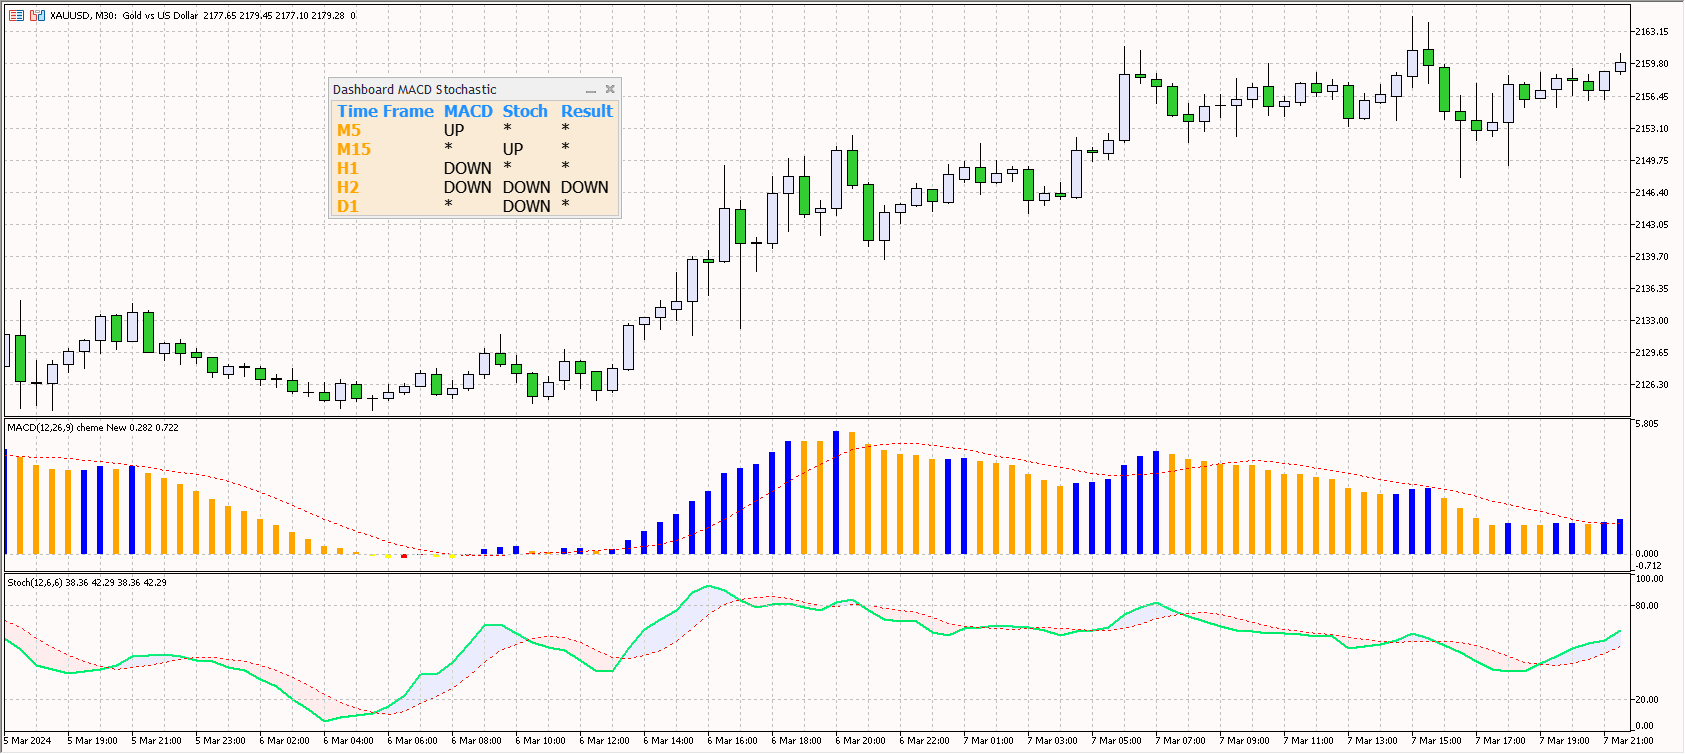
Kontrol paneli iki göstergenin okumalarını tarar: 'MACD' ve 'Stokastik'. Sinyalleri üç sütunda görüntüler: MACD için, Stokastik için ve sonuç sütunu (sinyal her iki gösterge için de aynıysa).

Tarama bir veya daha fazla zaman diliminde seçilebilir. Tüm zaman aralıklarını devre dışı bırakırsanız kontrol paneli yine de yüklenir, ancak bu tür durumlara özel ayarlar bulunur.

Sinyaller her zaman göstergenin sıfır çubuğu (sıfır çubuğu grafikte en sağdaki çubuktur) açısından kontrol edilir.

Parametrelerin açıklaması.

  • "Zaman dilimleri" - taramanın gerçekleştirileceği zaman dilimlerini seçin.
  • "MACD" ve "Stokastik" göstergelere ilişkin parametrelerdir. Göstergelerin parametreleri her zaman dilimi için aynıdır.
  • "Tablo" - tablonun renklerini ayarlar: Tablo arka planı, Tablo başlığı rengi ve Tablonun ilk sütun rengi.

Sinyallerin açıklaması.

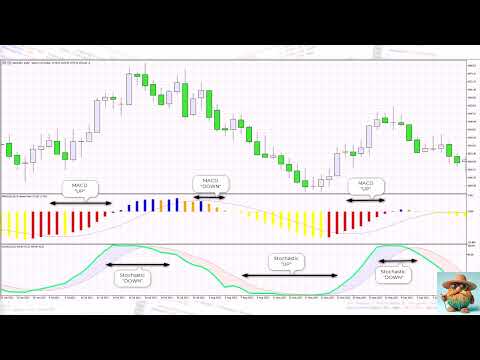
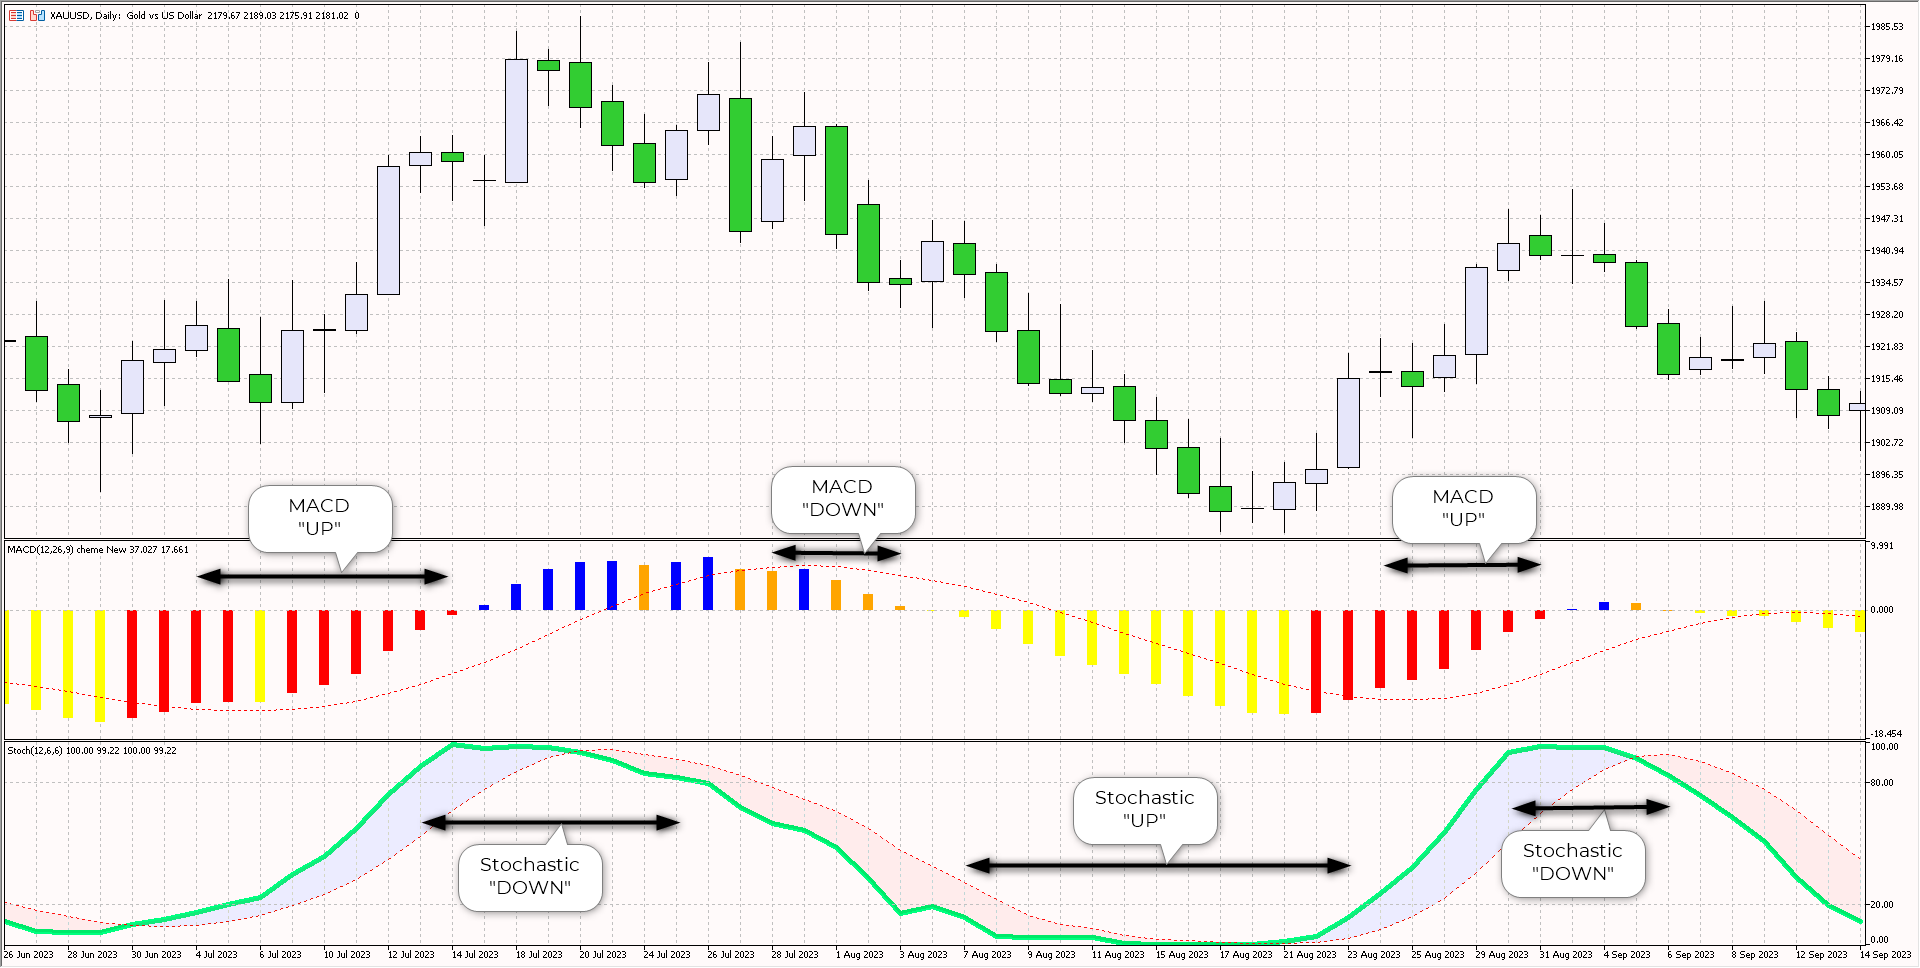
MACD için UP sinyali, hem Ana çizginin hem de Sinyal çizgisinin sıfırın altında olması ve Ana çizginin Sinyal çizgisinin üzerinde olması durumunda oluşur. "AŞAĞI" sinyali bunun tersidir.

'Stokastik' için çizgi '20'nin altındaysa 'YUKARI' sinyali, çizgi '80'in üzerindeyse 'AŞAĞI' sinyali oluşuyor.

Her iki göstergenin sinyali aynıysa, bu sinyal sonuç sütununda görüntülenecektir. Sinyaller farklıysa, sonuçta ortaya çıkan bir sinyal olmayacaktır.


Önerilen ürünler
DYJ süper eğilim dalgaları çok kesin bir dalga ve dalga ticareti sistemidir Bu işaretçi piyasadan çıktığında mum hattının en yüksek ve en düşük noktasını arar Giriş fiyatı en yüksek veya en düşük noktaya yakın Sinyal uyarı türü dyj supertrend'e eklendi Çok boyutlu bir sinyal oluşturduğunuzda Aşağıdaki türden uyarı sinyalleri kullanılabilir: Alert mailSend, MobilePush Receive Input InpSignalPeriod = 10 BarDistance = 24 InpIsAlert = true
MACDivergence MTF MT5
Pavel Zamoshnikov
4.17 (6)
Advanced ideas of the popular MACD indicator: It detects and displays classic and reverse divergences (two methods of detecting divergences). It uses different color to highlight an uptrend and a downtrend. Two methods of determining a trend: а) MACD crosses the 0 level (classic signal); б) MACD crosses its own average (early signal). This is a multi-timeframe indicator: it can display MACD data from other timeframes. Two methods of drawing: classic histogram and line. It generates sound and vis
Pattern DejaVu
Andriy Konovalov
1 (1)
This indicator predicts the nearest bars of the chart based on the search of up to three best coincided patterns (a sequence of bars of a given length) in the history of the current instrument of the current timeframe. The found patterns are aligned with the current pattern at the   opening price   of the current (last) bar. The predicted bars are bars following immediately for patterns found in history. Pattern search is performed once every time a new bar of the current timeframe opens. The i
Технический индикатор "Reversal patterns" является математической интерпретацией классических разворотных паттернов: Pin Bar, Harami и Engulfing. То есть «Разворотного бара», «Харами» и «Поглощения». Данный индикатор позволяет определить момент разворота котировок на основе рыночной динамики и победителя между «быками» и «медведями».  Индикатор отображает момент разворота на локальных максимумах и минимумах графика любого таймфрейма, что позволяет повысить точность сигнала. Также индикатор имеет
Introducing the Consecutive Green/Red Candle Alert Indicator for MT5 - Your Trend Spotting Companion! Are you ready to take your trading to the next level? We present the Consecutive Green/Red Candle Alert Indicator, a powerful tool designed to help you spot trends and potential reversals with ease. Whether you're a new trader looking for clarity in the market or an experienced pro seeking additional confirmation, this indicator is your trusted companion. Key Features of the Consecutive Gre
PZ Trend Trading MT5
PZ TRADING SLU
3.67 (3)
Trend Trading is an indicator designed to profit as much as possible from trends taking place in the market, by timing pullbacks and breakouts. It finds trading opportunities by analyzing what the price is doing during established trends. [ Installation Guide | Update Guide | Troubleshooting | FAQ | All Products ] Trade financial markets with confidence and efficiency Profit from established trends without getting whipsawed Recognize profitable pullbacks, breakouts and early reversals The ind
Buy CTS scalping indicator, provide buying and selling signals, automatic channeling and sending signals to mobile phones Using technical analysis and price action methods and modern methods, CTS indicator can draw price channels and recognize price trends with high accuracy and issue entry and exit signals according to them. Traders can easily fluctuate using this indicator in different time frames and in different markets. With the CTS indicator, you can signal in different ways. This indicat
Wolfe Wave Scanner MT5
Reza Aghajanpour
5 (3)
**  All Symbols  x  All Timeframes  scan just by pressing scanner button ** *** Contact me after the purchase to send you instructions and add you in "Wolfe Wave Scanner group" for sharing or seeing experiences with other users. Introduction: A Wolfe Wave is created with five-wave patterns in price. It shows supply and demand and a fight towards a balance price. T hese waves of price actions can help traders identify the boundaries of   the trend . Also  It helps forecast how the price will mo
Schaff Trend Cycle STC
Mohammad Taher Halimi Tabrizi
The Schaff Trend Cycle indicator is the product of combining Slow Stochastics and the moving average convergence/divergence (MACD). The MACD has a reputation as a trend indicator, but it's also notorious for lagging due to its slow responsive signal line. The improved signal line gives the STC its relevance as an early warning sign to detect currency trends. this indicator is converted from Trading View code of STC Indicator - A Better MACD [SHK]
The standard Bollinger Bands indicator has been improved by integrating additional indications from the Standard Deviation indicator (StdDev), which gives an additional filter for confirming trading signals. In addition, the color of the indicator's lines shows the beginning of a trend, its development and exhaustion. This indicator has a signal block that notifies the trader of the beginning of the trend on any time frame to which it is attached. Settings Type of messages - select the type of
Was: $249  Now: $99   Market Profile defines a number of day types that can help the trader to determine market behaviour. A key feature is the Value Area, representing the range of price action where 70% of trading took place. Understanding the Value Area can give traders valuable insight into market direction and establish the higher odds trade. It is an excellent addition to any system you may be using. Inspired by Jim Dalton’s book “Mind Over Markets”, this indicator is designed to suit the
Pirates MACD
Jefferson Judge Metha
The Pirates MACD is a Momentum Indicator that shows us not just the Classical MACD, it also shows us high priority trades. the user has an option of selecting among several options the best settings that suits their trading style, even if one has no trading style, Pirates always find a way to survive hence the Pirates MACD is equipped with easy to understand tools. that reduce the strain on ones analysis giving them visual advantages over classical MACD techniques.  This product is made as an
Bu indikatör, her sipariş için önceden belirlediğiniz TP ve SL Değerlerini (o para biriminde) grafiklerde (işlem/sipariş satırına kapalı) gösterecek ve her sipariş için kar ve zararınızı tahmin etmenize çok yardımcı olacaktır. Ayrıca size PIP değerlerini de gösterir. gösterilen format "Kâr veya Zararımızın Döviz Değerleri / PIP değerlerimiz" şeklindedir. TP Değeri Yeşil Renkte ve SL Değeri Kırmızı Renkte gösterilecektir. Herhangi bir sorunuz veya daha fazla bilgi için lütfen fxlife.asia@hotma
Noize Absorption Index - is the manual trading system that measures the difference of pressure between bears forces and bulls forces. Green line - is a noize free index that showing curent situation. Zero value of index shows totally choppy/flat market.Values above zero level shows how powerfull bullish wave is and values below zero measures bearish forces.Up arrow appears on bearish market when it's ready to reverse, dn arrow appears on weak bullish market, as a result of reverse expectation.
MACD Colored ZeroLag
Farzin Sadeghi Bonjar
4.14 (7)
It is the MQL5 version of zero lag MACD that was available for MT4 here: https://www.mql5.com/en/code/9993 Also there was a colored version of it here but it had some problems: https://www.mql5.com/en/code/8703 I fixed the MT4 version which has 95 lines of code. It took me 5 days to write the MT5 version.(reading the logs and testing multiple times and finding out the difference of MT5 and MT4!) My first MQL5 version of this indicator had 400 lines of code but I optimized my own code again and n
FREE
Bear Bull
Ignacio Agustin Mene Franco
Bear Bull! It is an indicator that marks with Heikin Ashi candles but modified, the sales and purchases long and short trend! with 2 colors green marks the purchase, purple marks the sale, works for any type of temporality, works for forex markets and synthetic indices! ideal for any pair, it also works for crypto pairs, Good profit! World Investor - World Inversor - 
Infinity'nin para birimlerinin gücünü ölçen bu yenilikçi gösterge, scalper'lar ve uzun vadeli ticaret yapan tüccarlar için vazgeçilmez bir yardımcıdır. Para birimlerinin Güç / zayıflık analiz sistemi uzun zamandır bilinmektedir ve dünyanın önde gelen tüccarları tarafından piyasada kullanılmaktadır. Herhangi bir arbitraj ticareti bu analiz olmadan tamamlanamaz. Göstergemiz, temel para birimlerinin birbirine göre gücünü kolayca belirler. Tüm para birimlerinde veya mevcut para birimlerinde çizgi g
Atomic Analyst MT5
Issam Kassas
4.82 (11)
Öncelikle belirtmek gerekir ki bu Ticaret Göstergesi Yeniden Çizim Yapmaz, Gecikmez ve Gecikme Göstermez, bu da hem manuel hem de robot ticareti için ideal hale getirir. Atom Analisti, Piyasada Daha İyi Bir Avantaj Bulmak İçin Fiyatın Gücünü ve Momentumunu Kullanan PA Fiyat Hareketi Göstergesidir. Gürültüleri ve Yanlış Sinyalleri Kaldırmaya ve Ticaret Potansiyelini Artırmaya Yardımcı Olan Gelişmiş Filtrelerle Donatılmıştır. Birden fazla katmanlı karmaşık göstergeler kullanarak, Atom Analisti
Your Trend Friend
Luigi Nunes Labigalini
The trend is your friend! Look at the color of the indicator and trade on that direction. It does not  repaint. After each candle is closed, that's the color of the trend. You can focus on shorter faster trends or major trends, just test what's most suitable for the symbol and timeframe you trade. Simply change the "Length" parameter and the indicator will automatically adapt. You can also change the color, thickness and style of the lines. Download and give it a try! There are big movements
40% off. Original price: $50 ATR Scanner Pro is a multi symbol multi timeframe volatility scanner that monitors and analyzes Average True Range indicator value in up to 28 symbols and 9 timeframes   in 3 modes : ATR value:   As a volatility dashboard it shows the ATR indicator value in all pairs and timeframes and signals when the ATR value reaches a maximum or minimum in a given duration. Short term ATR/Long term ATR ratio:  It shows ratio of 2 ATRs with different periods. It's useful in detec
The best time to trade Using this Indicator is when the time reach exactly hour,half,45 minutes,15 minutes and sometimes 5 minutes.. This indicators is helpful to those who trade boom and crash indecies.How to read this indicator first you'll see Blue allow and Red allow all these allows used to indicate or to detect the spike which will happen so the allow happens soon before the spike happen.This indicator works properly only in boom and crash trading thing which you have to consider when
Trading Utility for Forex Currency Pairs Only not for Gold  Functions Auto Lot Calculation based on Risk Auto stoploss  Auto TakeProfit Breakeven Auto Close Half % Close in percentage with respect to the PIPs Pending Orders BuyLimit Sell Limit with distances BuyStop Sell Stop    with distances Trading Informations Risk in percentage For Multiple trades Combine Takeprofit and Combine Stoplosses
This scanner shows the trend values of the well known indicator SuperTrend for up to 15 instruments and 21 time frames. You can get alerts via MT5, Email and Push-Notification as soon as the direction of the trend changes. Important Information You have many possibilities to use the scanner. Here are two examples: With this scanner you can trade a top-down approach easily. If two higher time frames e.g. W1 and D1 are already showing green values (upward trend) but the H12 time frame shows a re
Description ABC Trend Detector Pro  is an indicator that identifies impulses and trends in the market and displays their presence on the price chart. Found patterns are drawn as colored connecting lines between their highs and lows. Above / below each extreme, the value of the range (the number of pips) of the trend is displayed. Recommendations You can use this indicator to determine the trend and, accordingly, to determine the direction of opening a position or closing an opposite posit
Do you believe that financial markets and celestial bodies operate in separate realms? Our indicator begs to differ! Based on the innovative theory of William Gann, which emphasizes the influence of celestial planet movements on financial market dynamics, we present to you the "Gann Planetary Lines Indicator". Features of the Indicator : Precision : Accurate projection of the 360 degrees of planetary orbits onto price charts. Advanced Customization : Ability to display or hide any planet line,
Double Correlation indicator (free) plots two windowed correlations in a separate window.  the size of window is taken as input before the two symbols to correlate to. Two symbols are taken as an input parameters as well as period length. and the two correlations are computed with the currently shown symbol ex: input GBPJPY and AUDNZD.  current symbol EURUSD then the following will be computed corr(EURUSD,GBPJPY) and corr(EURUSD,AUDNZD) The indicator can be useful to run a multi-symbol pair trad
FREE
UturnAnalysis
Vasilii Luchnikov
Good afternoon. UturnAnalysis - to check the quality of the indicator WE HAVE LAUNCHED A TRIAL VERSION free distribution of signals about reversals based on this indicator for the futures and stock markets of the MICEX write to tech support, me 777basil@mail.ru , or in the comments your email address and we will send you the account details where the alerts are sent, for free. https://youtu.be/q228LvLec-Y we put it on several tools at once https://youtu.be/Wr7N2WEY8lA will save you time a
Divergence indicator 10 different indicators. Finding and displaying classic and hidden divergences. Indicators in which divergences are searched: MACD MACD Histogram; RSI; Stochastic; CCI; momentum; OBV; VWmacd; Chaikin Money Flow; Money Flow Index. This is a replica of the indicator from the   tradingview   resource, adapted for the MT5 terminal. MT4 version available here:  https://www.mql5.com/en/market/product/87846 Settings: Bars in history for analysis - number of bars for analysis
Premium seviye, %80'den fazla doğru tahmin doğruluğuna sahip benzersiz bir göstergedir! Bu gösterge en iyi Ticaret Uzmanları tarafından iki aydan uzun süredir test edilmiştir! Yazarın göstergesini başka hiçbir yerde bulamazsınız! Ekran görüntülerinden bu aracın doğruluğunu kendiniz görebilirsiniz! 1, sona erme süresi 1 mum olan ikili opsiyon ticareti için harikadır. 2 tüm döviz çiftleri, hisse senetleri, emtialar, kripto para birimleri üzerinde çalışır Talimatlar: Kırmızı ok görün
How to use Pair Trading Station Pair Trading Station is recommended for H1 time frame and you can use it for any currency pairs. To generate buy and sell signal, follow few steps below to apply Pair Trading Station to your MetaTrader terminal. When you load Pair Trading Station on your chart, Pair Trading station will assess available historical data in your MetaTrader platforms for each currency pair. On your chart, the amount of historical data available will be displayed for each currency pai
Bu ürünün alıcıları ayrıca şunları da satın alıyor
Öncelikle, bu Ticaret Sistemi'nin Non-Repainting, Non-Redrawing ve Non-Lagging Göstergesi olduğunu vurgulamak önemlidir, bu da hem manuel hem de robot ticareti için ideal hale getirir. "Smart Trend Trading System MT5", yeni ve deneyimli tüccarlar için özelleştirilmiş kapsamlı bir ticaret çözümüdür. 10'dan fazla premium göstergeyi birleştiriyor ve 7'den fazla sağlam ticaret stratejisi sunuyor, bu da çeşitli piyasa koşulları için esnek bir seçim yapar. Trend Takip Stratejisi: Trendleri etkili bir
FX Volume MT5
Daniel Stein
4.94 (17)
Sabah Brifingimiz aracılığıyla ayrıntılar ve ekran görüntüleri ile günlük piyasa güncellemenizi alın burada mql5 ve on Telegram ! FX Volume, bir brokerin bakış açısından piyasa duyarlılığı hakkında GERÇEK bir fikir veren İLK ve TEK hacim göstergesidir. COT raporlarından çok daha hızlı bir şekilde, brokerlar gibi kurumsal piyasa katılımcılarının Forex piyasasında nasıl konumlandıklarına dair harika bilgiler sağlar. Bu bilgileri doğrudan grafiğinizde görmek, ticaretiniz için gerçek oyun değiştir
Quantum Trend Sniper
Bogdan Ion Puscasu
5 (37)
Tanıtım       Kuantum Trend Keskin Nişancı Göstergesi   , trend tersine dönmeleri belirleme ve ticaret yapma şeklinizi değiştiren çığır açan MQL5 Göstergesi! 13 yılı aşkın ticaret tecrübesine sahip deneyimli tüccarlardan oluşan bir ekip tarafından geliştirilmiştir.       Kuantum Trend Keskin Nişancı Göstergesi       trend dönüşlerini son derece yüksek doğrulukla belirlemenin yenilikçi yolu ile ticaret yolculuğunuzu yeni zirvelere taşımak için tasarlanmıştır. ***Kuantum Trend Keskin Nişancı Gö
Trend Screener Pro MT5
STE S.S.COMPANY
4.89 (61)
Trend Göstergesi, Trend Alım Satım ve Filtreleme için Çığır Açan Benzersiz Çözüm, Tüm Önemli Trend Özellikleriyle Tek Bir Araç İçinde Yerleştirildi! Forex, emtialar, kripto para birimleri, endeksler ve hisse senetleri gibi tüm sembollerde/araçlarda kullanılabilen %100 yeniden boyamayan çoklu zaman çerçevesi ve Çoklu para birimi göstergesidir. Trend Screener, grafikte noktalarla ok trend sinyalleri sağlayan etkili bir trend trend göstergesidir. Trend analizörü göstergesinde bulunan özellikler: 1.
Gold Stuff mt5
Vasiliy Strukov
4.89 (166)
Gold Stuff mt5, özellikle altın için tasarlanmış bir trend göstergesidir ve herhangi bir finansal enstrümanda da kullanılabilir. Gösterge yeniden çizilmez ve gecikmez. Önerilen zaman dilimi H1. Ayarları ve kişisel bir bonusu almak için satın alma işleminden hemen sonra benimle iletişime geçin!   AYARLAR Ok Çiz - açık kapalı. grafik üzerinde oklar çizmek. Uyarılar - sesli uyarılar kapalı. E-posta bildirimi - açık kapalı. E-posta Bildirimleri. Puch bildirimi - açık kapalı. Push bildirimleri
Öncelikle, bu Ticaret Aracının Non-Repainting, Non-Redrawing ve Non-Lagging Gösterge olduğunu vurgulamakta fayda var, bu da onu profesyonel ticaret için ideal hale getiriyor. Akıllı Fiyat Hareketi Kavramları Göstergesi, hem yeni hem de deneyimli tüccarlar için çok güçlü bir araçtır. İleri ticaret fikirlerini, Inner Circle Trader Analizi ve Smart Money Concepts Ticaret Stratejileri gibi 20'den fazla kullanışlı göstergeyi bir araya getirerek bir araya getirir. Bu gösterge, büyük kurumların tica
Top indicator for MT5   providing accurate signals to enter a trade without repainting! It can be applied to any financial assets:   forex, cryptocurrencies, metals, stocks, indices .  Watch  the video  (6:22) with an example of processing only one signal that paid off the indicator! MT4 version is here It will provide pretty accurate trading signals and tell you when it's best to open a trade and close it. Most traders improve their trading results during the first trading week with the help of
FX Power MT5 NG
Daniel Stein
5 (4)
Sabah Brifingimiz burada mql5 ve on Telegram! FX Power MT5 NG , uzun zamandır çok popüler olan döviz gücü ölçerimiz FX Power'ın yeni neslidir. Peki bu yeni nesil güç ölçer ne sunuyor? Orijinal FX Power hakkında sevdiğiniz her şey PLUS GOLD/XAU güç analizi Daha da hassas hesaplama sonuçları Ayrı ayrı yapılandırılabilir analiz dönemleri Daha da iyi performans için özelleştirilebilir hesaplama limiti Özel çokluDaha fazlasını görmek isteyenler için örnek ayarlar Her grafikte en sevdiğiniz renkler i
RelicusRoad Pro MT5
Relicus LLC
4.82 (22)
Şimdi 147 $ (birkaç güncellemeden sonra 499 $ 'a yükseliyor) - Sınırsız Hesaplar (PC'ler veya Mac'ler) RelicusRoad Kullanım Kılavuzu + Eğitim Videoları + Özel Discord Grubuna Erişim + VIP Durumu PİYASAYA BAKMAK İÇİN YENİ BİR YOL RelicusRoad, forex, vadeli işlemler, kripto para birimleri, hisse senetleri ve endeksler için dünyanın en güçlü ticaret göstergesidir ve yatırımcılara kârlı kalmaları için ihtiyaç duydukları tüm bilgileri ve araçları sağlar. Başlangıç ​​seviyesinden ileri seviyey
Auto Order Block with break of structure based on ICT and Smart Money Concepts Futures Break of Structure ( BoS )             Order block ( OB )            Higher time frame Order block / Point of Interest ( POI )    shown on current chart           Fair value Gap ( FVG ) / Imbalance   ,  MTF      ( Multi Time Frame )    Volume Imbalance     ,  MTF          vIMB Gap’s Equal High / Low’s     ,  MTF             EQH / EQL Liquidity               Current Day High / Low           HOD /
XQ Indicator MetaTrader 5
Marzena Maria Szmit
5 (1)
Step into the realm of Forex trading with confidence and precision using XQ, a cutting-edge Forex indicator designed to elevate your trading game to unprecedented heights. Whether you're a seasoned trader or just stepping into the world of currency exchange, XQ Forex Indicator empowers you with the insights and signals needed to make informed trading decisions. The signal conditions are a combination of three indicators, and XQ Forex Indicator only display  medium and long-term trends . The ind
Blahtech Supply Demand MT5
Blahtech Limited
4.57 (14)
Was: $299  Now: $99   Supply Demand uses previous price action to identify potential imbalances between buyers and sellers. The key is to identify the better odds zones, not just the untouched ones. Blahtech Supply Demand indicator delivers functionality previously unavailable on any trading platform. This 4-in-1 indicator not only highlights the higher probability zones using a multi-criteria strength engine, but also combines it with multi-timeframe trend analysis, previously confirmed swings
Advanced Supply Demand MT5
Bernhard Schweigert
4.53 (15)
Herhangi bir Acemi veya Uzman Tüccar için En İyi Çözüm! Bu gösterge benzersiz, yüksek kaliteli ve uygun fiyatlı bir ticaret aracıdır çünkü bir dizi tescilli özelliği ve yeni bir formülü bir araya getirdik. Bu güncelleme ile çift zaman dilimi dilimlerini gösterebileceksiniz. Yalnızca daha yüksek bir TF gösteremeyeceksiniz, aynı zamanda TF grafiğini ve ARTIK daha yüksek TF'yi de gösterebileceksiniz: YUVARLAK BÖLGELERİ GÖSTERMEK. Tüm Arz Talebi tüccarları buna bayılacak. :) Önemli Bilgiler Açıkland
ICT, SMC, SMART MONEY CONCEPTS, SMART MONEY, Smart Money Concept, Support and Resistance, Trend Analysis, Price Action, Market Structure, Order Blocks, BOS/CHoCH,   Breaker Blocks ,  Momentum Shift,   Supply&Demand Zone/Order Blocks , Strong Imbalance,   HH/LL/HL/LH,    Fair Value Gap, FVG,  Premium  &   Discount   Zones, Fibonacci Retracement, OTE, Buy Side Liquidity, Sell Side Liquidity, BSL/SSL Taken, Equal Highs & Lows, MTF Dashboard, Multiple Time Frame, BigBar, HTF OB, HTF Market Structure
Gann Kare Göstergesi, W.D. Gann tarafından yazılan "Piyasa Tahminleri için Matematiksel Formül" makalesine dayalı güçlü bir piyasa analizi aracıdır. Bu araç, piyasa analizi için matematiksel ve Gann teorilerini kullanarak hassas analizler gerçekleştirir. 144, 90, 52 karelerini ve ayrıca 9 karesini kullanır. Ayrıca, ın 9 karesi ve bu kareyle ilişkili kanallar ve yıldız modelleri için yöntemini içerir. Kullanıcı Kılavuzu ve Uygulama: Bu göstergeleri kullanmadan önce, kullanıcı kılavuzunu okumanız
AW Trend Predictor MT5
AW Trading Software Limited
4.76 (54)
Tek bir sistemde trend ve kırılma seviyelerinin kombinasyonu. Gelişmiş bir gösterge algoritması piyasa gürültüsünü filtreler, trendi, giriş noktalarını ve olası çıkış seviyelerini belirler. Gösterge sinyalleri, sinyal geçmişinin etkinliğini gösteren en uygun enstrümanların seçilmesine izin veren bir istatistiksel modüle kaydedilir. Gösterge Kâr Al ve Zararı Durdur işaretlerini hesaplar. Kılavuz ve talimatlar ->   BURAYA   / MT4 versiyonu ->   BURAYA Gösterge ile nasıl ticaret yapılır: Trend Pre
Fiyat tersine döndükçe ve geri çekildikçe piyasa yapısından elde edilen kâr değişir. Piyasa yapısını tersine çevirme uyarısı göstergesi, bir trendin veya fiyat hareketinin ne zaman tükenmeye yaklaştığını ve tersine dönmeye hazır olduğunu tanımlar. Genellikle bir geri dönüş veya büyük bir geri çekilme meydana gelmek üzereyken meydana gelen piyasa yapısındaki değişiklikler konusunda sizi uyarır. Gösterge, olası bir tükenme noktasının yakınında her yeni yüksek veya düşük oluştuğunda, başlangıçta
The Volume by Price Indicator for MetaTrader 5 features Volume Profile and Market Profile TPO (Time Price Opportunity). Get valuable insights out of currencies, equities and commodities data. Gain an edge trading financial markets. Volume and TPO histogram bar and line charts. Volume Footprint charts. TPO letter and block marker charts including split structures. Versatile segmentation and compositing methods. Static, dynamic and flexible ranges with relative and/or absolute visualizations. Lay
Tanıtım       Quantum Breakout PRO   , Breakout Bölgeleri ile ticaret yapma şeklinizi değiştiren çığır açan MQL5 Göstergesi! 13 yılı aşkın ticaret tecrübesine sahip deneyimli tüccarlardan oluşan bir ekip tarafından geliştirilmiştir.       Kuantum Breakout PRO       yenilikçi ve dinamik koparma bölgesi stratejisiyle ticaret yolculuğunuzu yeni zirvelere taşımak için tasarlanmıştır. Kuantum Breakout Göstergesi, size 5 kar hedefi bölgesi ile kırılma bölgelerinde sinyal okları ve kırılma kutusuna
TrendLine PRO MT5
Evgenii Aksenov
4.78 (49)
The Trend Line PRO indicator is an independent trading strategy. It shows the trend change, the entry point to the transaction, as well as automatically calculates three levels of Take Profit and Stop Loss protection Trend Line PRO is perfect for all Meta Trader symbols: currencies, metals, cryptocurrencies, stocks and indices Advantages of Trend Line PRO Never redraws its signals The possibility of using it as an independent strategy It has three automatic levels Take Profit and Stop Loss lev
Owl Smart Levels MT5
Sergey Ermolov
4.47 (36)
MT4 versiyonu  |  FAQ Owl Smart Levels Indicator , Bill Williams'ın gelişmiş fraktalları , piyasanın doğru dalga yapısını oluşturan Valable ZigZag ve kesin giriş seviyelerini gösteren Fibonacci seviyeleri gibi popüler piyasa analiz araçlarını içeren tek gösterge içinde eksiksiz bir ticaret sistemidir. pazara ve kar elde edilecek yerlere. Stratejinin ayrıntılı açıklaması Gösterge ile çalışma talimatı Baykuş Yardımcısı ticaretinde Danışman Yardımcısı Kullanıcıların özel sohbeti -> Satın aldıktan
Gartley Hunter Multi
Siarhei Vashchylka
5 (5)
Gartley Hunter Multi - An indicator for searching for harmonic patterns simultaneously on dozens of trading instruments and on all classic timeframes: (m1, m5, m15, m30, H1, H4, D1, Wk, Mn). Manual (Be sure to read before purchasing) | Version for MT4 Advantages 1. Patterns: Gartley, Butterfly, Shark, Crab. Bat, Alternate Bat, Deep Crab, Cypher 2. Simultaneous search for patterns on dozens of trading instruments and on all classic timeframes 3. Search for patterns of all possible sizes. Fr
Trend Line Map Pro MT5
STE S.S.COMPANY
4.67 (9)
Trend Line Map indicator is an addons for   Trend Screener Indicator . It's working as a scanner for all signals generated by Trend screener ( Trend Line Signals ) . It's a Trend Line Scanner based on Trend Screener Indicator.  If you don't have Trend Screener Pro Indicator,   the Trend Line Map Pro will not work.     LIMITED TIME OFFER : Trend Line Map Indicator is available for only 50 $ and lifetime. ( Original price 125$ ) By accessing to our MQL5 Blog,  you can find all our premium indica
TrendDecoder Premium MT5
Christophe, Pa Trouillas
5 (1)
Aralıkları ve bir sonraki olası hamleleri belirleyin     |    Trendlerin en erken sinyallerini ve gücünü alın     |    Geri dönüşten önce net çıkışlar alın     |    Fiyatın test edeceği Fibo seviyelerini tespit edin   |  Gecikmesiz, takip edilmeyen gösterge - manuel ve otomatik ticaret için ideal - tüm varlıklar ve tüm zaman birimleri için uygun 50 İNDİRİM   - lansman için sonra tekrar   >>   149 $ Satın aldıktan sonra, kişiselleştirilmiş ayarlar için   bu kanaldan benimle iletişime geçin . MT4
MetaBands M5
Vahidreza Heidar Gholami
4.67 (3)
MetaBands uses powerful and unique algorithms to draw channels and detect trends so that it can provide traders with potential points for entering and exiting trades. It’s a channel indicator plus a powerful trend indicator. It includes different types of channels which can be merged to create new channels simply by using the input parameters. MetaBands uses all types of alerts to notify users about market events. Features Supports most of the channel algorithms Powerful trend detection algorith
TPSpro TRENDPRO  - is a trend indicator that automatically analyzes the market and provides information about the trend and each of its changes, as well as giving signals for entering trades without redrawing! The indicator uses each candle, analyzing them separately. referring to different impulses - up or down impulse. Exact entry points into transactions for currencies, crypto, metals, stocks, indices!  -  Version MT4                  DETAILED DESCRIPTION        /       TRADING SETUPS       
Grafiğinizde otomatik olarak destek ve direnç seviyeleri PLUS itici mum boşlukları çizin, böylece fiyatın nereye gidebileceğini ve / veya potansiyel olarak tersine dönebileceğini görebilirsiniz. Bu gösterge, web sitemde (The Market Structure Trader) öğretilen pozisyon ticareti metodolojisinin bir parçası olarak kullanılmak üzere tasarlanmıştır ve hedefleme ve potansiyel girişler için temel bilgileri görüntüler. MT4 Version:  https://www.mql5.com/en/market/product/97246/ Göstergede 2 TEMEL öze
Golden Spikes Detector
Batsirayi L Marango
5 (1)
Golden Spikes Detector This indicator is based on an advanced strategy primarily for trading spikes on Boom and Crash Indices. Complex algorithms were implemented to detect high probability entries only. It alerts on potential Buy and Sell entries. To trade spikes on the Deriv or Binary broker, only take Buy Boom and Sell Cash alerts. It was optimised to be loaded on 5-minute timeframe although multiple timeframe analysis is done in the background. Features ·             Desktop pop up and sound
IX Power MT5
Daniel Stein
5 (2)
IX Power   nihayet FX Power'ın rakipsiz hassasiyetini Forex dışı sembollere getiriyor. En sevdiğiniz endeksler, hisse senetleri, emtialar, ETF'ler ve hatta kripto para birimlerindeki kısa, orta ve uzun vadeli eğilimlerin yoğunluğunu doğru bir şekilde belirler. Terminalinizin sunduğu   her şeyi analiz   edebilirsiniz. Deneyin ve işlem yaparken   zamanlamanızın   nasıl   önemli ölçüde iyileştiğini   deneyimleyin. IX Power Temel Özellikler 100 hassas, yeniden boyanmayan hesaplama sonuçları -
Strong Support mt5
Vasiliy Strukov
5 (9)
Destek ve direnç seviyeleri eski zamanlardan beri piyasayı analiz etmek için en güçlü araç olmuştur. Güçlü Destek göstergesi, destek seviyelerini yerel fiyat düşüklerine ve direnç seviyelerini yerel fiyat yükseklerine göre oluşturur.  Diğer gelişimlerim burada görülebilir Örneğin, Gold Stuff gibi bir eğilim göstergesiyle birlikte kullanılması önerilir; bu, trend üzerinde işlem yapmanıza ve aynı zamanda konsolidasyon veya eğilim tersine çevrilme bölgelerini belirlemenize ve destek ve direnç
Yazarın diğer ürünleri
Trend ticaret stratejisi "Süper Trend Esnek Uyarısı EA", aynı adı taşıyan "Süper Trend Esnek Uyarısı" göstergesi üzerine inşa edilmiştir. Danışman göstergedeki tüm bilgileri kullanır, dolayısıyla danışmanın yalnızca üç parametresi vardır, bunlar: "Çalışma zaman dilimi" - çalışma zaman dilimini, göstergenin oluşturulduğu zaman dilimini ve ayrıca "OHLC" verilerinin alındığı zaman dilimini belirtir. "Zararı Durdur", "puan" cinsinden ölçülen zararı durdurmanın sabit boyutudur ("Artı, Ctrl+F" aracın
Tanım: "Piyasa Yapısı HH HL LH LL" göstergesi, finansal piyasalardaki fiyat dinamiklerini analiz etmek için güçlü ve aynı zamanda basit bir araçtır. Bu gösterge, yatırımcıların ve yatırımcıların trendlerdeki değişiklikleri tespit etmelerine ve fiyat zaman serilerindeki önemli noktaları tespit etmelerine yardımcı olur. Göstergenin temel bileşenleri: HH (Yüksek Yüksek): Fiyatın bir önceki yüksek tepenin üzerinde kapandığı tepe. HH güçlenen bir yükseliş trendine işaret ediyor. HL (Yüksek Düş
Trend göstergesi "   Süper Trend Esnek Uyarısı   " minimum ayara sahiptir. Bu gösterge, kullanımı mümkün olduğunca kolay olacak şekilde tasarlanmıştır. Gösterge, ana renkli bir çizgiyle eğilimi gösterir ("Veri Pencereleri" penceresinde görebileceğiniz ("SuperTrend" satırı). Ayrıca, trendin değiştiği yerlerde, gösterge renkli okları gösterir ( "Veri Pencereleri" penceresinde görebileceğiniz   "STBuy" ve "   STSell" simgeleri       ). Trendin değiştiği yerlerde, gösterge bir sinyal vermez: bir ses
Gösterge yükseliş ve düşüş eğilimi gösteriyor. Göstergenin kendisi (normal stokastik gibi) bir alt pencerede görüntülenir. Grafik arayüzü   : Ana pencerede, "Düşük" fiyattan "Düşük" fiyata (yükseliş farklılığı için) ve "Yüksek" fiyattan "Yüksek" fiyata (düşüş eğilimi sapması için) kadar üretilen "trend çizgisi" grafik nesneleri oluşturulur. ). Gösterge, penceresinde yalnızca grafik tamponlarını kullanarak çizer: “Ana”, “Sinyal”, “Nokta”, “Al” ve “Satış”. "Al" ve "Satış" tamponları farklılık gös
'Supertrend MetaTrader 5' göstergesi, en basit trend ticaret sisteminin temelidir. Ve yine de çok etkili olmaya devam ediyor. Gösterge herhangi bir zaman diliminde çalışır (mevcut grafiğin zaman diliminde). Adından, bu göstergenin trendi takip ettiğini ve trend değiştiğinde göstergenin trendin değişme noktasını doğru bir şekilde gösterdiğini görebilirsiniz. 'Supertrend MetaTrader 5'in temeli, fiyat ve 'Average True Range göstergesi' değerlerinin bir çarpanla çarpılmasıdır (ayrıca 'ATR' yerine '
The Candle Length Indicator Alarm generates a sound alert, sends a push notification and an email when the size of the current candlestick changes. The size of the current candlestick can be measured in two ways: The first method: the size of the candlestick is measured from the beginning of the candlestick (from the OPEN price). The second method: the size of the candlestick is measured from current price. The indicator has the following settings: sound — a sound file from the folder: "...\Meta
The Buy Sell Color Background indicator changes the background color depending on position direction. It has three settings: Background color for BUY - background color for a Buy position Background color for SELL - background color for a Sell position Default background color - background color with no open position After you detach the indicator from a chart, its background color changes to Default background color .
The calculator of signals operates directly from the MetaTrader 5 terminal, which is a serious advantage, since the terminal provides a preliminary selection and sorts out signals. This way, users can see in the terminal only the signals that ensure a maximum compatibility with their trading accounts. The calculator of signals gives the answer to the one of the questions most frequently asked by users of the Signals service: "Will I be able to subscribe to the signal NNN, and what volume of the
Arrow Signal
Vladimir Karputov
Bu gösterge "Stokastik" kategorisine aittir. Gösterge kontrolünü mümkün olduğunca basitleştirmeye çalıştım, bu nedenle giriş parametrelerinde minimum ayarlar gösteriliyor: bu, sinyal okları için bir simge seçimidir. "Satın Al" sinyali '   Al Ok kodu   ' parametresi ile, "Sat" sinyali ise '   Ok Sat kodu   ' parametresi ile kodlanır. Sinyaller için sinyal ok kodları (lütfen 32 ile 255 arasındaki değerleri kullanın) Wingdings yazı tipinden alınmıştır. Gösterge her tik üzerinde çalışır ve mevcut çu
An Expert Advisor based on the custom indicator. Search for a signal at every tick. Positions are closed by an opposite signal. No trailing. There is no stop loss. There is no take profit. Has a minimum of settings Money management: Lot OR Risk   - type Money management The value for "Money management"   - Money management value Deviation   - admissible slippage Buy Arrow code   (font Wingdings) - character code from 'Wingdings' font for BUY signals Sell Arrow code   (font Wingdings) - characte
Ma Dema Alert
Vladimir Karputov
Gösterge üç çizgi görüntüler ve iki tür kavşağı izler. Göstergenin üç satırı: "   MA   " - yavaş gösterge "Hareketli Ortalama", "   DEMA Yavaş   " - yavaş gösterge "   Çift Üstel Hareketli Ortalama" ve "   DEMA Hızlı   " - hızlı gösterge "Çift Üstel Hareketli Ortalama". İki tür kavşak       : "   MA Uyarı Fiyatı   " - fiyat   "MA" çizgisini geçiyor ve   "   Alert DEMA DEMA   " - çizgiler kesişiyor       "DEMA Yavaş" ve   "DEMA Hızlı   ". Karşıdan karşıya geçerken aşağıdaki seçenekler mevcuttur:
Bu Uzman Danışman, manuel ve yarı otomatik ticaret için yardımcı programlar sınıfına aittir. "   Günün uç   noktalarında bekleyen emir " EA, bir önceki günün uç noktalarında bekleyen iki emir verir. Parametre "   Bekleyen Emirler: ...       ", bekleyen emirlerin türünü seçmenizi sağlar: "   Alış Durdurma ve Satış Durdurma   " veya "   Alış Limiti ve Satış Limiti   "   .       aşırılık       'Düşük' ofset aşağı doğru yapılır). "   Yeni beklemede -> öncekileri sil   " "   true   " olarak ayarlandı
"Panel Kısmi Kapatma" yardımcı programı paneli, kâr getiren bir pozisyonun hızlı bir şekilde kısmen kapatılması için tasarlanmıştır. Yalnızca iki parametresi vardır: "   Kısmi kapatma #1   " ve "   Kısmi kapatma #2   ". Herhangi bir sembol ve herhangi bir 'Sihirli sayı' için çalışır - yani, yardımcı program öncelikle manuel ticaret için tasarlanmıştır. Nasıl çalışır: Örneğin, "EURUSD", "Jump 100 Index" ve "XAUUSD" (altın) üzerinde çeşitli pozisyonlarınız var. Yardımcı program en yüksek karı olan
MQL5 "Günlük direnç ve destek" göstergesi - günlük destek ve direnç çizgilerini çizer. Çizim yalnızca grafik nesnelerin (trend çizgileri) yardımıyla gerçekleştirilir - bu göstergede gösterge tamponları kullanılmaz. Göstergenin herhangi bir ayarı yoktur - seviye araması "D1" zaman aralığından son 500 barda gerçekleştirilir ve bu parametre kodun içinde fiziksel olarak bağlanmıştır. Manuel ticaret: Manuel alım satım yaparken, bu göstergenin "M10" ile "H1" arasındaki zaman dilimlerinde kullanılması
"   Çoklu Sembol İzleme   " yardımcı programı, halihazırda açık olan tüm pozisyonlar için Kaybı Durdur'u hareket ettirir (çoklu sembol izleme). Öncelikle manuel ticarete yardımcı olmayı amaçlamaktadır. Yardımcı program için döviz çiftinin adına veya bireysel tanımlayıcıya (Sihirli sayı) göre herhangi bir kısıtlama yoktur - yardımcı program kesinlikle şu anda açık olan tüm pozisyonları işler. "   Trailing Stop   " ve "   Trailing Step   " parametrelerinin ölçü birimi puandır (1.00055 fiyatı ile
"Trend İki Hareketli Ortalama" trend göstergesi, hesaplama sonuçlarını görüntülemek için iki tür Ok kullanır - bunlar "Trend UP" ve "Trend DN".       Oklar "Trend Yukarı"       çizilir       İle       fiyat       'Düşük'       çubuk   ,       A       Oklar "Trend DN" -       İle       fiyat       'yüksek'. Trend arama algoritması, bir çubuğun fiyatının analizine ve iki 'Hareketli Ortalama' göstergesinin değerlerine dayanır. Trend yönü, mevcut (sıfır) çubuğunda hesaplanır. Bu nedenle, 1 numaralı
Üç Zaman Çerçevesi gösterge paneli. Gösterge, CAppDialog sınıfına dayalı bir panel şeklinde yapılır. Panel, fare kullanılarak simge durumuna küçültülebilir veya geçerli grafikte hareket ettirilebilir. Gösterge, paneldeki mevcut sembolün üç zaman dilimini gösterir. Mevcut sürümde, göstergenin minimum sayıda ayarı vardır - bunlar üç zaman diliminin parametreleridir: "Daha genç zaman dilimi", "   Orta   zaman dilimi   " ve "   Daha eski   zaman dilimi   ". Başlatıldığında, gösterge paneli mevcut ta
"   Piyasa Seans Süreleri   " göstergesi dört işlem seansının süresini gösterir: Asya, Avrupa, Amerika ve Pasifik. Ticaret seanslarının süresi   şu formatta   ayarlanır:       GMT ve dolayısıyla ticaret sunucusuna hiç bağlı değildir. Aşağıdaki veriler kullanılır: Ticaret Seansı Şehir GMT Asya Tokyo Singapur Şanghay 00:00−06:00 01:00−09:00 01:30−07:00 Avrupa Londra Frankfurt'ta 07:00−15:30 07:00−15:30 Amerika New York Chicago 13:30−20:00 13:30−20:00 Pasifik Wellington Sidney 20:00−
Çeşitli ticaret işlemleri için ticaret sistemi. Belirli indirim görevleri veya benzerleri için kullanılan bakiyeyi sıfır civarında dolaşacak şekilde ayarlamanıza olanak tanır. Riskten korunma   hesaplarıyla çalışacak şekilde yapılandırılmıştır.   Piyasada birden fazla pozisyon bulunamaz   . Genel bir ayar olan "   Adım, Zararı Durdur, Kar Al   " parametresi puan cinsinden ölçülür (EURUSD için örnek: 1.00055-1.00045 = 10 puan). Danışman,   pozisyon yerleştirirken marj eksikliğiyle karşılaşırsa ti
Gösterge daha yüksek zaman dilimindeki Fraktalları gösterir. İki tür Fraktal görüntülemek mümkündür: 'Normal Fraktal' ve 'BW Fraktal'. Fraktal 'UP' oluşumunu düşünün. 'Düzenli Fraktal', her bir sonraki 'yüksek' fiyatın (orta çubuğun solunda ve sağında) daha küçük olduğu çok katı bir Fraktaldır. Oysa 'BW Fractal'da tek bir koşul vardır: Merkezi çubuğun (fiyatı 'yüksek') en yüksek olması gerekir. Görsel olarak bu iki mod arasındaki fark diyagram 1'de görülebilir. 'Daha Yüksek Zaman Çerçevesi' par
Yapay Zeka Desteği Direnci Bu, “Destek” ve “Direnç” satırlarını arayan bir göstergedir. Arama, sayısal analiz ve veri işlemeye yönelik bir algoritma kullanılarak gerçekleştirilir. Üç arama seçeneği mevcuttur (“mod #1”, “mod #2” ve “mod #3”). Bu seçeneklerin her biri kendi dahili algoritmasında farklılık gösterir (şu anda bunlar tamamen dahili ayarlardır, kullanıcı tarafından kullanılamaz). Bu seçeneklerin aramanın ciddiyetine göre farklılık gösterdiğini söyleyebiliriz. Sınırlama: Şu anda gösterg
Yardımcı program "       Zaman Yöneticisini Aç       " belirli bir zamanda bir pozisyon açar ve ardından klasik takibi etkinleştirir. Zaman ("       Şimdi       ":"       dakika       ") her zaman GMT zaman diliminde bir GMT Farkı ile ayarlanır. ' tuşunu kullanarak bir pozisyon açmak için üç seçenek seçebilirsiniz.       Ticaret Modu       ': '       ELDE ETMEK       ' '       SATMAK       ' '       AL ve SAT (aynı anda)       ' '       KAPALI (değişim yok, yalnızca son çalışmalar)       ' Dörd
Gösterge       "Destek" ve "Direnç" çizgilerini gösterir (bu çizgiler DRAW_LINE çizim stili kullanılarak çizilmiştir - yani bunlar grafik nesneleri değildir). "Sinyal çubuğunun" solunda ve sağında yeni minimum ve maksimumlar için bir arama gerçekleştirilir - "sinyal çubuğu" her yeni yapının geleneksel ortasıdır. Göstergenin adında neden Esnek kelimesi geçiyor? Çünkü "sinyal çubuğunun" solunda ('Sol Çubuklar') ve sağında ('Sağ Çubuklar') farklı sayıda çubuk belirtme olanağımız var. Gösterge çizgi
ATR Bantları Uyarısı, kanal genişliğinin sabit bir çarpan ("Çarpan") ve "Ortalama Gerçek Aralık" göstergesinin değeri olarak hesaplandığı bir kanal göstergesidir. Bollinger Bantlarından farklı olarak bant genişliği çok sık değişmez; ATR Bant Uyarısı göstergesinde bantlar genellikle uzun düz çizgilere sahiptir. ATR Bantları Uyarısının yorumlanması, fiyatın çoğu zaman bantların içinde olduğu gerçeğine dayanmaktadır ve fiyatın sınırlardan birine ulaşması bir trend değişikliğine işaret edebilir.
Filtrele:
İnceleme yok
İncelemeye yanıt