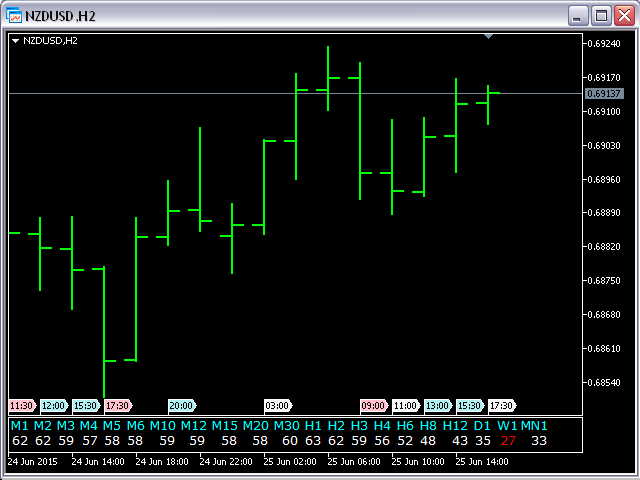
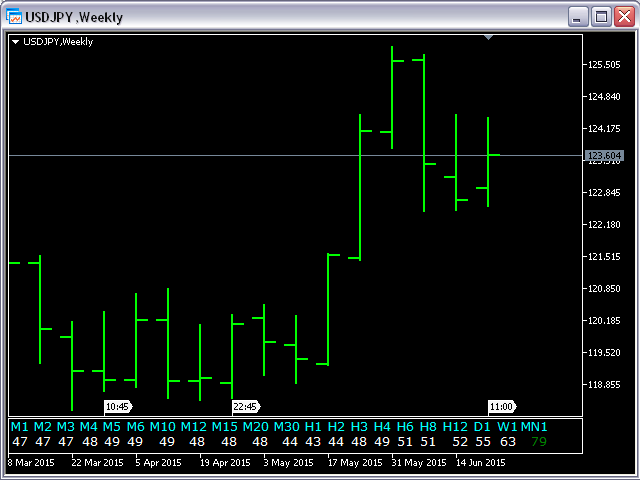
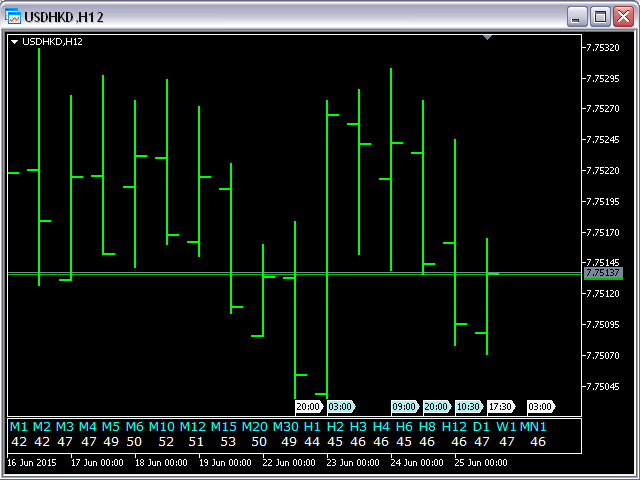
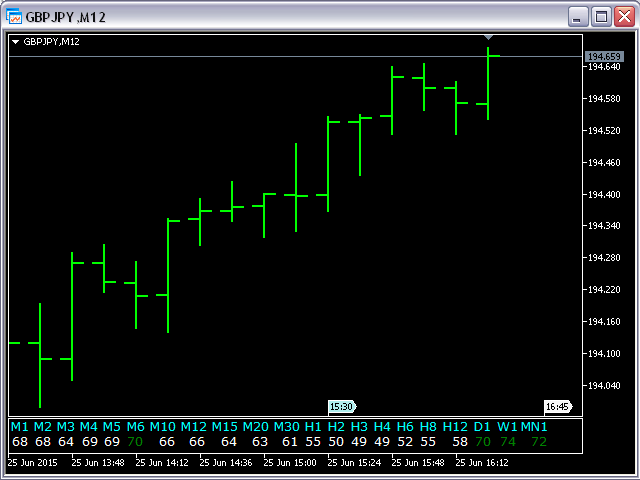
All MT5 TimeFrames RSI
- Göstergeler
- Sürüm: 4.6
- Güncellendi: 18 Kasım 2021
- Etkinleştirmeler: 5

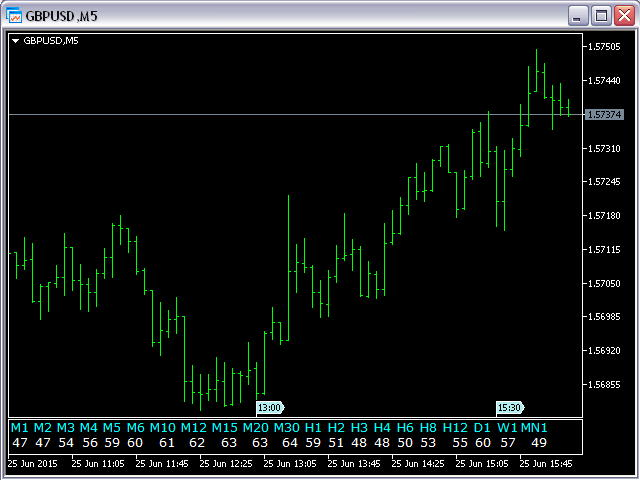
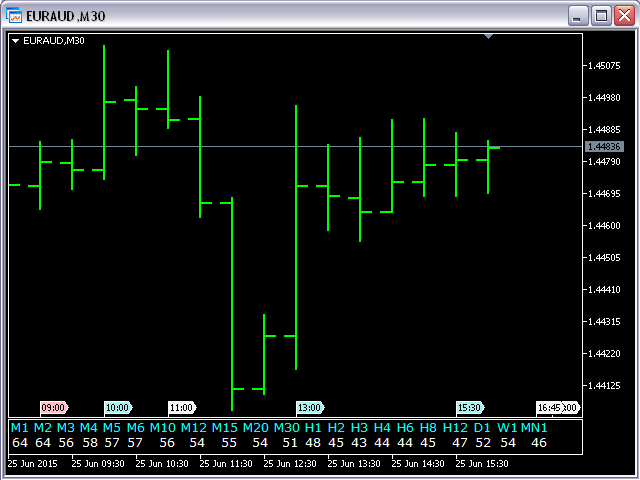
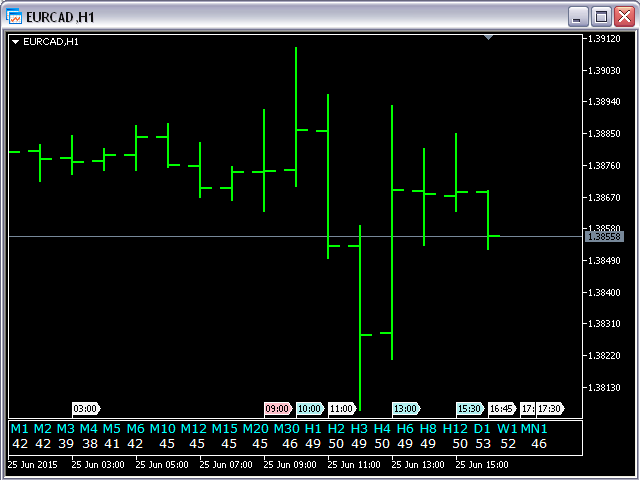
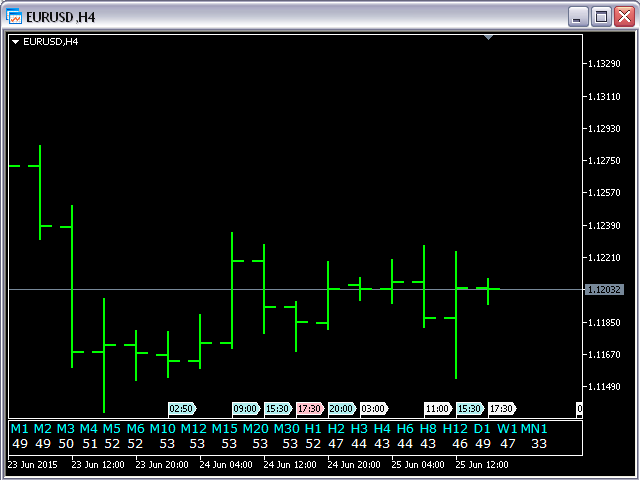
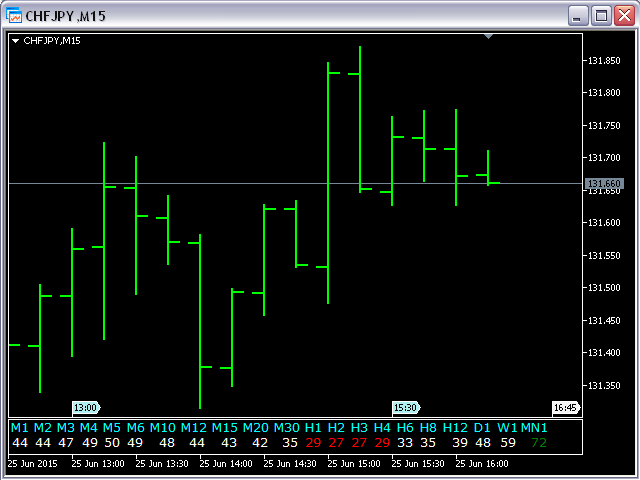
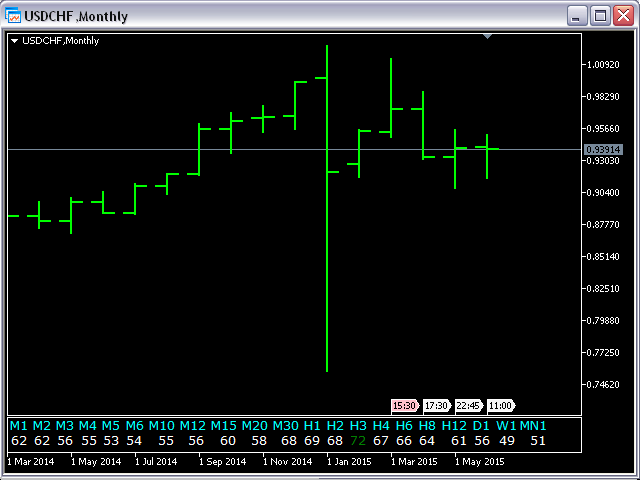
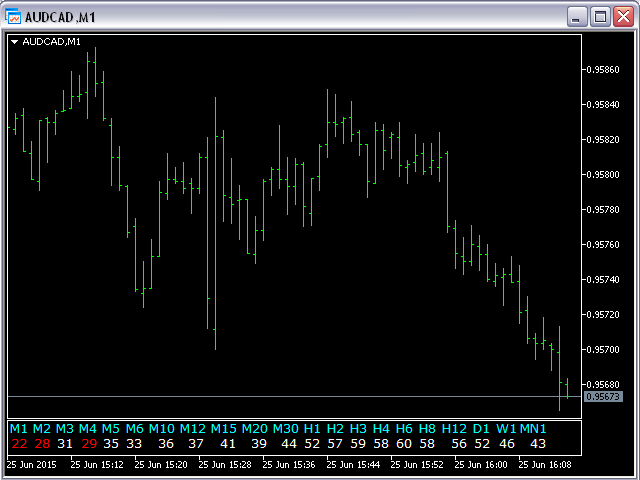
This indicator is based on the classical indicator RSI (Relative Strength Index) and will be helpful for those who love and know how to use not a visual but digital representation of the indicator. All MT5 TimeFrames RSI indicator shows values from each time frames:
- M1, M2, M3, M4, M5, M6, M10, M12, M15, M20, M30, H1, H2, H3, H4, H6, H8, H12, D1, W1, AND MN1.
You will be able to change the main input parameters for each RSI for every TF.
Example for M1
- sTF1___ = "M1";
- Period1 = 13;
- Price1 = PRICE_CLOSE.
Input parameters
- OverboughtLevel = 70; - Overbought Level (all TFs) for RSI
- OversoldLevel = 30; - Oversold Level (all TFs) for RSI
- aColor = clrAqua; - Color for TFs labels
- wColor = clrWhite; - Color for digital RSI values
Note
- 1. When you change currency pair for the opened chart you have to wait couple second for recalculation.
- 2. Before using this indicator you have to open all charts (all TFs) for the current currency pairs.