 MetaTrader 5
 Uzmanlar
 Göstergeler
 Komut dosyaları
 Kütüphaneler
 Depo
Alım-satım robotlarını ücretsiz olarak nasıl indirebileceğinizi izleyin
Bizi Facebook üzerinde bulun!
Fan sayfamıza katılın
Fan sayfamıza katılın
Kodu beğendiniz mi? MetaTrader 5 terminalinde deneyin

Market Hours Label - is the symbol open now and when it closes - MetaTrader 5 için komut dosyası
Eduardo Cumplido

Kimya mühendisiyim ve EFA (European Financial Advisor) sertifikalı finansal danışmanım; 2010'dan beri portföy yönetimi, finansal piyasalar ve MQL programlama alanlarında deneyimim var. Yıllar boyunca yazılım geliştirme, kantitatif analiz ve strateji değerlendirmesini bir araya getirerek gerçek alım
- Görüntülemeler:
- 65
- Derecelendirme:
- Yayınlandı:
- Güncellendi:
-
 Alım-satım fırsatlarını kaçırıyorsunuz:
- Ücretsiz alım-satım uygulamaları
- İşlem kopyalama için 8.000'den fazla sinyal
- Finansal piyasaları keşfetmek için ekonomik haberler
Kayıt Giriş yapWeb sitesi politikasını ve kullanım şartlarını kabul edersiniz
Hesabınız yoksa, lütfen kaydolun -
 Bu koda dayalı bir robota veya göstergeye mi ihtiyacınız var? Freelance üzerinden sipariş edin
Freelance'e git
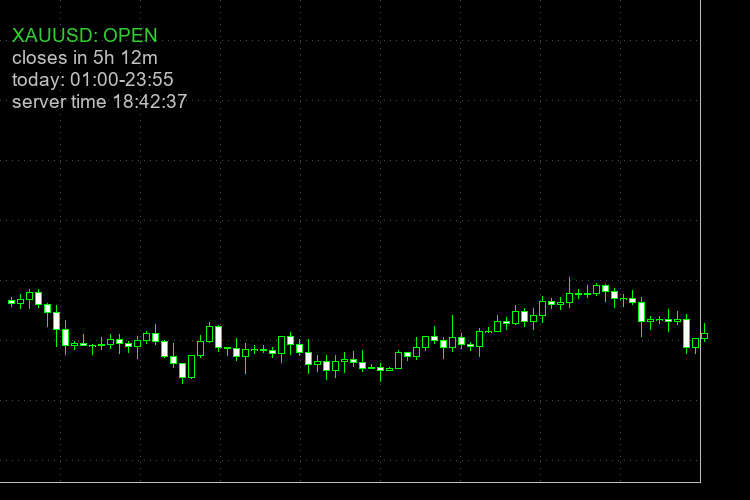
Sometimes I need the trading time of a specific symbol in my broker. The script reads the trade sessions that the broker gives for the chart symbol and writes on the chart if it is open or closed now, and how much time is left. Every broker has different hours for gold, indices and crypto, and the daily break is not at the same time everywhere, so I prefer to see it on the chart and not open the specification window each time.
What it shows:
- OPEN or CLOSED for the symbol of the chart
- the time left to the close, or to the next open when it is closed
- the sessions of today, in server time
- the server time
Inputs:
- corner, X and Y offset, font size and colors of the label
- show or hide the sessions of today
- alert some minutes before the close (0 = off), and also push notification if you want
Notes:
- It uses the session table of the broker. Holidays are not in that table, so on a holiday the label can say OPEN when the market is closed.
- If a session ends at 24:00 and the next day starts at 00:00, it counts as one session, so the time to the close is the real one.
- All the times are server time.
- Display only, it never opens or closes trades.
How to use:
- Copy MarketHoursLabel.mq5 to the MQL5\Scripts folder and compile it.
- Drag it on the chart of the symbol you want.
 Spread By Hour - average and max spread per hour, live spread vs usual
Average and maximum spread for each server hour from bar history, live spread vs the usual spread of this hour, and the spread cost of 1 lot.
Heikin Ashi Candles Drawn as a Chart Overlay
Heikin Ashi candles drawn as an overlay directly on the price chart, with optional hiding of the original candles (restored when the indicator is removed) and an on-chart label showing the trend, its strength and the run length.
Trend Strength Meter Using ADX in a Compact Dashboard
A compact on-chart dashboard that shows the trend strength of up to four timeframes using the ADX: value, strength bar, strength class and +DI/-DI direction, plus a summary row with the average ADX and the agreement of the directions.
Building a Confluence Signal Engine in MQL5: Leading Triggers, Confirmation Filters and a Live Dashboard
Free source code included: a DST-aware Market Sessions + PVSRA vector-candle indicator, 5 preset files and a printable confluence cheat sheet.