 MetaTrader 5
 Uzmanlar
 Göstergeler
 Komut dosyaları
 Kütüphaneler
 Depo
Alım-satım robotlarını ücretsiz olarak nasıl indirebileceğinizi izleyin
Bizi Telegram üzerinde bulun!
Fan sayfamıza katılın
Fan sayfamıza katılın
Kodu beğendiniz mi? MetaTrader 5 terminalinde deneyin

Heikin Ashi Candles Drawn as a Chart Overlay - MetaTrader 5 için gösterge

- Görüntülemeler:
- 67
- Derecelendirme:
- Yayınlandı:
-
 Alım-satım fırsatlarını kaçırıyorsunuz:
- Ücretsiz alım-satım uygulamaları
- İşlem kopyalama için 8.000'den fazla sinyal
- Finansal piyasaları keşfetmek için ekonomik haberler
Kayıt Giriş yapWeb sitesi politikasını ve kullanım şartlarını kabul edersiniz
Hesabınız yoksa, lütfen kaydolun -
 Bu koda dayalı bir robota veya göstergeye mi ihtiyacınız var? Freelance üzerinden sipariş edin
Freelance'e git

Heikin Ashi Candles Drawn as a Chart Overlay
The idea behind it
Heikin Ashi ("average bar" in Japanese) is a candlestick technique that smooths price action. Each candle is built from averaged values instead of the raw open, high, low and close, so consecutive candles of the same color are easier to see and small counter-moves are filtered out. The formulas are:
HA Close = (Open + High + Low + Close) / 4 HA Open = (HA Open[prev] + HA Close[prev]) / 2 HA High = max(High, HA Open, HA Close) HA Low = min(Low, HA Open, HA Close)
The first candle of the history uses (Open + Close) / 2 as its HA open. Because every HA open depends on the previous HA candle, the indicator keeps the full history in its buffers and, after the first run, only recalculates the forming bar and new bars.
Many implementations draw Heikin Ashi in a separate window or as a custom symbol. This indicator draws the candles on the main chart, in the same price scale as the real candles. It can optionally hide the original candles, so the chart looks like a native Heikin Ashi chart while you keep working with the real symbol, its orders and its other indicators.
How to interpret it
- Bullish candle – HA close above HA open (default: white). A series of bullish candles shows an up-trend.
- Bearish candle – HA close below HA open (default: gray). A series of bearish candles shows a down-trend. If HA close equals HA open (doji), the candle takes the color of the previous candle.
- Strong candle – a bullish candle without a lower shadow (HA open = HA low) or a bearish candle without an upper shadow (HA open = HA high). Such candles usually appear in a steady, accelerating trend.
- Small bodies with shadows on both sides – indecision, consolidation or a possible trend change.
- Color change – the first candle of the opposite color is an early warning of a trend change; the signal is confirmed only when the candle is closed.
- Status label – shows BULL or BEAR, the word (strong) if the candle has no shadow against the trend, and the run length: how many consecutive candles have the same color. The values are taken from the last closed bar, so the label does not flicker. The label is a chart object that is deleted when the indicator is removed.
- Prices are not real – HA open and close are averages. Do not use them as entry prices or as exact stop levels; use the real prices (the Data Window shows HA Open, HA High, HA Low and HA Close of the candle).
The indicator draws in the main chart window. For iCustom() the buffers are: 0 – HA open, 1 – HA high, 2 – HA low, 3 – HA close, 4 – color index (0 = bullish, 1 = bearish).
External variables (inputs)
| Input | Default | Purpose |
|---|---|---|
| InpBullColor | clrWhite | Color of bullish Heikin Ashi candles. |
| InpBearColor | clrGray | Color of bearish Heikin Ashi candles. |
| InpHideChartCandles | true | Hide the original chart candles. The indicator saves the chart colors, paints candles, bars and line with the background color, and turns off the "Chart on foreground" option. Everything is restored in OnDeinit() . |
| InpShowStatus | true | Show or hide the on-chart status label. |
| InpCorner | CORNER_LEFT_UPPER | Chart corner in which the status label is placed. |
| InpStatusColor | clrWhite | Color of the status label text. |
Recommended use
- Symbols and timeframes – works on any symbol and timeframe. Heikin Ashi is most useful on trending instruments and on H1–D1 charts, where smoothing removes noise without hiding the structure.
- Trend following – stay with the trend while candles keep the same color, and become careful when bodies shrink and shadows appear on both sides. Combine it with a trailing stop or a moving average to define exits.
- Hiding original candles – with InpHideChartCandles = true the chart looks like a Heikin Ashi chart. Set it to false if you want to see both kinds of candles; in this case, if the original candles cover the HA candles, disable the "Chart on foreground" option (F8 → Common).
- Restoring the chart – the original colors are restored when the indicator is removed or the chart is closed. If the terminal crashes while the indicator is attached, restore the chart colors manually (F8 → Colors) or apply a template. Use only one instance with InpHideChartCandles = true per chart.
- Caveats – Heikin Ashi lags the real price and hides gaps, because every candle opens at the middle of the previous HA body. The values of closed bars do not change, but the forming candle changes with every tick. In sideways markets the colors alternate frequently and give false signals.
- Account types – the indicator only reads price data and does not trade, so it works the same on netting and hedging accounts.
- Performance – the whole history is calculated once; afterwards only the forming and new bars are recalculated ( prev_calculated ).
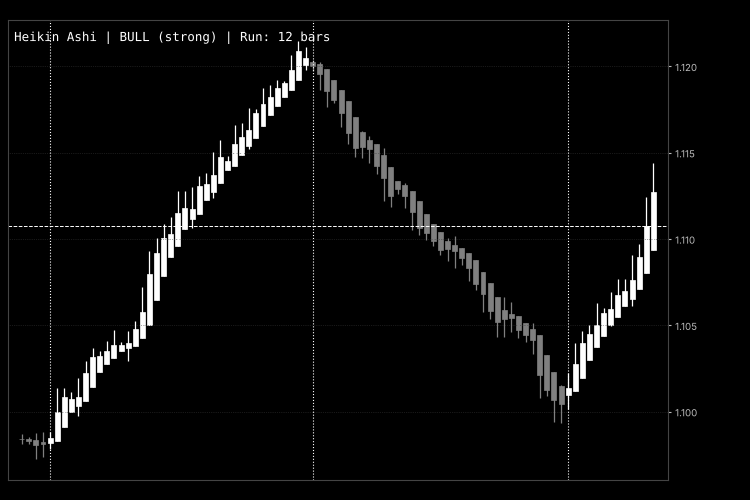
Fig. 1. Heikin Ashi candles drawn over the chart with the original candles hidden (bullish – white, bearish – gray) and the status label; black & white image according to the Code Base image guidelines.
 H4 Breakout Retest EA for Gold (XAUUSD)
Gold EA: breakout of the first H4 candle with confirmation via a retest, fixed percentage stop and target, risk-based lot size and drawdown protection.
Swap Cost Panel — tonight's rollover cost for every open position
On-chart panel that estimates tonight's swap for each open position in account currency, marks the triple-swap day, and compares it with the cost of closing before rollover and re-opening after (spread + commission).
Spread By Hour - average and max spread per hour, live spread vs usual
Average and maximum spread for each server hour from bar history, live spread vs the usual spread of this hour, and the spread cost of 1 lot.
 Market Hours Label - is the symbol open now and when it closes
Small label on the chart. the symbol is open or closed now, the time left to the close or to the next open, and the sessions of today. It reads the trade sessions of your broker. Display only.