 MetaTrader 5
 Uzmanlar
 Göstergeler
 Komut dosyaları
 Kütüphaneler
 Depo
Alım-satım robotlarını ücretsiz olarak nasıl indirebileceğinizi izleyin
Bizi Telegram üzerinde bulun!
Fan sayfamıza katılın
Fan sayfamıza katılın
Kodu beğendiniz mi? MetaTrader 5 terminalinde deneyin

MTF Trend Dashboard — trend, position and volatility on six timeframes at a glance - MetaTrader 5 için gösterge
Shipra Gupta

Ben Shipra Gupta, matematik, ekonomi ve algoritmik işlem sistemleri konusunda güçlü bir altyapıya sahip trader ve kantitatif strateji geliştiricisiyim. Yıllar boyunca forex, altın, endeksler, emtialar ve kripto para piyasalarında aktif olarak çalıştım ve tutarlılık, hassasiyet ve disiplinli işlem
- Görüntülemeler:
- 89
- Yayınlandı:
-
 Alım-satım fırsatlarını kaçırıyorsunuz:
- Ücretsiz alım-satım uygulamaları
- İşlem kopyalama için 8.000'den fazla sinyal
- Finansal piyasaları keşfetmek için ekonomik haberler
Kayıt Giriş yapWeb sitesi politikasını ve kullanım şartlarını kabul edersiniz
Hesabınız yoksa, lütfen kaydolun -
 Bu koda dayalı bir robota veya göstergeye mi ihtiyacınız var? Freelance üzerinden sipariş edin
Freelance'e git
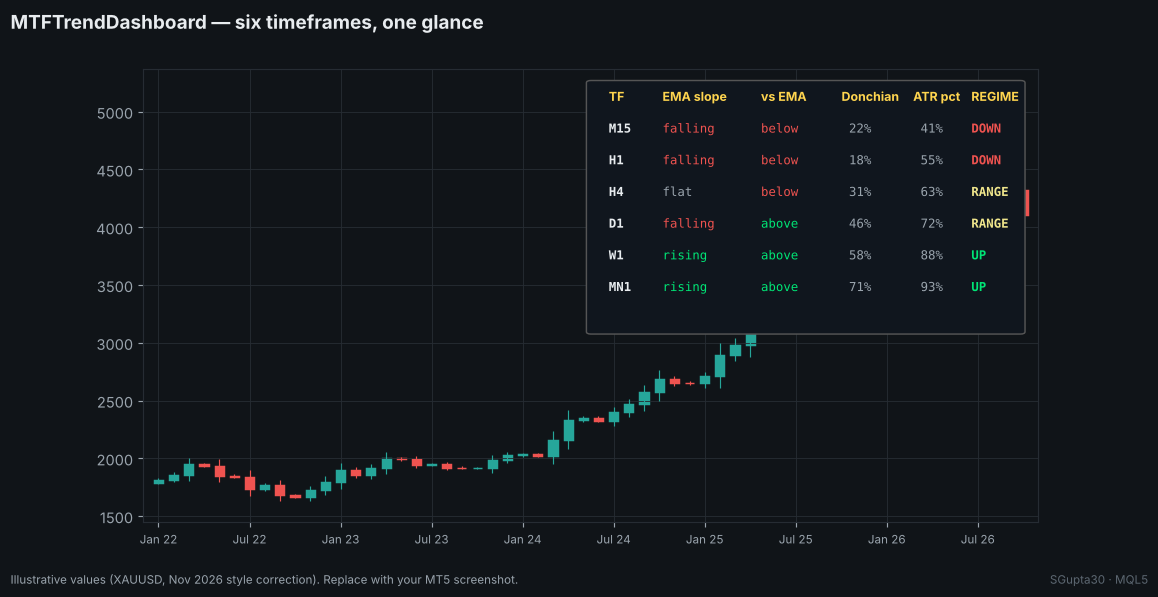
What you see
Each row is a timeframe and each column answers one question:
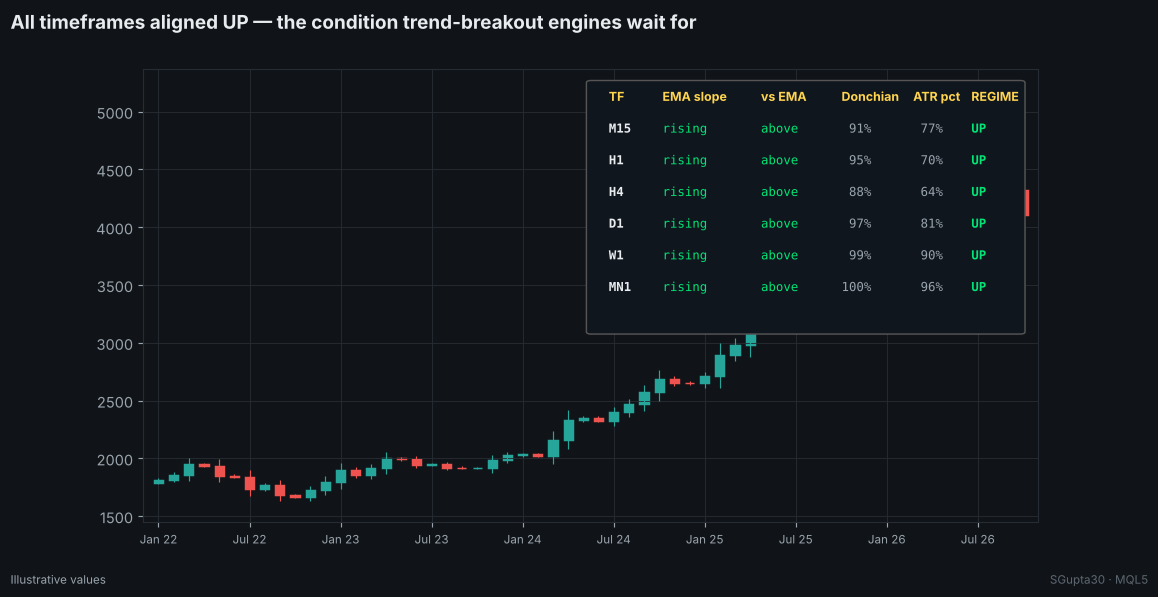
| Column | Question | Colours |
|---|---|---|
| EMA slope | Is the EMA rising or falling over the last k bars? | green / red |
| vs EMA | Is the last close above or below the EMA? | green / red |
| Donchian | Where is the close inside the last N-bar range (0–100%)? | green > 80%, red < 20% |
| ATR pct | How high is volatility versus the last 250 bars? | blue < 20% (quiet), orange > 80% (hot) |
| REGIME | Do slope and side agree? | UP / DOWN / RANGE |
When timeframes align
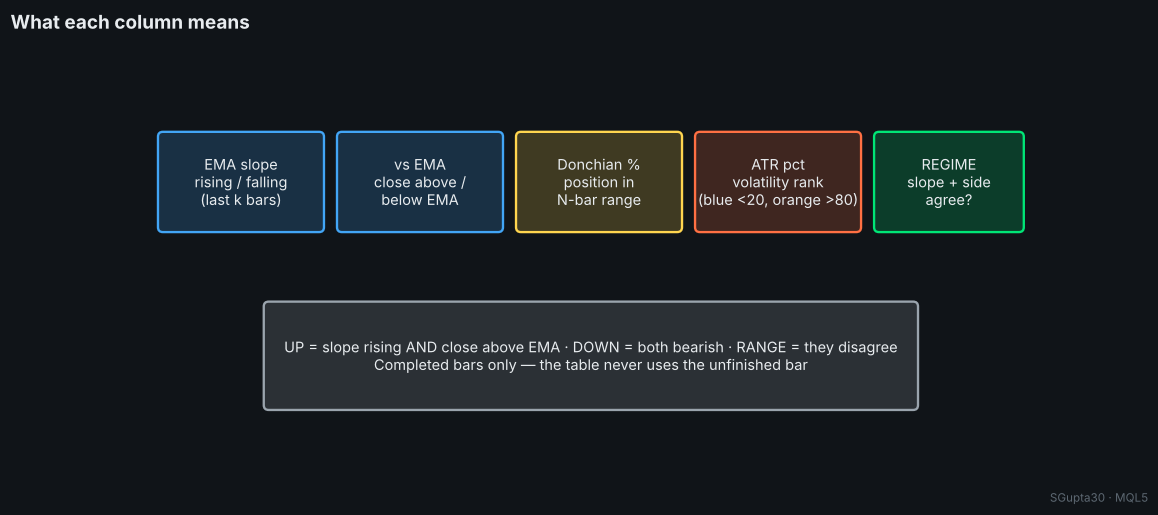
Trend-breakout systems earn most of their profit when the higher timeframes agree. A column of UP from H1 to MN1, with Donchian position near 100%, is the classic condition for long breakouts on gold. A mix of UP and DOWN tells you that the market is in a correction or a range, which is a reason to reduce risk or stand aside.
Inputs
| Input | Default | Description |
|---|---|---|
| Trend EMA period | 100 | EMA on every timeframe |
| EMA slope look-back | 3 | Completed bars for the slope |
| Donchian length | 50 | Range for the position % |
| ATR percentile look-back | 250 | Bars for the volatility rank |
| X / Y offset, corner | 12 / 24, right upper | Layout |
| Background | dark | Panel colour |
Implementation notes
- Uses one EMA and one ATR handle per timeframe and refreshes every 5 seconds.
- Reads completed bars only (shift 1), so the table never changes on the forming bar.
// regime rule used by the dashboard int regime = (slope>0 && close>ema) ? 1 : ((slope<0 && close<ema) ? -1 : 0); // UP / DOWN / RANGE
Author: Shipra Gupta (SGupta30) · the author's gold trend EAs use this kind of higher-timeframe regime filter.
 Breakeven and R-Trail Manager — break-even at +1R and R-multiple trailing for any trade
Utility EA that moves the stop to break-even plus a small lock once a trade reaches +X R, then trails it N R behind price. Manual trades or any EA by magic number. Never opens trades and never widens a stop.
ATR Trailing Stop Line (Chandelier Exit)
ATR Trailing Stop Line (Chandelier Exit): a volatility-based trailing stop that hangs below the highest high in an up-trend and rises above the lowest low in a down-trend, with trend-flip arrows, an on-chart status label and optional alerts.
Range Filter Buy and Sell
A faithful MetaTrader 5 port of the TradingView "Range Filter Buy and Sell 5min" (DonovanWall / guikroth / tvenn): range filter line, target bands, Buy/Sell arrows and bar colors, no repainting, alerts (popup, sound, push, e-mail) and a signal statistics panel.
Tester vs Live Trade Matcher
A free, read-only MetaTrader 5 utility: it reads a Strategy Tester report (MT5 or MT4 .htm) and matches every backtest trade with your account history or with a second report. It shows the match rate, missed and extra trades, slippage, delay, real costs and how much of the backtest edge survives live.