 MetaTrader 5
 Uzmanlar
 Göstergeler
 Komut dosyaları
 Kütüphaneler
 Depo
Alım-satım robotlarını ücretsiz olarak nasıl indirebileceğinizi izleyin
Bizi Telegram üzerinde bulun!
Fan sayfamıza katılın
Fan sayfamıza katılın
Kodu beğendiniz mi? MetaTrader 5 terminalinde deneyin

ATR Trailing Stop Line (Chandelier Exit) - MetaTrader 5 için gösterge

- Görüntülemeler:
- 92
- Yayınlandı:
-
 Alım-satım fırsatlarını kaçırıyorsunuz:
- Ücretsiz alım-satım uygulamaları
- İşlem kopyalama için 8.000'den fazla sinyal
- Finansal piyasaları keşfetmek için ekonomik haberler
Kayıt Giriş yapWeb sitesi politikasını ve kullanım şartlarını kabul edersiniz
Hesabınız yoksa, lütfen kaydolun -
 Bu koda dayalı bir robota veya göstergeye mi ihtiyacınız var? Freelance üzerinden sipariş edin
Freelance'e git

ATR Trailing Stop Line (Chandelier Exit)
The idea behind it
The Chandelier Exit, popularized by Charles Le Beau and Alexander Elder, is a trailing stop that "hangs" from the highest point reached by price, like a chandelier from a ceiling. Instead of using a fixed number of points, the distance is a multiple of the Average True Range (ATR). In quiet markets the stop sits close to price; in volatile markets it moves further away, so normal noise does not stop you out too early.
The two stop levels are calculated as follows:
Long stop = Highest High (Lookback) - Multiplier * ATR Short stop = Lowest Low (Lookback) + Multiplier * ATR
Two rules turn these levels into a usable trailing stop line:
- Ratchet – while the trend continues, a stop may only move in the direction of the trade. The long stop never moves down and the short stop never moves up, even if ATR expands.
- Flip – the trend changes when the close breaks the opposite stop: a close above the short stop turns the trend up, a close below the long stop turns it down. Using closes instead of intrabar spikes makes false flips less frequent.
ATR is calculated inside the indicator with Wilder smoothing (the first value is the simple average of the first InpATRPeriod true ranges), so no indicator handle is needed.
How to interpret it
- Long stop line – drawn below price while the trend is up (default: thick white line). It rises step by step and never falls. A long position is protected by this level.
- Short stop line – drawn above price while the trend is down (default: thick gray line). It falls step by step and never rises. A short position is protected by this level.
- Only one line at a time – the line that is not active is hidden, so the chart always shows a single trailing stop. A gap between the two lines marks the flip.
- Buy arrow – an up arrow below the bar on which the close breaks above the short stop (trend flips from down to up).
- Sell arrow – a down arrow above the bar on which the close breaks below the long stop (trend flips from up to down).
- Flat sections – when price consolidates the line stays horizontal because of the ratchet. This is normal and means the stop is waiting.
- Status label – shows the trend (LONG or SHORT), the stop level and the distance between the current price and the stop in points. Trend and stop level are taken from the last closed bar, so they do not flicker; the level is the one to use for the next bar. The label is a chart object that is deleted when the indicator is removed.
The indicator draws only in the main chart window. For iCustom() the buffers are: 0 – long stop, 1 – short stop, 2 – buy arrow price, 3 – sell arrow price (EMPTY_VALUE where nothing is drawn).
External variables (inputs)
| Input | Default | Purpose |
|---|---|---|
| InpLookback | 22 | Number of bars used to find the highest high and the lowest low. |
| InpATRPeriod | 22 | ATR period (Wilder smoothing). |
| InpMultiplier | 3.0 | ATR multiplier: the distance of the stop from the extreme. Must be greater than 0. |
| InpUseClose | false | If true, the highest and lowest closes are used for the extremes instead of highs and lows. |
| InpShowArrows | true | Show buy/sell arrows on trend flips. |
| InpLongColor | clrWhite | Color of the long stop line and of the buy arrow. |
| InpShortColor | clrDarkGray | Color of the short stop line and of the sell arrow. |
| InpShowStatus | true | Show or hide the on-chart status label. |
| InpCorner | CORNER_LEFT_UPPER | Chart corner in which the status label is placed. |
| InpStatusColor | clrWhite | Color of the status label text. |
| InpAlertPopup | false | Show a popup alert when the trend flips on a closed bar. |
| InpAlertPush | false | Send a push notification when the trend flips on a closed bar (requires MetaQuotes ID in the terminal settings). |
Invalid parameters (periods below 1 or a multiplier not greater than 0) stop the initialization and a message is printed to the Experts tab.
Recommended use
- Symbols and timeframes – works on any symbol and timeframe. It suits trending instruments and H1–D1 charts best. On very low timeframes spread and noise make the ATR small relative to costs, so the stop may be too tight to be practical.
- As a trailing stop – after entering by your own method, move the stop to the line value of the last closed bar. The line never moves against the position.
- As a trend filter – trade only in the direction of the active line (long when the white line is shown, short when the gray line is shown).
- Tuning – a larger multiplier (for example 3.5–4) gives more room and fewer flips but larger losses on reversals; a smaller one (2–2.5) reacts faster but is more sensitive to noise. A shorter lookback follows price closely, a longer one anchors the stop to older extremes.
- Caveats – like every trend-following stop, it produces repeated flips (whipsaws) in sideways markets and gives back part of the profit before a reversal is confirmed. The values of closed bars do not change, but the forming bar changes with every tick, so a signal is confirmed only when the bar closes. The first bar of the history starts in an up-trend by definition, so ignore the very first flip after the warm-up period.
- Alerts – alerts are raised once, when a new bar opens, for the bar that has just closed. No alert is raised for the history that is loaded when the indicator is attached.
- Account types – the indicator only reads price data and does not trade, so it works the same on netting and hedging accounts. For real trading, add spread and slippage to the stop distance.
- Performance – the whole history is calculated once; afterwards only the forming and the new bars are recalculated ( prev_calculated ). The status label is created once and removed in OnDeinit() .
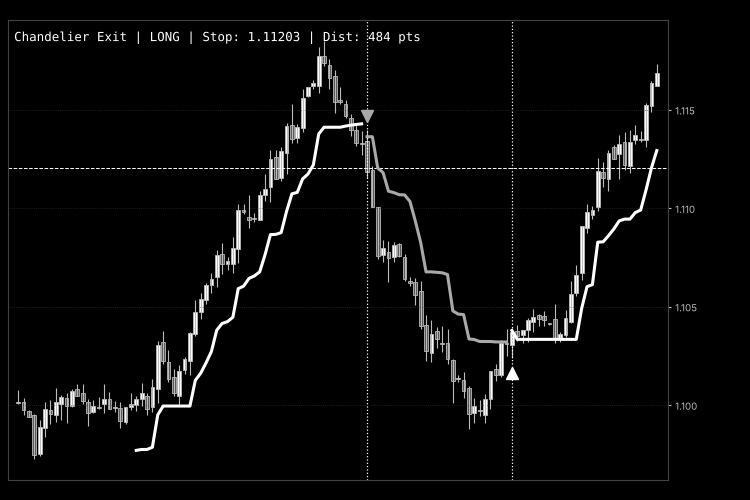
Fig. 1. ATR Trailing Stop Line (Chandelier Exit) with default inputs: long stop (white), short stop (gray), flip arrows and the status label; black & white image according to the Code Base image guidelines.
Kaufman Adaptive Moving Average (KAMA) Ribbon
A ribbon of Kaufman Adaptive Moving Averages with growing Efficiency Ratio periods, drawn in a monochrome gradient, with an on-chart label showing whether the ribbon is bullish, bearish or mixed.
Hull Moving Average with Slope Color Change
Hull Moving Average that changes color with its slope: one color while the line rises, another while it falls, a neutral one when it is flat, with optional arrows at the turns.
 Breakeven and R-Trail Manager — break-even at +1R and R-multiple trailing for any trade
Utility EA that moves the stop to break-even plus a small lock once a trade reaches +X R, then trails it N R behind price. Manual trades or any EA by magic number. Never opens trades and never widens a stop.
MTF Trend Dashboard — trend, position and volatility on six timeframes at a glance
One on-chart table for M15, H1, H4, D1, W1 and MN1: EMA slope, price vs EMA, Donchian position, ATR percentile and a combined UP / DOWN / RANGE regime. Completed bars only. Any symbol.