Fan sayfamıza katılın
- Yayınlayan:
- Görüntülemeler:
- 6934
- Derecelendirme:
- Yayınlandı:
-
 Alım-satım fırsatlarını kaçırıyorsunuz:
- Ücretsiz alım-satım uygulamaları
- İşlem kopyalama için 8.000'den fazla sinyal
- Finansal piyasaları keşfetmek için ekonomik haberler
Kayıt Giriş yapWeb sitesi politikasını ve kullanım şartlarını kabul edersiniz
Hesabınız yoksa, lütfen kaydolun -
 Bu koda dayalı bir robota veya göstergeye mi ihtiyacınız var? Freelance üzerinden sipariş edin
Freelance'e git
Bu koda dayalı bir robota veya göstergeye mi ihtiyacınız var? Freelance üzerinden sipariş edin
Freelance'e git

So far this expert is based on a 15 min bar or candle chart, so the MACD is used as early indication of direction. the focus is on the parabolic sar as first signal to indicate a buy or sell secondly it looks where the closed of bar or candle indicated on the chart if the third candle back was below sma and previous candle closed was above sma and sar flipped below the price. that constitute as a buy signal, if macd shows bullish move and sar flipped below price but previous candle close (close[1]) is still below the sma it waits for 5 candles window for price to close above the sma.
Be low is examples of the idea
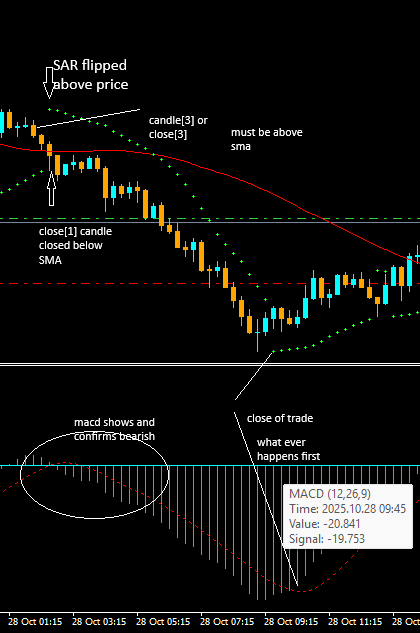
the idea is that as soon as the candle close below the sma the 3rd candle should be above the sma and within that time frame the SAR should also flipped above the price, by this time macd confirms either at the same time or few candles back a bearish move.
this picture shows a buy

 Heikin Ashi MT4 EA
Designed to trade using Heikin Ashi candles. By smoothing price action and filtering out market noise, this EA creates a clear map of market direction, allowing traders to catch strong trends, avoid false reversals, and manage trades with confidence.
 Reverse Engineered RSI (MT4)
Reverse Engineered RSI projects traditional RSI levels — 30, 50, and 70 — directly onto the price chart instead of the oscillator window. This lets traders see where RSI overbought, oversold, and equilibrium zones align with actual market prices, making it easier to spot precise support, resistance, and potential reversal levels without switching views or relying on hidden momentum data.
Data collector (profit/equity)
I wrote this indicator to compare two modes, timeframes and analyze the settings of my EA. You can make adjustments to suit your requirements or add something. The data collected is saved to a file every 5 minutes (one file per instance).
ZigZag HH HL LH LL Pattern Label Indicator (MT4)
This indicator is an enhanced version of the standard ZigZag used in MetaTrader 4. It automatically detects and labels structural price points: Higher High (HH), Higher Low (HL), Lower High (LH), and Lower Low (LL). The indicator draws trend lines between ZigZag points and prints the market structure on the chart in real time. Useful for: • Market structure analysis (HH, HL, LH, LL) • Pattern recognition (Head & Shoulders, Quasimodo, Break of Structure) • Trend continuation / reversal confirmation • Dashboard scanners and multi-timeframe systems The code has been optimized to remove warnings, uses only MQL4-compatible functions, and ensures clean object management with timeframe tagging. Suitable for manual traders, system builders, and EA developers.