 MetaTrader 5
 Uzmanlar
 Göstergeler
 Komut dosyaları
 Kütüphaneler
 Depo
Alım-satım robotlarını ücretsiz olarak nasıl indirebileceğinizi izleyin
Bizi Facebook üzerinde bulun!
Fan sayfamıza katılın
Fan sayfamıza katılın
Kodu beğendiniz mi? MetaTrader 5 terminalinde deneyin

MACD_Overlay - MetaTrader 5 için gösterge

- Görüntülemeler:
- 19038
- Derecelendirme:
- Yayınlandı:
- Güncellendi:
-
 Alım-satım fırsatlarını kaçırıyorsunuz:
- Ücretsiz alım-satım uygulamaları
- İşlem kopyalama için 8.000'den fazla sinyal
- Finansal piyasaları keşfetmek için ekonomik haberler
Kayıt Giriş yapWeb sitesi politikasını ve kullanım şartlarını kabul edersiniz
Hesabınız yoksa, lütfen kaydolun -
 Bu koda dayalı bir robota veya göstergeye mi ihtiyacınız var? Freelance üzerinden sipariş edin
Freelance'e git
Indicator MACD Overlay displays the chart as colored candles according to the data from oscillator MACD.
It has five adjustable parameters:
- Data MACD Compare mode - MACD data comparison mode
- MACD and signal Lines - MACD line and signal line
- MACD vs zero line - MACD line referred to zero
- Current and previous MACD values - comparing the current and previous values of the MACD line
- MACD fast EMA period - MACD indicator's fast EMA calculation period
- MACD slow EMA period - MACD indicator's slow EMA calculation period
- MACD period signal line - MACD indicator's signal line calculation period
- MACD applied price - MACD indicator's calculation price
MACD and signal Lines:
- If the MACD line is above the signal line,
then the bullish candle is displayed in green
the bearish candle is displayed in light-green
- If the MACD line is below the signal line,
then the bearish candle is displayed in red
the bullish candle is displayed in light-red
MACD vs zero line:
- If the MACD line is above zero,
then the bullish candle is displayed in green
the bearish candle is displayed in light-green
- If the MACD line is below zero,
then the bearish candle is displayed in red
the bullish candle is displayed in light-red
Current and previous MACD values:
- If the MACD line values grow,
then the bullish candle is displayed in green
the bearish candle is displayed in light-green
- If the MACD line values fall,
then the bearish candle is displayed in red
the bullish candle is displayed in light-red
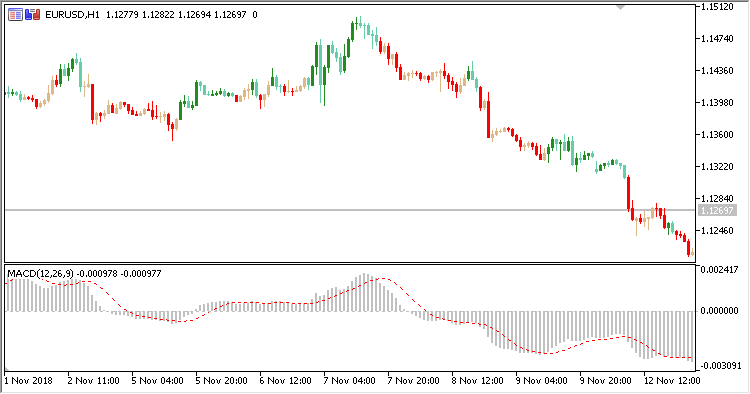
Fig. 1. MACD Overlay + MACD. Data MACD Compare mode = MACD and signal Lines
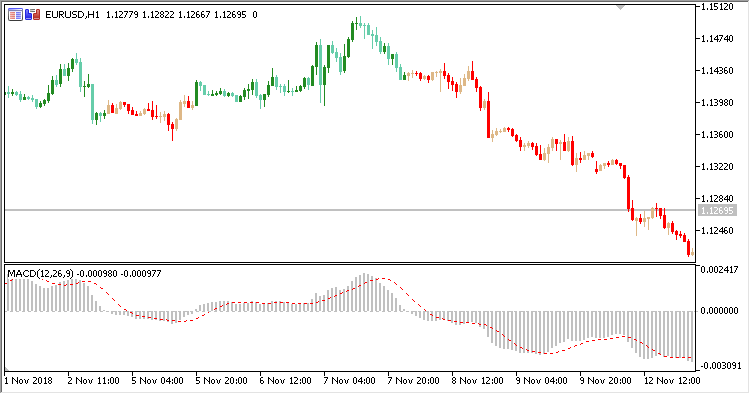
Fig. 2. MACD Overlay + MACD. Data MACD Compare mode = MACD vs zero line
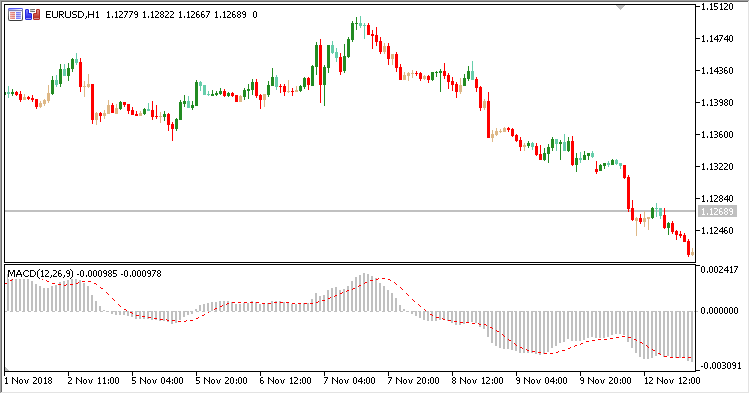
Fig. 3. MACD Overlay + MACD. Data MACD Compare mode = Current and previous MACD values
MetaQuotes Ltd tarafından Rusçadan çevrilmiştir.
Orijinal kod: https://www.mql5.com/ru/code/23427
ColorPEMA_Digit
A five-fold exponential moving average that displays the most recent value as a price label with the possibility to round the indicator levels to the required number of orders
Advanced_Fractal_Envelopes
Indicator Advanced Fractal Envelopes
ColorPEMA_Digit_r
A moving ColorPEMA_Digit with the limitation of the computer resources used for its calculations on the entire chart and on the current bar
RSI_Overlay
Indicator RSI Overlay