• Обзор
  • Отзывы (3)
  • Обсуждение (51)
  • Что нового

BookMap HeatMap

1

Translated with google from english

----

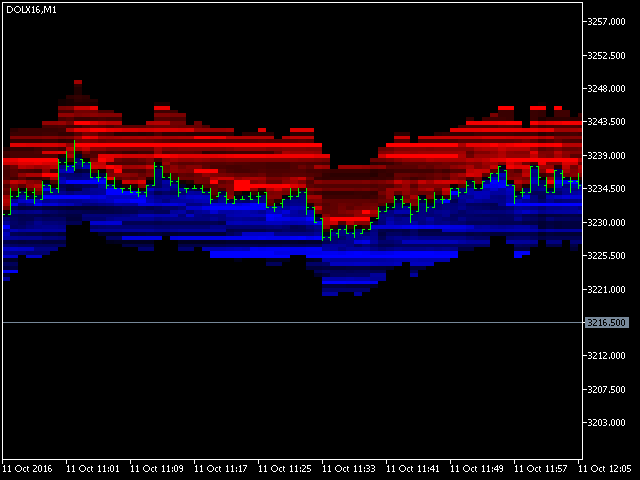
Этот индикатор создает тепловую карту на основе глубины рынка текущего или другого символа. Другой символ полезен, когда вы торгуете на фьючерсном рынке, а контракт имеет "мини" и "полный" сплит. Например, в Бразилии (B3 - BMF&Bovespa) WDO и DOL являются будущими валютными контрактами BRL/USD (где 1 DOL = 5 WDO), а крупные банки работают в основном с DOL (где важна ликвидность).


Пожалуйста, используйте с таймфреймом M1, объекты слишком малы, чтобы отображаться на более высоких таймфреймах (лимит MT5). Количество уровней в глубине рынка тоже важно (уточните у своего брокера, могут ли они увеличить это значение на стороне сервера). Акции с низкой ликвидностью иногда не очень хорошо использовать, но когда вы торгуете "дробной долей" (акциями), интересно иметь книгу "полной доли". С символами средней/высокой ликвидности (акции голубых фишек или фьючерсы) легче увидеть ликвидность и то, что происходит на стороне маркет-мейкера.


Очень важно читать поток ордеров и динамику книги, этот индикатор можно использовать с любым рынком (Forex/CFD/etc) с глубиной рынка.


Вход inputMaxVolume автоматически устанавливается на 0, для получения максимальной громкости используется время ожидания 5 секунд, вы можете жестко установить его (это лучше).


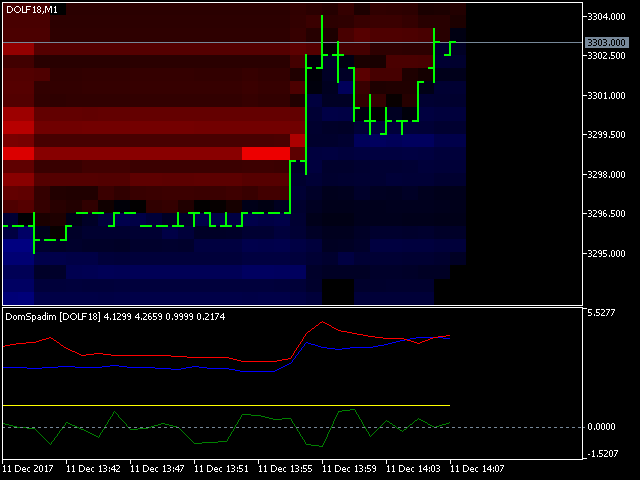
BookMap карту сохранить и восстановить исторические данные с использованием местных зашифрованные файлы. Он может ограничить количество минут, в течение которых отображается DOM, чтобы избежать большого количества объектов на экране (по соображениям производительности), а также отображать другие символы BID/ASK. BID/ASK может быть основан на Маркетстат-стике (информация о символах) или информации DOM. При использовании информации DOM вы можете выбрать минимальный объем (лучшая цена объема>=минимальный объем) или суммарный объем (средняя цена, где объем>=минимальный объем). Эти 3 варианта важны при использовании другого символа (фьючерс/доля фракции).


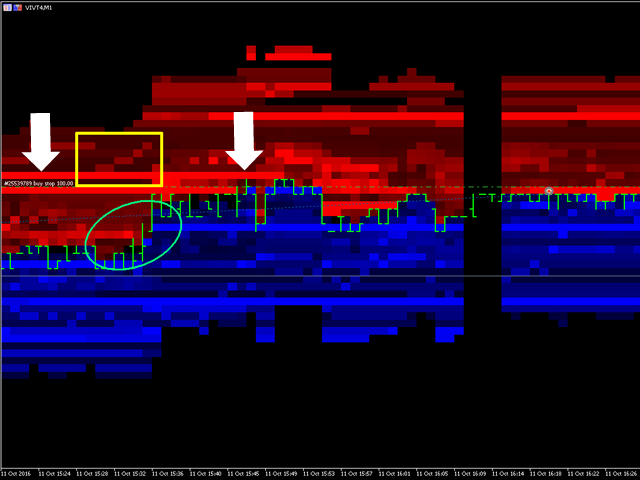
Вы можете понять, что сделал маркет-мейкер (ликвидность) и какие значения имеют "поддержка" и "сопротивление" при ликвидности, легко используя его с объемом по цене, это должно быть лучшим решением для скальперских трейдеров.


Параметры индикаторов

DOMSymbol - символ Dom для отображения, пустой = текущий.

otherSymbolBID - построить ставку на другой символ.

clrBID - цвет ставки. -> Не работает, будущее развитие

volumeMinBID - BID Min Volume, 0 = inputMinVolume.

otherSymbolASK - заговор другого символа ASK.

clrASK - спросите цвет. -> НЕ РАБОТАЮЩЕГО, ПЕРСПЕКТИВЫ РАЗВИТИЯ

volumeMinASK - задать минимальный уровень громкости, 0 = inputMinVolume.

inputMaxVolume - максимальная глубина объема рынка.

inputMinVolume - минимальная глубина объема рынка.

includeMinMaxAtColorScale - масштабный цвет, основанный на максимальном/минимальном объеме.

calcMode - тип тома.

calcOnTimer - принудительный пересчет по таймеру (1 секунда).

salveToFile - сохранение DOM в файлы.

readFromFile - чтение из файла.

readFromDate - чтение с даты начала файла.

maxMinutes - сохранить последние объекты X минут.

removeOnDeinit - удаление DOM-объектов при деинициализации.

calcBuffers - расчет буферов

scaleBIDCoeff - BIDCoeff Reescale

scaleASKCoeff - ASKCoeff Reescale

divMicroPricePerBID - разделять микро цена за заявку

      Рекомендуем также
      Профиль Рынка (Market Profile) определяет ряд типов дней, которые помогают трейдеру распознать поведение рынка. Ключевая особенность - это область значений (Value Area), представляющая диапазон ценового действия, в котором произошло 70% торговли. Понимание области значений может помочь трейдерам вникнуть в направление рынка и установить торговлю с более высокими шансами на успех. Это отличное дополнение к любой системе, которую вы возможно используете. Blahtech Limited представляет сообществу Me
      The best time to trade Using this Indicator is when the time reach exactly hour,half,45 minutes,15 minutes and sometimes 5 minutes.. This indicators is helpful to those who trade boom and crash indecies.How to read this indicator first you'll see Blue allow and Red allow all these allows used to indicate or to detect the spike which will happen so the allow happens soon before the spike happen.This indicator works properly only in boom and crash trading thing which you have to consider when
      Market Profile MetaTrader System  — is a classic Market Profile implementation that can show the price density over time, outlining the most important price levels, value area, and control value of a given trading session. This indicator can be attached to timeframes between M1 and D1 and will show the Market Profile for daily, weekly, monthly, or even intraday sessions. Lower timeframes offer higher precision. Higher timeframes are recommended for better visibility. It is also possible to use a
      Сейчас 147 долл. США (увеличиваясь до 499 долл. США после нескольких обновлений) - неограниченные учетные записи (ПК или Mac) Руководство пользователя + Обучающие видео + Доступ к приватному Discord-каналу + VIP-статус и мобильная версия + Лицензия на 5 ПК с неограниченным количеством аккаунтов и терминалов MT4. Сколько раз вы покупали индикатор торговли с замечательными обратными тестами, доказательствами производительности на живых счетах и зашикарными цифрами и статистикой, но после испо
      Before installing the HeatMap indicator make sure you are using a broker that gives you access to the Depth of market (DOM) !! This indicator creates a heatmap on your chart allowing you to see the buy or sell limit orders easily and in real time. You have the possibility to change the setting and the colors of the HeatMap in order to adapt to all markets and all charts. Here is an example of a setting you can use with the NASDAQ100 on the AMPGlobal broker :  https://www.youtube.com/watch?v=x0
      Noize Absorption Index - is the manual trading system that measures the difference of pressure between bears forces and bulls forces. Green line - is a noize free index that showing curent situation. Zero value of index shows totally choppy/flat market.Values above zero level shows how powerfull bullish wave is and values below zero measures bearish forces.Up arrow appears on bearish market when it's ready to reverse, dn arrow appears on weak bullish market, as a result of reverse expectation.
      General Description In the simplest terms this is a contrarian intra-day scalping system. Built to try and let correct trades run as far as possible and flip the trade when indicated. The indicator looks at historical daily trading ranges to lay out levels at which it takes long and short positions based on the statistical levels. The indicator is built around index futures, mainly around S&P and the DOW but can be used an any futures contract mainly using AMP Futures to trade. The indicator is
      Индикатор Urgently создан для быстрого определения ситуации на рынке, отражает состояние рынка и сигнализирует о выгодных уровнях для открытия сделок. Рыночные условия меняются достаточно быстро, требуя постоянной калибровки торговых стратегий. Рекомендуется использовать совместно с любым из осцилляторов. Трендовый индикатор рынка форекс Urgently показывает направление тренда и точки входа. Он сглаживет колебания цены при формирования сигнала путем усреднения данных и сигнала только в определен
      Индикатор тренда Antique Trend - революционное решение для торговли по трендам и фильтрации со всеми важными функциями инструмента тренда, встроенными в один инструмент! Индикатор Antique Trend хорош для любого трейдера, подойдет любому трейдеру как для форекс так и для бинарных опционов. Ничего настраивать не нужно все отточено времинем и опытом, отлично работает на во время флета та и в тренде. Индикатор тренда Antique Trend это инструмент технического анализа финансовых рынков, отражающий
      Premium level - это уникальный индикатор с точностью правильных прогнозов  более 80%!  Данный индикатор тестировался более двух месяцев лучшими Специалистами в области Трейдинга!  Индикатор авторский такого вы больше не где не найдете!  По скриншотах можете сами увидеть точностью данного инструмента!  1 отлично подходит для торговли бинарными опционами со временем экспирации на 1 свечу. 2 работает на всех валютных парах, акциях, сырье, криптовалютах Инструкция: Как только появляется красная стре
      Orders SL and TP Values Show is an indicator that shows the values of Profit and Loss over the lines in the main chart. In addition, the distance in points will be shown. In the current version, the code has been remodeled and improved, now offering new options and features such as: Option to include swape values to more precise calculation of your order StopLoss and Takeprofit values. (Activated by default) Option to include the ticket number on the left of price value. This is useful to identi
      Quick deals EA
      Aleksandr Slavskii
      Горячие клавиши плюс клик левой кнопки мыши на графике. Советник открывает сделки, выставляет лимитные и стоповые ордера, удаляет ордера и закрывает позиции, также  делает реверс  открытых позиций, выставляет прописанные в настройках стоп лосс и тейк профит. (реверс только на неттинговых счетах) При запуске советника можно посмотреть подсказку как действует советник при нажатии клавиши + клик на графике. Правее последнего бара, ниже цены Ctrl+ЛКМ  - OpenSell Правее последнего бара, выше цены
      Key level wedge MT5
      Presley Annais Tatenda Meck
      The   Key level wedge MT5   indicator automatically draws rising wedge pattern and falling wedge pattern for you on the chart. This pattern is really good when used as a confirmation entry at key support & resistance, supply & demand and reversal zones. Advantages  The   Key level wedge MT5   block DOES NOT RE-PAINT, giving you confidence when a signal appears and also helps when looking back.  The   Key level wedge MT5   includes an on/off button on the chart to easily keep the charts cle
      Индикатор Supply Demand использует предыдущее ценовое действие для выявления потенциального дисбаланса между покупателями и продавцами. Ключевым является определение зон с лучшими возможностями, а не просто вероятностей. Индикатор Blahtech Supply Demand обеспечивает функционал, не доступный ни в одной платформе. Этот индикатор 4 в 1 не только выделяет зоны с более высокой вероятностью на основе механизма оценки силы по множественным критериям, но также комбинирует его с мульти-таймфреймовым ана
      Индикатор строит текущие котировки, которые можно сравнить с историческими и на этом основании сделать прогноз ценового движения. Индикатор имеет текстовое поле для быстрой навигации к нужной дате. Параметры : Symbol - выбор символа, который будет отображать индикатор; SymbolPeriod - выбор периода, с которого индикатор будет брать данные; IndicatorColor - цвет индикатора; Inverse - true переворачивает котировки, false - исходный вид; Далее идут настройки текстового поля, в которое можн
      Market profile was developed by Peter Steidlmayer in the second half of last century. This is a very effective tool if you understand the nature and usage. It's not like common tools like EMA, RSI, MACD or Bollinger Bands. It operates independently of price, not based on price but its core is volume. The volume is normal, as the instrument is sung everywhere. But the special thing here is that the Market Profile represents the volume at each price level. 1. Price Histogram The Price Histogram
      Этот индикатор покажет вам значения TP и SL (в этой валюте), которые вы уже установили для каждого ордера на графиках (закрытые от линии транзакции/ордера), что очень поможет вам оценить вашу прибыль и убыток для каждого ордера. И он также показывает вам значения PIP. Показанный формат - «Валютные значения нашей прибыли или убытка / значений PIP». Значение TP будет отображаться зеленым цветом, а значение SL — красным. По любым вопросам или для получения дополнительной информации, пожалуйста,
      Provided Trend – это сложный индикатор формирования сигналов. В результате работы внутренних алгоритмов вы можете видеть на вашем чарте только три вида сигналов. Первый это сигнал на покупку, второй это сигнал на продажу и третий сигнал на выход с рынка. Параметры: CalcFlatSlow – Первый параметр управляющий главной функцией разбивки ценогого графика на волны. CalcFlatFast – Второй параметр управляющий главной функцией разбивки ценогого графика на волны. CalcFlatAvg - Параметр управляющий гран
      BoxChart MT5
      Evgeny Shevtsov
      5 (7)
      Рынок несправедлив, хотя бы потому, что всего лишь 10% игроков управляют 90% капитала. У рядового трейдера мало шансов, чтобы противостоять этим «хищникам». Но выход есть, необходимо всего лишь перейти на другую сторону, необходимо находиться в числе этих 10% «акул», научиться распознавать их намерения и двигаться вместе с ними. Объем - это единственный опережающий фактор, который безупречно работает на любом периоде и любом торговом инструменте. Сначала зарождается и накапливается объем, и толь
      This indicator has been developed to identify and display these trends quickly and easily, allowing you to see instantly, those currency pairs which are trending, and those which are not – and in all timeframes, with just one click. The 28 currency pairs are displayed as a fan as they sweep from strong to weak and back again, and this is why we call it the ‘currency array’. All 28 pairs are arrayed before you, giving an instant visual description of those pairs that are trending strongly, those
      This tool will perform Trailing stop loss and Break even management for orders. Helps you limit or reduce the time spend watching orders on the screen, especially when you need to go to sleep. Just add this EA to 1 chart, you can manage all pairs. You can filter orders by comment, magic number, and symbol. When Breakeven it can add shift/offset pips (to cover the commission...). You can try in strategy tester before purchase. The EA will add Buy and Sell alternately, so you can check the oper
      Value Chart Candlesticks
      Flavio Javier Jarabeck
      4.75 (8)
      The idea of a Value Chart indicator was presented in the very good book I read back in 2020 , " Dynamic Trading Indicators: Winning with Value Charts and Price Action Profile ", from the authors Mark Helweg and David Stendahl. The idea is simple and the result is pure genius: Present candlestick Price analysis in a detrended way! HOW TO READ THIS INDICATOR Look for Overbought and Oversold levels. Of course, you will need to test the settings a lot to find the "correct" one for your approach.
      FREE
      Fibonacci and RSI. Demo versión only works with GBPUSD. For full version, please, visit visit https://www.mql5.com/en/market/product/52101 The indicator is a combination of the Fibonacci and RSI indicators. Every time the price touches one of the fibonacci levels and the rsi condition is met, an audible alert and a text alert are generated. Parameters number_of_candles : It is the number of candles that will be calculated. If you put 100, the indicator will give you the maximum and min
      FREE
      TPO Profile MT5
      Kyra Nickaline Watson-gordon
      Definition : TPO is a Time Price Opportunity. Instead of using bars or candles with an Open, High, Low, and Close price, each "bar" in a Market Profile is represented by horizontal bars against the price It is called Market Profile terminology. In other words time-price-opportunity (TPO) profiles are histograms of how much time was spent at each price within the span of the profile. By using a TPO chart, you are able to analyze the amount of trading activity, based on time, for each price leve
      Одна из числовых последовательностей носит название - "Последовательность лесного пожара". Она была признана одной из самых красивых новых последовательностей. Её главная особенность заключается в том, что эта последовательность избегает линейных трендов, даже самых кратковременных. Именно это свойство легло в основу этого индикатора. При анализе финансового временного ряда этот индикатор старается отбросить все возможные варианты тренда. И только если это ему не удается, то он признает наличие
      Способ применения Pair Trading Station Рекомендуется использовать Pair Trading Station на таймфрейме H1 с любой валютной парой. Чтобы получить сигналы на покупку и продажу, следуйте указанным ниже инструкциям по применению Pair Trading Station в терминале MetaTrader. При загрузке Pair Trading Station на график индикатор оценит доступные исторические данные на вашей платформе MetaTrader для каждой валютной пары. В самой начале на графике отобразятся исторические данные, доступные для каждой валют
      License required to run all EAs created by Forex Forensics 101 LLC.  How to use: - Download from marketplace - Move to 'Indicators' folder, can not be in folders within the 'Indicators' folder Disclaimer: Forex Forensics 101 LLC is not affiliated with anyone selling an EA created through Forex Forensics 101 LLC. As such, the buyer is responsible for all wins and losses they may experience. Trading the forex market is high risk. You should always consult an expert before risking any capital. 
      Trend Trading - это индикатор, предназначенный для получения максимальной прибыли от трендов, происходящих на рынке, путем определения времени отката и прорыва. Он находит торговые возможности, анализируя, что делает цена во время установленных тенденций. [ Руководство по установке | Руководство по обновлению | Устранение неполадок | FAQ | Все продукты ] Торгуйте на финансовых рынках с уверенностью и эффективностью Прибыль от устоявшихся тенденций без проволочек Признать прибыльные откаты,
      Уникальность данного индикатора заключается в алгоритме учёта объёмов: накопление происходит   непосредственно за выбранный период  без привязки к началу дня. Последние бары можно исключить из расчёта, тогда текущие данные будут меньше влиять на  значимые уровни (объёмы),   образованные ранее. Для более точного расчёта по умолчанию используются данные с графика М1. Шаг распределения ценовых объёмов регулируется. По умолчанию правая граница отображения установлена на бар, соответствующий началу и
      [ MT4 Version ] Supply and Demand Multitimeframe Supply and Demand Multitimeframe is the first indicator in the market that combines multiple aspects like trading volume, price structure and momentum to identify Supply and Demand zones for every asset. The Supply and Demand indicator analyzes simultaneously up to 4 different TFs and represents their information in the current graph. Its interactive UI highlights everytime the price enters a Supply or Demand zone even if the zones are not visible
      С этим продуктом покупают
      note: this indicator is for METATRADER4, if you want the version for METATRADER5 this is the link:  https://www.mql5.com/it/market/product/108106 TRENDMAESTRO recognizes a new TREND in the bud, he never makes mistakes. The certainty of identifying a new TREND is priceless. DESCRIPTION TRENDMAESTRO identifies a new TREND in the bud, this indicator examines the volatility, volumes and momentum to identify the moment in which there is an explosion of one or more of these data and therefore the mome
      Bill Williams Advanced предназначен для автоматического анализа графика по системе " Profitunity " Билла Уильямса. Индикатор анализирует сразу четыре таймфрейма. Инструкция/Мануал ( Обязательно читайте перед приобретением ) Преимущества 1. Автоматически анализирует график по системе "Profitunity" Билла Уильямса. Найденные сигналы помещает в таблицу в углу экрана. 2. Оснащён трендовым фильтром по индикатору Аллигатор. Большинство сигналов системы рекомендуется использовать только по тренду.
      IVISTscalp5
      Vadym Zhukovskyi
      5 (3)
      Представляем вам индикатор iVISTscalp 5 , который не только уникален, но и эффективен в использовании при анализе торговых операциях. Этот индикатор основывается на временных данных и является результатом многолетнего опыта и глубокого анализа финансовых рынков. Индикатор iVISTscalp 5 отличный помощник для ручной торговли. Удобство, простота и визуализация. Все самое сложное спрятано внутри. Мы максимум упростили настройки и использование индикатора iVISTscalp 5 . Индикатор подходит для всех
      VTrende Pro
      Andrii Diachenko
      5 (1)
      VTrende Pro - МТФ индикатор для трендовой торговли с панелью индикации для МТ5 !!! - Подробное описание на русском языке под видео (на Youtube) - !!! Хотя сигналы индикатора VTrende Pro можно использовать, как сигналы полноценной торговой системы, рекомендуется применять их в связке с ТС Билла Вильямса. VTrende Pro - это расширенная версия индикатора VTrende . Отличие Pro версии от VTrende: - Временные зоны - Сигнал V - сигнал 1-2 волн Основная задача индикатора - определить точки изм
      Weis Wave with Alert MT5
      Trade The Volume Waves Single Member P.C.
      4.93 (15)
      Rental/Lifetime Package Options and Privileges  * For optimum results the yearly or lifetime package is suggested due to live training ! Rent Monthly Six Months   Yearly/Lifetime Weis Wave with Speed with Alert+Speed Index x x x Manual  x x x Quick Set up Video x x x Blog x x x Lifetime Updates x x x Setup and Training Material x x Free Rectangle Break Alert Tool      x Discord Access Channel "The SI traders" x 2-hour live methodology training x How to trade with it:    http://
      Индикатор предназначен для того, чтобы вовремя закрывать позиции по рынку. Например: досрочно фиксировать прибыль, если цена не достигла TakeProfit, а рынок разворачивается. Индикатор анализирует импульс, а не тренд. О тренде никакой информации он не дает. Индикатор хорошо подходит для поиска дивергенции. Индикатор Ershov 38 Parrots динамически подстраивается под рынок и выявляет импульсы движения цены средней и высокой амплитуды. На мелкие скачки цены почти не реагирует.  Принципиальное о
      Это, пожалуй, самый полный индикатор автоматического распознавания гармонического ценообразования, который вы можете найти для платформы MetaTrader. Он обнаруживает 19 различных паттернов, воспринимает проекции Фибоначчи так же серьезно, как и вы, отображает зону потенциального разворота (PRZ) и находит подходящие уровни стоп-лосс и тейк-профит. [ Руководство по установке | Руководство по обновлению | Устранение неполадок | FAQ | Все продукты ] Он обнаруживает 19 различных гармонических цен
      RAD CRITICAL LEVES RAD indicator tracks “Relevant Volume” in real time, identifying accumulation and distribution processes, projecting them in the chart as SUPPORT or RESISTANCE zones. Natural   support   and resistance levels are generated by Volume Accumulation and Distribution processes. As these processes evolve, levels at which the relevant volume in the market place is positioned, become difficult areas to cross upwards or downwards. By using this information, traders can identify very s
      «Пиранья» - автономная торговая система, определяющая уровни перекупленности и перепроданности на графике. Красная и синяя зоны отображают уровни перекупленности и перепроданности соответственно. Вход в сделку обозначен стрелками: стрелка вниз в красной зоне для "sell" и стрелка вверх в синей зоне для "buy". Уровень Тейк профита обозначен зеленой средней скользящей. Важные особенности: Регулировка уровня Тейк профита при изменении положения зеленой средней скользящей. Возможность усреднения пр
      Big Player Range
      Thalles Nascimento De Carvalho
      5 (2)
      Добро пожаловать в индикатор "BigPlayerRange" - инструмент технического анализа, разработанный для выявления значительных областей интереса финансовых учреждений на рынках. Этот индикатор обеспечивает точный анализ ценовых диапазонов, в которых крупные участники рынка проявляют значительную активность и интерес. Основные характеристики: 1. Картирование Областей Институционального Интереса: "BigPlayerRange" точно выделяет области графика, где финансовые учреждения проявляют сильную активнос
      ИНДИКАТОР, основанный на ИСКУССТВЕННОМ ИНТЕЛЛЕКТЕ, который генерирует возможные записи колл- и пут-опционов для бинарных опционов. Индикатор работает по 3 разным стратегиям: 1) считывая объемы, он посылает сигнал, когда цена должна развернуться 2) через расхождение между ценой и объемом он посылает сигнал, когда тренд должен продолжиться или развернуться. 3) благодаря сближению цены и объема он посылает сигнал о том, что тренд должен продолжиться. Индикатор работает на всех таймфр
      SMCpro MT5  Original Price  $440   ---  Currently Price  40% OFF  ( for unlimited use ) Hello World! Introducing.. SMCpro tool and Indicator for  MetaTrader 5 , a cutting-edge feature designed to revolutionize your trading experience. With innovative ICT Smart Money Concept, you gain unparalleled insight into market dynamics, empowering you to make informed trading decisions like never before. Built on the foundation of advanced algorithms and real-time data analysis, SMCpro tool and Indicat
      Tatino Super Signals is Non Repaint Indicator for Binary Option trading and Forex trading. Recommendations: Timeframe: All timeframes. For best results we recommend using it on M1, M5 and M15 timeframes. Currency pairs: All Pairs Account type: All Type Broker time: Any Brokers : Alls Binary Trading : Expired 1 Candle Buffer Buy=1, Sell=0, Entry Next Candle Recommended Forex trading stop loss : 15 pips Recommended  Forex tradingTake profit levels : 15 pips Specifications: Does not repaint  
      Технический индикатор Smooth Price (Гладкая цена) используется для построения гладкой линии максимально приближенной к цене торгового инструмента и служит для устранения ее шумовых составляющих. Индикатор является частью торговой системы Monarch, но здесь он представлен как самостоятельный инструмент технического анализа. Основой индикатора служит кластерный цифровой фильтр , который, в отличии от проекта ClusterSMA , применяется непосредственно к ценовой таймсерии. Smooth Price не перерисовывае
      Teniendo una entrada de precios suavizados, los cuales son procesador por un ZigZag en tiempo real, dando como resultado un suavizador ajustado a un ZigZag. Con valores de entrada (periodo) mayores se vuelve un poco lenta en M1,, Ideal para H1, H4, D1 Trabaja bien con otros suavizadores, ya que su intersección es ideal Al iniciar empiza con mayor precisión desde el momento de activación, siendo el historial (anterior) de referencia ----------------------------------------------------------------
      Recommended TimeFrame >= H1. 100% Non Repainted at any moment.  Use it carefully, only with Trend Direction. Trading Usage: 2 Variants: as Range System or as BreakOut System (Both Only With Trend Direction)::: (Always use StopLoss for minimise Risk); [1] as Range System: (Recommended) in UP TREND:  - BUY in Blue Line , then if price goes down by 50 points (on H1) open Second BUY.   Close in any Profit you wish: TrailingStop(45 points) or Close when Price touches upper Gold Line. in DOWN TR
      Super Suavizador
      Cesar Juan Flores Navarro
      Indicador en MQL5 que obtiene el promedio de 10 EMAS que son alineadas y procesadas según Fibonacci luego el promedio es suavizado"  Se ingresa un número de 2 a N que multiplica los EMA-Fibonacci y por consiguiente aumenta los fibonacci, resultando un promedio.   Se ingresa un número que suaviza los EMA-Fibonacci. Considerando los números 1/1 seria la suavización minima. Considerando los números 3/5 seria la suavización media. Considerando los números 10/30 seria la suavización alta.....etc
      Entry Pro
      Bartlomiej Tadeusz Tomaja
      Entry Pro Indicator is a powerful multi-functional trading tool designed to increase your market entry accuracy. It combines the power of several key market trend indicators, including ATR Trailing Stop and both fast and slow EMA, to provide comprehensive market insight. It offers easy-to-interpret market entry signals represented by colored arrows. Also, it's fully customizable, allowing you to adjust ATR and EMA periods to suit your trading strategy. Trend filters and alerts can be toggled on
      WanaScalper
      Isaac Wanasolo
      1 (1)
      A scalping indicator based on mathematical patterns, which on average gives signals with relatively small SL, and also occasionally helps to catch big moves in the markets (more information in the video) This indicator has three main types of notifications: The first type warns of a possible/upcoming signal on the next bar The second type indicates the presence of a ready signal to enter the market/open a position The third type is for SL and TP levels - you will be notified every time price r
      Классификатор силы тренда. Показания на истории не меняет. Изменяется классификация только незакрытого бара. По идее подобен полной системе ASCTrend, сигнальный модуль которой, точнее его аппроксимация в несколько "урезанном" виде, есть в свободном доступе, а также в терминале как сигнальный индикатор SilverTrend . Точной копией системы ASCTrend не является. Работает на всех инструментах и всех временных диапазонах. Индикатор использует несколько некоррелируемых между собой алгоритмов для класси
      Индикатор определяет паттерны гармоник (XABCD) согласно разработок H.M.Gartley ( "Profits in the Stock Market" , 1935г). Проецирует D-point -- как точку в перспективной проекции (в настройках указать параметр ProjectionD_Mode = true ). Не перерисовывает. На закрытии бара рабочего тайм-фрейма, если в течение Patterns_Fractal_Bars баров последняя обнаруженная точка паттерна не сдвинулась - возникает стрелка на графике (в направлении предполагаемого движения цены). С этого момента стрелка остается
      Currency Index Watcher - это простой инструмент для тех, кто хочет торговать на рынке Форекс, используя индексы валют . После завершения расчетов показываются конкретные торговые возможности , и подаются сигналы по ним. Currency Index Watcher можно настроить непосредственно с панели управления : Индексы 8 валют: EUR, USD, GBP, JPY, CHF, AUD, CAD, NZD с возможностью выбирать для анализа индексы и синтетические пары. Выбор возможностей осуществляется в соответствии со следующими критериями: Minima
      SmartTrendMt5 - индикатор тренда и торговых сигналов, основанный на принципе совмещенного анализа расчетных опорных точек внутри канала Келтнера. Индикатор формирует в отдельном окне канал Келтнера (по умолчанию линии красного цвета и линия синего цвета - середина канала), а также гистограмму расчетных опорных точек для каждой свечи (по умолчанию столбцы гистограммы желтого цвета). Индикатор устанавливается обычным образом на любой торговый символ с любым временным интервалом. Преимущества инд
      If there is only one MT5 indicator you ever buy for trading forex – this has to be it. Your success as a forex trader depends on being able to identify when a currency or currency pair is oversold or overbought. If it is strong or weak. It is this concept which lies at the heart of forex trading. Without the Quantum Currency Strength indicator, it is almost impossible. There are simply too many currencies and too many pairs to do this quickly and easily yourself. You need help! The Quantum C
      Forex Relative Performance indicator This indicator calculates the relative strength of major currencies against the US dollar. The basic idea behind this indicator is "to buy strong currency and to sell weak currency". This indicator allows you to quickly identify the best forex pair to trade according to your trading style (Intraday, Scalping, Swing, or Long Term)
      The latest most requested Binary Options arrow indicator in the Garuda Signals product line is now on MT5! Binary options signal based on multiple time frame cross over analysis. Gets confirmation from the most consistent signals known to man; Ichimoku, SMA, Bollinger Bands; and also uses the 1 Hour time frame as trend confirmation , so you don't have to open up multiple chart and waste time. - Can be used for all time frames up to 1 hour, but is most POWERFUL for 1 and 5 min options. - Place yo
      SuavizadorDePrecio
      Cesar Juan Flores Navarro
      Funciona identificando picos de máximos y mínimos, para luego eliminarlos haciendo una linea o curva, pudiendo el usuario ingresar el valor de que tanto puede suavizar. Nos facilita poder ver la tendencia así como ver el cruce que puede hacer con otros indicadores, mostrando a simple vista los inicios y salidas de una tendencia u operación. Así también facilita la visualización de subidas y bajadas.
      Indicador en base a la pendiente de la linea de precio, dibuja una línea de color cuando sube a base de los precios que previamente has sido procesados o linealizados, y cuando baja la pendiente la linea linealizada toma otro color. En este caso se a considerado 6 lineas de diferentes procesos desde pendientes largas hacia las cortas, observándose que cuando coincidan las pendientes se produce un máximo o mínimo, lo que a simple vista nos permitirá hacer una COMPRA O VENTA.
      Description Very precise patterns to detect: entry signals as well as breakout, support and resistance reversal patterns. It points out zones in which, with a high probability, institutional orders with the potential to change the price’s direction and keep moving towards it, have been placed. Support:   We create great tools for the entire trading community. Most of them are free. If you believe in what we do  Support Us Here.   KEY LINKS:   Indicator Manual  -  All Products  How is this ind
      Индикатор Coefficient Of Determination (COD) представляет собой значение коэффициента детерминации или квадрат коэффициента корреляции между зависимой переменной — ценой и объясняющей переменной — тиковым объемом. Что это дает нам на практике? COD отлично распознает кульминацию трендовых движений, что позволяет подбирать оптимальные точки и ловить развороты рынка. Как использовать индикатор: Наиболее популярная торговая стратегия строится совместно с трендовым индикатором Moving Average (MA), пе
      Другие продукты этого автора
      News Vertical Bar
      Roberto Spadim
      4 (1)
      This indicator get all events/countries/values from metatrader terminal calendar and print veritical lines at chart, you can configure anything with inputs (string to filter names/url/code/countries/currencies), select period to filter, nws interval before and after current time (every information about time is seconds based), you can filter importance, type, sector, unit, multiplier, impact, timemode, frequency, forecast/previous % increase/decrease interval, actual/previous % increase/decrease
      FREE
      Export Deals to CSV - Excell File location: HistoryDeals/<SERVER>/<LOGIN>.<DATETIME>.csv Works as an Script, reading all DEALS in history and exporting it as a plain text CSV file There's no option to change. There's no WebRequest. There's no DLL use. I need to write 300 characters to allow this product being exposed at MQL5 market place. It's simple to use, plug it in graph and wait completion.
      FREE
      Индикатор отправляет сообщение (уведомление), электронное письмо и воспроизводит аудиосигнал при достижении лимита (покупка/продажа), лимит-стопа (покупка/продажа), тейк-профита, стоп-лосса или стоп-аута. Пользователь может изменить имя звукового файла и настроить получение уведомлений. Только один индикатор можно запустить на одном счете/логине. Параметры soundFile - звуковой файл Сохраните файл в папке терминала, например: " C:\Program Files\MetaTrader 5\Sounds\Order Executed.wav ". Как у
      Teclado trader, é uma BIBLIOTECA que você pode chamar no OnChartEvent para abrir posição de compra/venda/zerar, os botões padrões são: V = venda C = compra Z = zerar posições a mercado S = zerar posições opostas e depois a mercado X = zerar posições opostas Além da função de teclado, é possível mostrar os estados do ExpertAdvisor usando o MagicId, com informação de: lucro mensal, semanal, diario, e posição aberta, para isto use o OnTick, ou qualquer outro evento (OnTimer / OnTrade / OnBookEv
      From https://en.wikipedia.org/wiki/Fractional_calculus: Fractional calculus  is a branch of  mathematical analysis  that studies the several different possibilities of defining  real number  powers or  complex number  powers of the  differentiation operator   D This indicator execute fracional differentiation on data, you can select the differentiation D value and execute some tweaks like execute Log(value)  before difefrentiation or execute a window normalization on last [diffNormalizeWindo
      It's a simple indicator that execute GARCH(1,1) function, it can be used with basis stocks and options, when garch is bellow implied volatility probably implied volatility tend to goes down, and when garch is higher than implied volatility probably implied volatility goes up. Can be used with options trading when buying / selling volatility, for example, buy ATM put and call when garch is higher than implied volatility and sell when it's lower.
      This indicator works in Brazil market, it should be used on options symbols. the indicator create 8 buffers, Delta, Gamma, Vega, Rho, Theta, Time(working days), Implied Volatility, R (interest rate), and can be used to view greeks over time. It shouldn't be used to trade, since it's cpu intensive, it's just a historic viewer, you can see what happened with greeks and teach friends :)
      This indicator implements the High Low Volatility Estimator based on Advances in Financial Machine Learning 2018 - Marcos Lopez de Prado, page 284. It's a robust estimator using High/Low values from past bars (configurable). It's robusto to Gaps (open/close of days to stock markets) since it's using high/low ration and not the close price. It's interesting when you need to avoid trading at a specific level of volatility
      This indicator implements the Rool Model Estimator based on Advances in Financial Machine Learning 2018 - Marcos Lopez de Prado, page 283. It's a spread estimator using trade by trade (copytick) values from last trades (configurable). It works with low liquidity markets as a robust estimator considering the covariance between price diferences. It's interesting when you need to track spread changes
      This indicator implements the Corwin and Schultz Estimator based on Advances in Financial Machine Learning 2018 - Marcos Lopez de Prado, page 284. It's a spread estimator using high/low and a rolling window (configurable). It works with low liquidity markets as a robust estimator. It's interesting when you need to track spread changes, more information can be found at Marcos book.
      In Kyle’s model, the variable captures price impact. Illiquidity increases with uncertainty about v and decreases with the amount of noise Kyle argues that the market maker must find an equilibrium between profit maximization and market efficiency. This indicator is based on Advances in Financial Machine Learning 2018 - Marcos Lopez de Prado book, Page 288.
      Amihud studies the positive relationship between absolute returns and illiquidity. In particular, he computes the daily price response associated with one dollar of trading volume, and argues its value is a proxy of price impact. Despite its apparent simplicity, Hasbrouck [2009] found that daily Amihud’s lambda estimates exhibit a high rank correlation to intraday estimates of effective spread.  This indicator is based on Advances in Financial Machine Learning 2018 - Marcos Lopez de Prado book,
      Hasbrouck follows up on Kyle’s and Amihud’s ideas, and applies them to estimating the price impact coefficient based on trade-and-quote (TAQ) data. Consistent with most of the literature, Hasbrouck recommends 5-minute time-bars for sampling ticks.  This indicator is based on Advances in Financial Machine Learning 2018 - Marcos Lopez de Prado book, Page 289. --- This code can run slow when using big timeframes, it use copytick to get dollar volume, in a next version I will implement a temporary i
      Easley et al. [2011] proposed a high-frequency estimate of PIN, which they named volume-synchronized probability of informed trading (VPIN). This procedure adopts a volume clock, which synchronizes the data sampling with market activity. For additional details and case studies of VPIN, see Easley et al. [2013]. A number of studies have found that VPIN indeed has predictive power: Abad and Yague [2012], Bethel et al. [2012], Cheung et al. [2015], Kim et al. [2014], Song et al. [2014], Van Ness et
      Easley et al. study the frequency of trades per trade size, and find that trades with round sizes are abnormally frequent. For example, the frequency rates quickly decay as a function of trade size, with the exception of round trade sizes {5, 10, 20, 25, 50, 100, 200,…}. These authors attribute this phenomenon to socalled “mouse” or “GUI” traders, that is, human traders who send orders by clicking buttons on a GUI (Graphical User Interface). In the case of the E-mini S&P 500, for example, si
      A useful feature may be to determine the normal frequency of round-sized trades, and monitor deviations from that expected value. The ML algorithm could, for example, determine if a larger-than-usual proportion of round-sized trades is associated with trends, as human traders tend to bet with a fundamental view, belief, or conviction. Conversely, a lower-than-usual proportion of round-sized trades may increase the likelihood that prices will move sideways, as silicon traders do not typically hol
      This script use DIDI+BB indicators and display alerts, send mail, send notifications, and play sounds. Scanner can monitor market watch using  ***MARKET***  as symbol name, with  all timeframes Inputs: media_lenta=3 media_base=8 media_longa=20 bb_periodo=20 bb_shift=0 bb_deviation=1.96 symbols - Symbol list, separated by ;   when using ***MARKET*** symbols from marketwatch will be included wait_interval_between_signals - Seconds between signals, default =60, but high frequency signals should red
      This indicator represent option and basis values as a tax, using this formula: Tax = ( ( strike / ( basis - option ) ) - 1 ) * 100 It's not time based (don't use time to expire information)  You can set a fixed strike value, and a fixed basis symbol if needed. Some exchanges/brokers don't provide this information at marketdata and that's the only method to use this information when not provided.
      This Service, export the account Orders/History Orders/Deals/Position on each new change. It save at a common folder with path = <DATE>\\<Server Name>.<Login>.<DATE>.<filetype>.csv Each file type have an header You can use it to receive OMS changes and source SQL Servers outside metatrader with bash scripts or others tools, each time the file change you can read it and get new updates, it works using SharedRead option when opening/flock the file.
      Фильтр:
      Dirtmitch
      64
      Dirtmitch 2022.03.30 15:24 
       

      Does absolutely nothing

      Yevgeniy Koshtenko
      2149
      Yevgeniy Koshtenko 2021.03.24 20:57 
       

      Дерьмо, не запускается

      Jocelyn
      385
      Jocelyn 2020.09.11 17:58 
       

      The author doesn't reply. Avoid it.

      Ответ на отзыв
      Версия 1.8 2017.12.20
      Новая версия (1.08)

      Включены коэффициенты BID/ASK (линейная регрессия от изменения цены и общего объема ордеров)
      Добавлена микроцена (можно разделить на BID для отображения значений (0-1) в окне индикатора)
      Imbalance ( (bid-ask)/(bid+ask) )
      Версия 1.7 2017.09.15
      Исправлена ошибка, Save бесконечно сохраняло, Load бесконечно загружало.

      Добавлены новые параметры, позволяющие отображать информацию с другого символа (полезно для срочного рынка, где имеются "мини" и "полные" контракты по одинаковому базовому символу) и ограничивать количество объектов на графике (производительность)
      Версия 1.3 2017.08.15
      Добавлена возможность сохранения/чтения данных, смешивания цвета фона, и параметр минимального/максимального объема. Эти функции позволяют сохранять/считывать значения и "отфильтровывать" малые объемы в стакане цен.