MAM Forecast Indicator
- Индикаторы
-
Matei-Alexandru Mihai
 Algorithmic Trader & EA Developer
10+ years in algo trading, creating MT5/MT4 systems built on discipline, not hype. My focus: indices & FX, smart trend/volatility filters, adaptive risk control, and profit-only exits. - Версия: 1.0
Overview
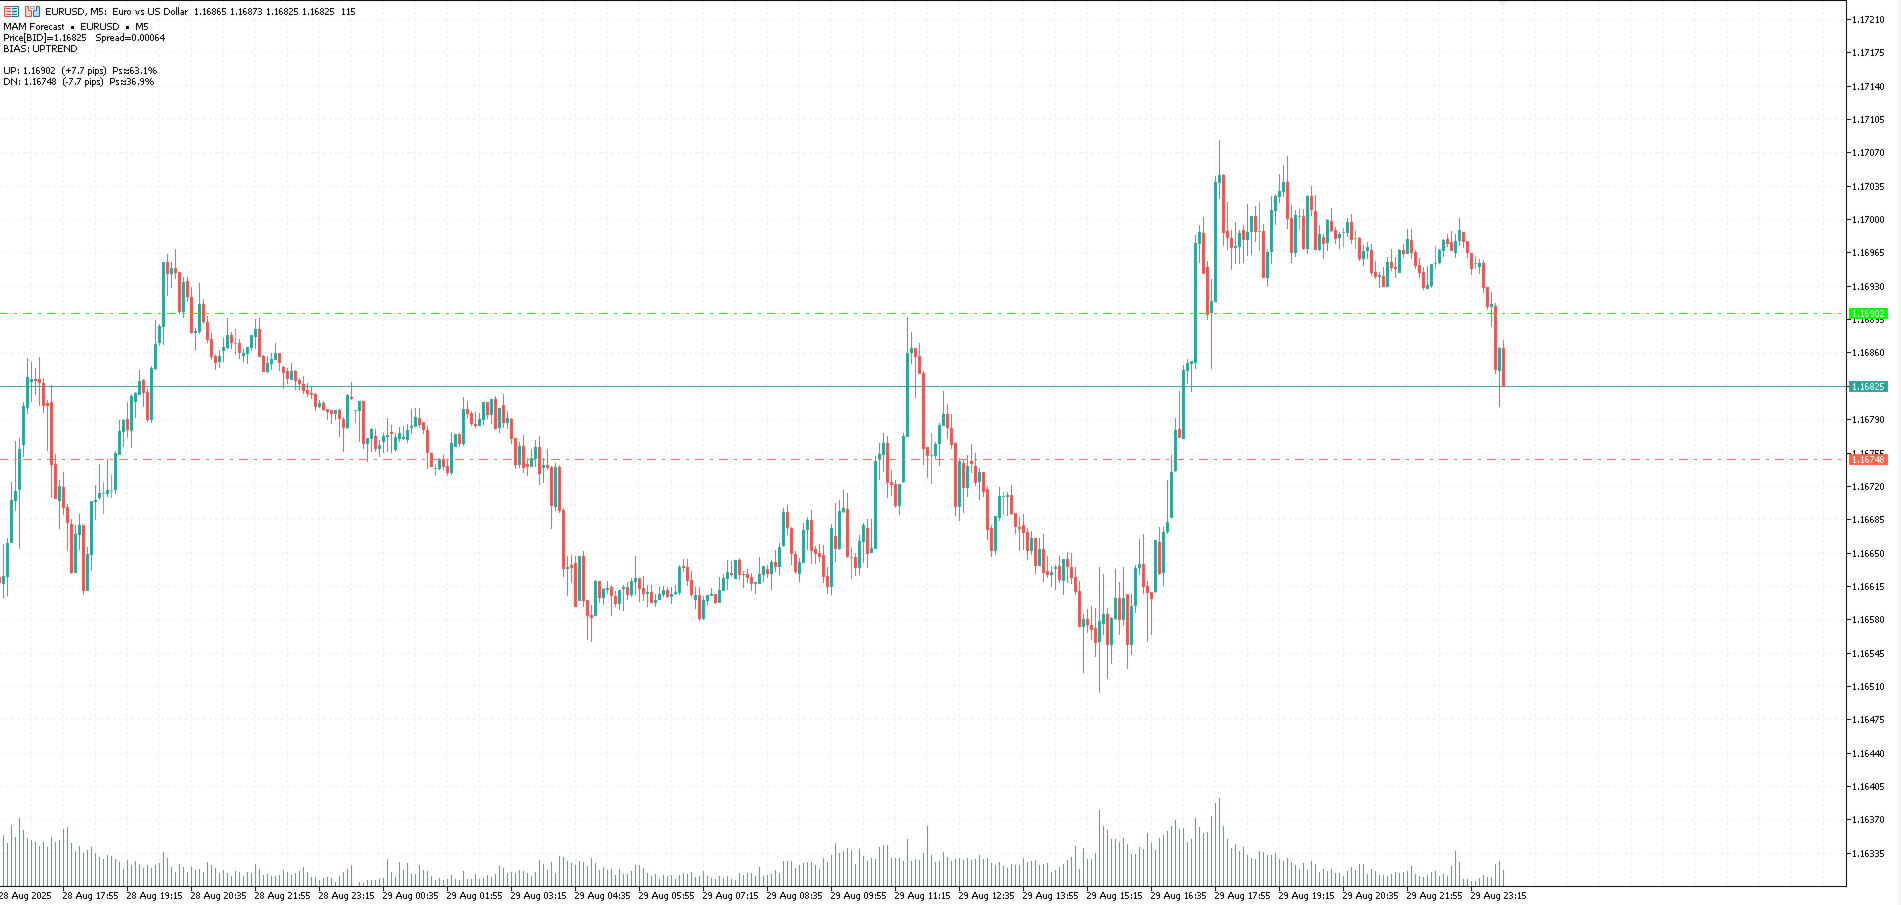
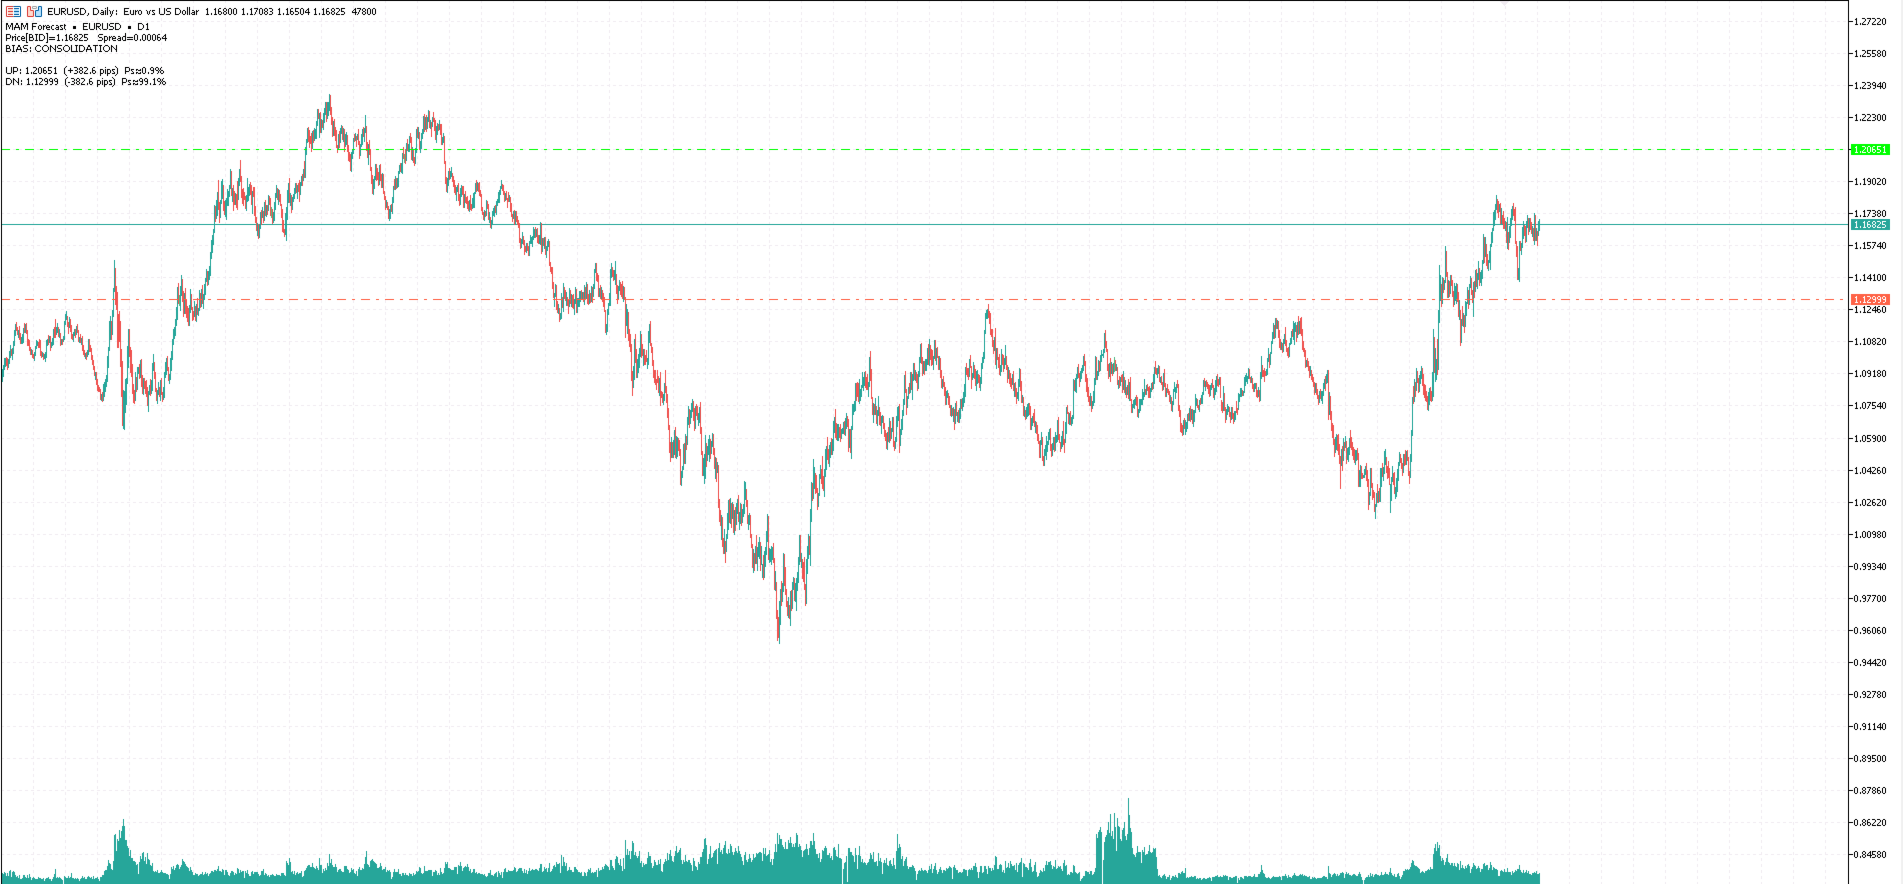
MAM Forecast is an indicator designed to replace guesswork with probabilities. It generates two adaptive levels—UP and DN—along with probabilities that always sum to 100%, giving you a clear idea of which level price is more likely to reach within the chosen horizon.
Key Features
-
Displays UP (upper) and DN (lower) adaptive levels calibrated to market volatility.
-
Shows touch probabilities (e.g., 62% vs 38%) for likelihood within the defined horizon.
-
Clean, informative HUD indicates symbol, timeframe, bias, spread, and distances to levels.
-
Bias labeling (UPTREND, DOWNTREND, CONSOLIDATION) based on simple trend logic or drift.
-
Scalable across timeframes with independent rendering so multiple charts stay uncluttered.
-
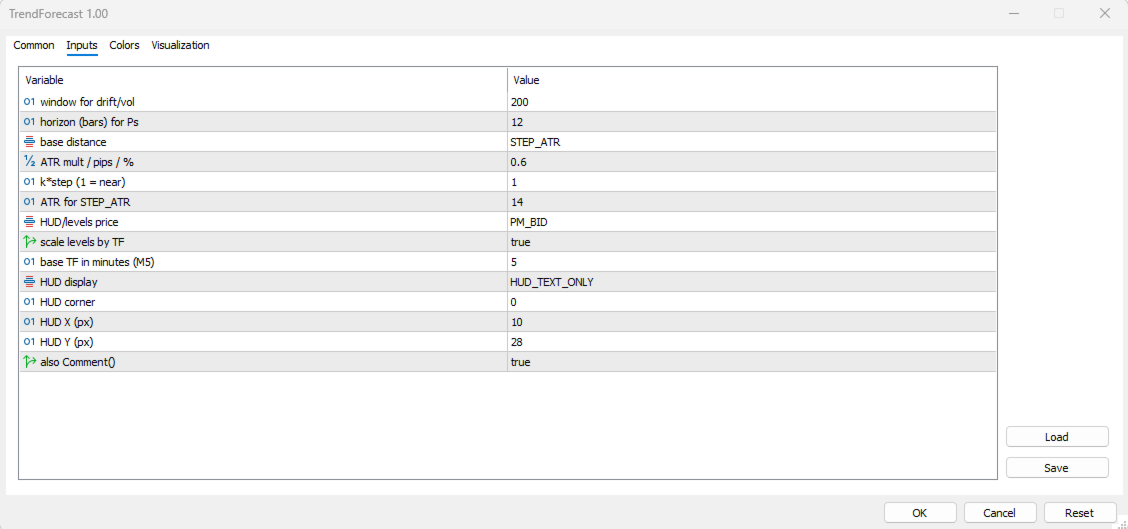
Parameter control includes distance model type, step values, horizon length, price source, and HUD style.
-
Designed to support a variety of strategies: trend following, mean reversion, breakout planning, or risk placement based on level probabilities.
Usage Applications
-
Use as context for entries/exits—e.g., favour touching side with higher probability.
-
Optimise grid or mean reversion placements where touch odds justify them.
-
Interpret trend bias and divergence as decision context, not absolute signals.
Input Parameters
-
Distance Model: Options include ATR, Pips, or Percentage with adjustable scale.
-
Horizon: bars look-ahead window to calculate probabilities.
-
Price Source & Scaling: Choose between Bid/Ask/Mid/Last; TF scaling adjusts level widths automatically.
-
HUD Display: Options for text-only, boxed panel, or fallback to terminal comments.
Practical Notes
-
Tweak StepValue (e.g., 0.5–0.8) for desired sensitivity.
-
Adjust Horizon according to timeframe—e.g., 8–20 for M5 scalping, 8–12 for H1 swings.
-
Use probabilities as guidance, not as guaranteed triggers.