Support and Resistance Flexible Bars

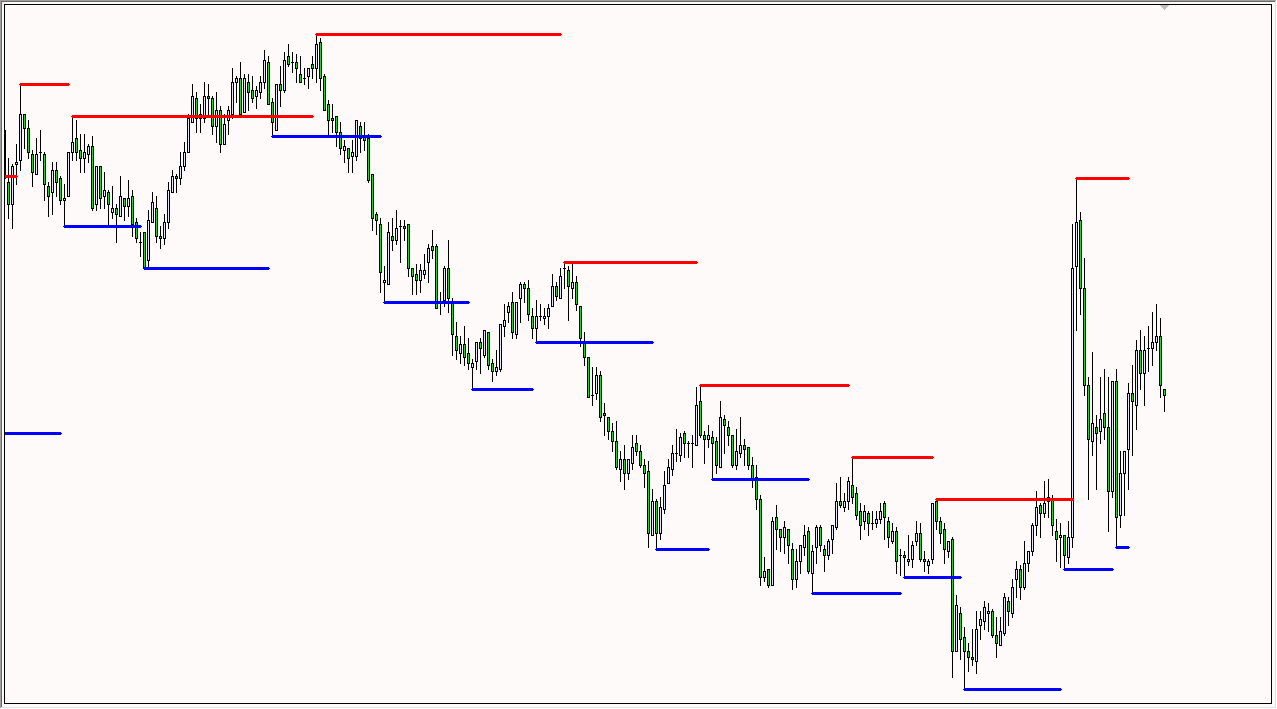
Indicator   shows "Support" and "Resistance" lines (these lines are drawn using the DRAW_LINE drawing style - that is, they are not graphic objects).

A search for new minimums and maximums is performed to the left and right of the "signal bar" - the "signal bar" is the conventional middle of each new construction.

Why is the word Flexible in the name of the indicator? Because we have the possibility to specify different number of bars to the left ('Left Bars') and to the right ('Right Bars') of the "signal bar".

Indicator lines are drawn on the chart from the "signal bar" to the right on the "Right Bars" bars.

Features :

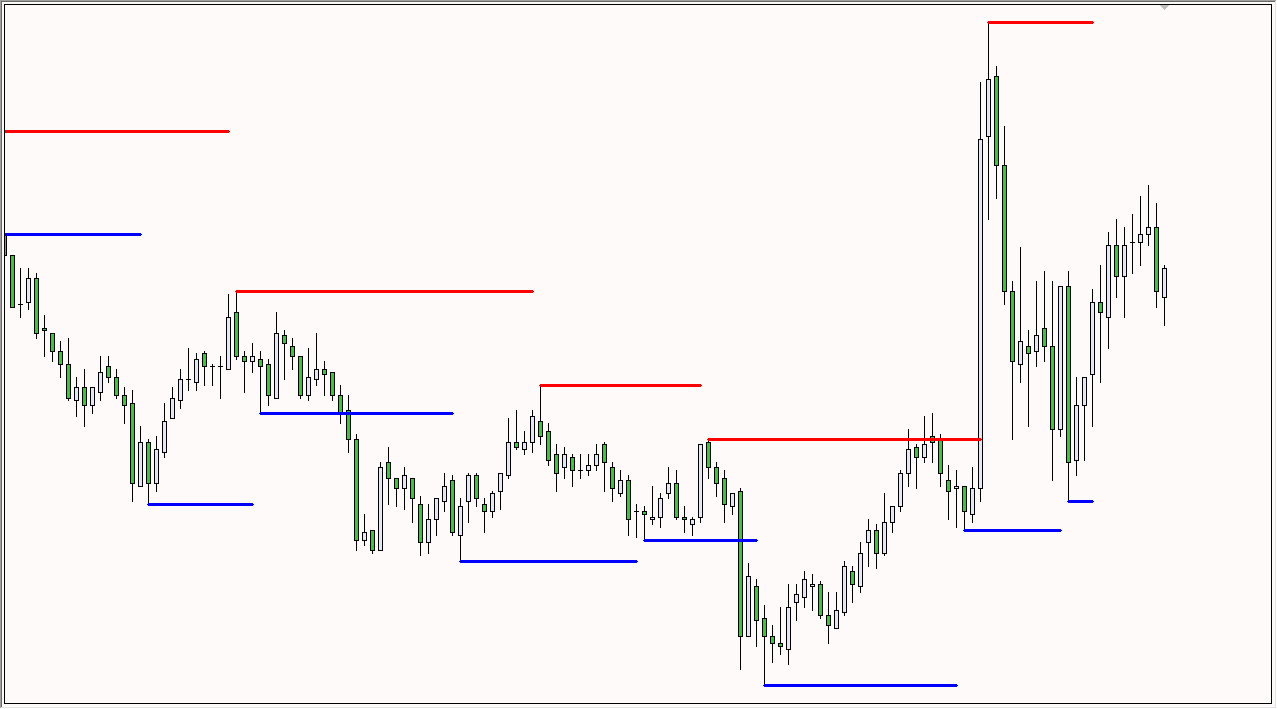
For a more beautiful display in the indicator, two "Support" buffers and two "Resistance" buffers are used (this technical solution is related to the limitations of drawing styles in MQL5).

What may appear in the future :

Sound alert or (and) new indicator buffers (Arrow).

How to use the indicator :

This indicator was created primarily for manual trading, so the user only needs to monitor the two indicator buffers "Support" and "Resistance", as well as the current price. Particular attention should be paid to the moments when the price breaks through the indicator line and then returns (after several bars).


Рекомендуем также
Astra TMA Channels – Adaptive Multi-Timeframe Trading Bands Astra TMA Channels is a next-generation indicator that builds intelligent adaptive channels around price using the Triangular Moving Average (TMA) . Unlike common Bollinger or Keltner Bands, Astra’s channels are tighter, smoother, and directly mapped to price closes – ensuring the middle line always hugs price action. This makes Astra an excellent tool for trend following, reversal trading, and multi-timeframe confluence strategies
Pivot Points Classic – L’indicatore essenziale per ogni trader tecnico Questo indicatore disegna automaticamente i livelli di Pivot Point più utilizzati dai trader professionisti, con supporto completo a 4 metodi di calcolo:   Metodi supportati : • Traditional • Fibonacci • Woodie • Camarilla   Caratteristiche principali :  Calcolo su timeframe superiore (multi-timeframe)  Visualizzazione chiara dei livelli P, R1, R2, R3, S1, S2, S3   Etichette dinamiche con nome e valore del livello  Colori per
FREE
NOTE: Turn Pattern Scan ON This indicator identifies Swing Points, Break of Structure (BoS), Change of Character (CHoCH), Contraction and Expansion patterns which are plotted on the charts It also comes with Alerts & Mobile notifications so that you do not miss any trades. It can be used on all trading instruments and on all timeframes. The non-repaint feature makes it particularly useful in backtesting and developing profitable trading models. The depth can be adjusted to filter swing points.
FREE
Индикатор   Haven FVG   — это инструмент для анализа рынков, который позволяет выделять области неэффективности (Fair Value Gaps, FVG) на графике, предоставляя трейдерам ключевые уровни для анализа цены и принятия торговых решений. Другие продукты ->  ЗДЕСЬ Основные особенности: Индивидуальные настройки цветов: Цвет для бычьего FVG   (Bullish FVG Color). Цвет для медвежьего FVG   (Bearish FVG Color). Гибкая визуализация FVG: Максимальное количество свечей для поиска FVG. Дополнительное удлинени
FREE
Volume Waves
Paulo Henrique Faquineli Garcia
One of the best tools for analyzing volume, Weis Wave was devised by David Weis to facilitate reading the directional flow. For the disciples of the Wyckoff method, this means an evolution, facilitating a predictive reading of the market, always looking for Accumulation and Distribution zones for traded assets. For better understanding, in this indicator we try to cover every reading of EFFORT (traded volume) versus RESULT (price change). Thus, you can apply the indicator on the chart twice to
AliPivot Points is a Meta Trader 5 Indicator that draws you the latest pivot points. You can choose from timeframes ranging from 1 Minute to 1 Month. Calculation methods for pivot points includes: Classic Pivot Points Camarilla Pivot Points Fibonacci Pivot Points Woodie Pivot Points You can personalize the line colors, style, and width to suit your preference. The indicator displays values on the right side of the chart. AliPivot Points values can also be utilized by developers for creating Expe
FREE
Are you tired of drawing trendlines every time you're analyzing charts? Or perhaps you would like more consistency in your technical analysis. Then this is for you. This indicator will draw trend lines automatically when dropped on a chart. How it works Works similar to standard deviation channel found on mt4 and mt5. It has 2 parameters: 1. Starting Bar 2. Number of bars for calculation The   starting bar   is the bar which drawing of the trend lines will begin, while the   number of bars for c
FREE
The Holy Grail MotherBar Indicator: Your Ultimate Path to Consistent Trading Profits   The Problem With Every Other Indicator You've Tried Let me guess - you've spent countless hours and hundreds (maybe thousands) of dollars on indicators that promise the world but deliver mediocre results. You've tried: · Lagging indicators that tell you what already happened · Over-optimized systems that work in backtests but fail in live markets · Complex setups with 20+ confusing lines on your chart · "S
Contact me for instruction, any questions! - Lifetime update free - Non-repaint - I just sell my products in Elif Kaya Profile, any other websites are stolen old versions, So no any new updates or support. Introduction Breakout Trend Scanner indicator works based on the Elliott Wave in technical analysis describes price movements in the financial market that are related to changes in trader sentiment and psychology and finds end of movement and breakout trend. The Elliott Wave pattern that is f
Renko Chart
Marcin Konieczny
3.56 (9)
Индикатор Renko Chart позволяет отображать графики "ренко" в окне индикатора. Тип графиков "ренко" показывает лишь движения цены, большие заданного (box size). Он помогает устранить шум и сосредоточиться на основных трендах. При построении графика время не учитывается, используются лишь ценовые движения. По этой причине графики "Ренко" не похожи на графики цены. Индикатор работает в 2 режимах: CLOSE - при построении графика "ренко" используются только цены Close; HIGH_LOW - при построении график
FREE
JCStatistics 简繁数据统计 1.显示账户信息:内容显示 交易员、账号、本金、杠杆、保证金、保证金比例、余额、净值; 日周月开盘余额、持仓收益、日收益、周收益、月收益; 收益为正时显示红色字体,收益为负时显示绿色字体; 日收益低于-5%时显示CircuitBreak; 总收益低于-10%时显示MarginCall; 2.显示统计数据: 收益(收益率)(交易量)(胜率) 5日数据;4周数据;12月数据; 3.当前标的统计:Symbol()收益(交易量)(胜率) 4.主流标的统计:收益(交易量)(胜率) 可以选择性显示账户信息、数据信息,调整显示颜色,调整字体,调整字体大小。 指标删除后自动删除桌面文字及背景。 备注:如遇使用问题,请联系邮箱:16692618587@qq.com.
FREE
The indicator to trade price consolidation is designed to identify price contraction and alerts us on formation. It does this by analyzing historical price data and identifying price action patterns. The algorithm then uses this information to mark the zone , potential targets and liquidity lines, giving us valuable insights into market behavior.  Traders can adjust parameters such as colors ,alerts types and how many  previously formed zones to display on chart . Furthermore, the indicator can
Clean, Accurate Fibonacci Levels — Always Ready When You Need Them. Auto Fib keeps precise Fibonacci retracement levels on your chart at all times. It automatically detects the latest impulse move and instantly plots wick-to-wick Fibonacci levels with perfect accuracy. Need a clean chart? Show or hide all levels with a single click. Two Detection Modes (Selectable in Inputs): Auto Mode — Automatically finds the latest valid trend leg and draws Fibonacci levels instantly. Manual Mode — Define a
FREE
Индикатор рисует дневные линии поддержки и сопротивления на графике, а также уровень Pivot (уровень разворота). Адаптирован под работу в МТ5 Стандартный таймфрейм для расчета уровней поддержки и сопротивления - D1. Можно выбрать другие таймфреймы, согласно Вашей стратегии (например для M1-M15 оптимальный таймфрейм для расчетов - H1) Обновлена функция расчета уровней поддержки и сопротивления, в данном варианте расчетов учитываются уровни фибоначи, соответственно для каждого из таймфреймов. Пара
FREE
Pivot eXtreme Pivot adalah level referensi penting yang digunakan trader untuk memetakan potensi support & resistance intraday maupun jangka lebih panjang. Dalam sistem ini, level pivot dikembangkan menjadi P (Pivot Point utama) , R1–R13 (Resistance) , serta S1–S13 (Support) . Pivot Point (P) Titik pusat utama, dihitung dari rata-rata harga (High + Low + Close) / 3 . Berfungsi sebagai acuan keseimbangan harga : Jika harga di atas P → tren cenderung bullish. Jika harga di bawah P → tren cenderung
FREE
Общее описание Этот индикатор — усовершенствованная версия классического канала Дончия с добавлением практических функций для реальной торговли. Помимо стандартных трёх линий (верхняя, нижняя и средняя), система определяет пробои и отображает их на графике стрелками, показывая только линию, противоположную текущему направлению тренда для более чистого восприятия. Индикатор включает: Визуальные сигналы : цветные стрелки при пробое Автоматические уведомления : всплывающие окна, push и email Фильтр
FREE
English VWAP Daily (Clean) is a simple and lightweight indicator that plots the classic Daily VWAP (Volume Weighted Average Price) directly on your MT5 chart. Features: Classic Daily VWAP calculation Supports real volume (if available) or tick volume Timezone offset option to match your broker’s server time Weekend merge option (merge Saturday/Sunday data into Friday) Clean version → no arrows, no alerts, only VWAP line VWAP is widely used by institutional traders to identify fair value, su
FREE
BTFX Pivot Points
Bradley Thomas Farrington
BTFX Pivot Points - это индикатор, который рассчитывает уровни поддержки и сопротивления на каждый день. Используя этот индикатор, уровни разворота указывают на четкие цели, к которым нужно стремиться.   Уровни сопротивления показаны фиолетовым цветом над серебряной разворотной линией.   Уровни поддержки   приведены в Orange   и могут быть найдены   ниже   серебро   поворот   линии .   Эти индикаторы очень хорошо работают при использовании с индикатором рассвета BTFX.   Для более подробного объя
This indicator plots any and every swing high or swing low on your chart. A swing high or low candle formation comprises of a minimum of 3 candles whereby the middle candles high/low is the highest or lowest point amongst the three candles. The direction (bullish/bearish) of the middle candle is irrelevant. Swings are very useful patterns that can be used to determine market structure as well as potential price reversal points on a chart. This indicator is derived from the Bill Williams Fracta
Cybertrade Double Bollinger Bands - MT5  The Bollinger Bands indicator shows the levels of different highs and lows that a security price has reached in a given duration and also their relative strength, where the highs are close to the upper line and the lows are close to the lower line. Our differential is to present this indicator in a double form, with the availability of its values ​​to simplify automation. It works on periods longer than the period visible on the chart. All values ​​are
FREE
Данный индикатор рисует линии тренда на графике. У индикатора есть шесть входных параметров. Пользователь может выбрать вид линий. При использовании нескольких копий индикатора вид линий должен отличаться. Пользователь может задать толщину и цвет линий, а также глубину - этот параметр определяет, какие пики и впадины будут использоваться. Например, если ввести Depth=10, то трендовые линии будут построены по текущим пикам и впадинам, справа и слева от которых есть по 10 баров с меньшими/большими
FREE
Dynamic Multi-Period S/R Indicator The Dynamic Multi-Period S/R is an advanced MetaTrader 5 indicator designed to automatically identify and display key Support and Resistance (S/R) levels across multiple timeframes directly on your chart. Unlike static indicators, this tool dynamically adjusts, providing you with relevant and up-to-date S/R zones from Hourly (H1), Daily (D1), and Weekly (W1) charts. This indicator goes beyond simple high/low analysis by incorporating Fractal patterns to refine
Поддержка и сопротивление – важные ценовые уровни на внутридневном рынке. Эти уровни обычно тестируются ценой, после чего она продолжает движение, либо приводят к развороту тренда. Для опытных трейдеров точное определение уровней поддержки/сопротивления сложно переоценить. На их основе строятся многие популярные торговые стратегии (например, торговля на пробой/отскок). Precision Support and Resistance предназначен для профессиональных трейдеров. Помимо точного определения уровней поддержки/сопро
Minions Labs' Candlestick Pattern Teller It shows on your chart the names of the famous Candlesticks Patterns formations as soon as they are created and confirmed. No repainting. That way beginners and also professional traders who have difficulties in visually identifying candlestick patterns will have their analysis in a much easier format. Did you know that in general there are 3 types of individuals: Visual, Auditory, and Kinesthetic? Don't be ashamed if you cannot easily recognize Candlesti
HLC bar MT5 Wyckoff
Eduardo Da Costa Custodio Santos
Индикатор «HLC_bar_MT5 Wyckoff» для MT5 был создан для облегчения анализа во время торговли. Панель HLC использовалась Ричардом Вайкоффом и в настоящее время широко используется в операциях VSA. Вайкофф обнаружил, что использование максимума, минимума и закрытия сделало график намного чище и проще для анализа. Индикатор «HLC_bar_MT5 Wyckoff» позволяет: # Изменить ширину полосы; # Оставьте полосу того же цвета; # И выделите бар, который открывался и закрывался по одной цене. Цвета и ширина легко
This is a buyer and seller aggression indicator that analyzes the shape of each candle and project this data in a histogram form. There are 4 histograms in one. On the front we have two: Upper - Buyer force. Lower - Seller force. At the background we also have two histogram, both with same color. They measure the combined strenght of buyers and sellers. This histograms can be turned off in Input Parameters. It is also possible to have the real or tick volume to help on this force measurement. IN
FREE
Wave Box Market Frenquency
Jean Jacques Huve Ribeiro
4.75 (4)
Totally linked to the result of a movement and the duration he had. Its height records how many ticks the asset walked during a given movement, its width shows us the duration that movement had. Its configuration must be in line with the Weis Wave Indicator configuration to observe the movement force and can indicate a possible accumulation or distribution of the movement;
FREE
Donchian Pro
Paulo Henrique Faquineli Garcia
5 (3)
The Donchian Channel Channels are among the most popular tools of technical analysis, as they visually convey to the analyst the limits within which most price movement tends to occur. Channel users know that valuable information can be obtained at any time, whether prices are in the central region of a band or close to one of the border lines. One of the best known techniques to explore these concepts is Bollinger Bands. However, John Bollinger was not the only one to research the application
FREE
WAPV Box Effort x Result
Eduardo Da Costa Custodio Santos
WA_PV_BOX_EFFORT X РЕЗУЛЬТАТ для MT5 Индикатор WAPV Box Effort x Result входит в группу индикаторов пакета (Wyckoff Academy Wave Market). Индикатор WAPV Box Effort x Result для MT5 поможет вам определить цену и объем. Его прочтение состоит в том, чтобы помочь идентифицировать усилие x результат. в волнах, созданных графиком. Индикатор WAPV Box Effort x Result для MT5, когда поле зеленого цвета, означает, что объем соответствует спросу, а когда поле красного цвета. объем в пользу предложения. Чем
FlatBreakout  MT5 (Бесплатная версия) Детектор флэта и пробоев для MT5 — только для GBPUSD FlatBreakout   MT5  — это бесплатная версия профессионального индикатора FlatBreakoutPro MT5, специально предназначенная для анализа флэта и поиска точек пробоя только по паре   GBPUSD . Идеально для трейдеров, которые хотят познакомиться с уникальной фрактальной логикой FlatBreakout MT5  и протестировать сигналы пробоя диапазона на реальном рынке. Для кого этот продукт Для трейдеров, предпочитающих торгов
FREE
С этим продуктом покупают
Каждый покупатель этого индикатора получает дополнительно Бесплатно: Авторскую утилиту "Bomber Utility", которая автоматически сопровождает каждю торговую операцию, устанавливает уровни Стоп Лосс и Тейк профит и закрывает сделки согласно правилам этой стратегии, Сет-файлы для настройки этого индикатора на различных активах, Сет-файлы для настройки Bomber Utility в режимы: "Минимум Риска", "Взвешенный Риск" и "Стратегия Выжидания", Пошаговый видео-мануал, который поможет вам быстро установить, на
Если вы покупаете этот индикатор, вы получите мой профессиональный Trade Manager + EA БЕСПЛАТНО. Прежде всего стоит подчеркнуть, что эта торговая система является индикатором без перерисовки, без повторной отрисовки и без задержки, что делает ее идеальной как для ручной, так и для роботизированной торговли. Онлайн курс, руководство и загрузка пресетов. «Smart Trend Trading System MT5» - это комплексное торговое решение, созданное для новичков и опытных трейдеров. Он объединяет более 10 премиаль
Gold Sniper Scalper Pro - Торговая Система для Золота (XAU/USD) на MetaTrader 5 Для серьезного трейдера: Подходите к торговле Золотом со структурированной, основанной на данных методологией, которая сочетает в себе несколько факторов рыночного анализа. Этот инструмент создан для поддержки вашего анализа торговли Золотом. Ограниченная Ценовая Возможность Это шанс приобрести Gold Sniper Scalper Pro до повышения цены. Цена продукта будет увеличиваться на $50 после каждых 10 последующих покупок. О
*** Entry In The Zone и SMC Multi Timeframe — это инструмент для анализа рынка в реальном времени, разработанный на основе концепции Smart Money Concepts (SMC). Мы разработали Entry In The Zone и SMC Multi Timeframe, чтобы помочь трейдерам анализировать рыночную структуру более систематично и ясно, с целью повышения эффективности торговли и создания долгосрочной устойчивости вашей стратегии. Этот инструмент основан на концепции Smart Money Concepts (SMC). Он автоматически анализирует точки разв
Smart Stop Indicator – Интеллектуальная точность стоп лоссов прямо на графике Обзор Smart Stop Indicator это специализированное решение для трейдеров, которые хотят устанавливать стоп лоссы чётко и методично, а не на интуитивной основе. Индикатор объединяет классическую логику прайс экшн (higher highs, lower lows) с современной системой распознавания пробоев, чтобы определить действительно логичный уровень стопа. В трендах, диапазонах или фазах резких движений он показывает оптимальные зоны SL
Прежде всего стоит подчеркнуть, что этот торговый индикатор не перерисовывается, не перерисовывает и не отставает, что делает его идеальным как для ручной, так и для роботизированной торговли. Руководство пользователя: настройки, вводы и стратегия. Атомный аналитик - это индикатор ценового действия PA, который использует силу и импульс цены, чтобы найти лучший край на рынке. Оборудованный расширенными фильтрами, которые помогают убирать шумы и ложные сигналы, и повышают торговый потенциал. Испо
Раскройте силу торговли трендами с помощью индикатора Trend Screener: вашего идеального решения для торговли трендами, основанного на нечеткой логике и мультивалютной системе! Повысьте уровень своей торговли по тренду с помощью Trend Screener, революционного индикатора тренда, основанного на нечеткой логике. Это мощный индикатор отслеживания тренда, который сочетает в себе более 13 инструментов и функций премиум-класса и 3 торговые стратегии, что делает его универсальным выбором для превращения
FX Power: Анализируйте силу валют для более эффективной торговли Обзор FX Power — это ваш незаменимый инструмент для понимания реальной силы валют и золота в любых рыночных условиях. Определяя сильные валюты для покупки и слабые для продажи, FX Power упрощает принятие торговых решений и выявляет высоковероятные возможности. Независимо от того, хотите ли вы следовать за трендами или предсказывать развороты с использованием экстремальных значений дельты, этот инструмент идеально адаптируется под
Game Changer — это революционный трендовый индикатор, разработанный для использования с любым финансовым инструментом, который превратит ваш MetaTrader в мощный анализатор трендов. Индикатор не перерисовывается и не запаздывает. Он работает на любом таймфрейме и помогает определять тренд, сигнализирует о потенциальных разворотах, служит механизмом трейлинг-стопа и выдает оповещения в режиме реального времени для оперативной реакции рынка. Независимо от того, являетесь ли вы опытным трейдером, пр
Представляю Вам отличный технический индикатор GRABBER, который работает, как готовая торговая стратегия "Все включено"! В одном программном коде интегрированы мощные инструменты для технического анализа рынка, торговые сигналы (стрелки), функции алертов и Push уведомлений.  Каждый покупатель этого индикатора получает дополнительно БЕСПЛАТНО:  Grabber Утилиту для автоматического управления открытыми ордерами, Пошаговый видео-мануал : как установить, настроить и торговать, Авторские сет-файлы дл
- Real price is 80$ - 45% Discount (It is 45$ now) Contact me for extra bonus   indicator, instruction or any questions! - Lifetime update free - Non-repaint - Related product: Gann Gold EA - I just sell my products in Elif Kaya Profile, any other websites are stolen old versions, So no any new updates or support. Advantages of  M1 Scalper Pro  Profitability: M1 Scalper Pro is highly profitable with a strict exit strategy. Frequent Opportunities: M1 Scalper Pro  takes advantage of numerous smal
Скринер поддержки и сопротивления находится в одном индикаторе уровня для MetaTrader, который предоставляет несколько инструментов внутри одного индикатора. Доступные инструменты: 1. Скринер структуры рынка. 2. Зона бычьего отката. 3. Зона медвежьего отката. 4. Ежедневные опорные точки 5. еженедельные опорные точки 6. ежемесячные опорные точки 7. Сильные поддержка и сопротивление, основанные на гармоническом паттерне и объеме. 8. Зоны уровня берега. ПРЕДЛОЖЕНИЕ ОГРАНИЧЕННОЕ ВРЕМЯ: Индикатор подд
FX Volume MT5
Daniel Stein
4.86 (21)
FX Volume: Оцените подлинную динамику рынка глазами брокера Краткий обзор Хотите вывести свою торговлю на новый уровень? FX Volume дает вам информацию в реальном времени о том, как розничные трейдеры и брокеры распределяют свои позиции — задолго до появления запаздывающих отчетов типа COT. Независимо от того, стремитесь ли вы к стабильной прибыли или ищете дополнительное преимущество на рынке, FX Volume поможет выявлять крупные дисбалансы, подтверждать пробои и совершенствовать управление риск
Индикатор Trend Ai - отличный инструмент, который улучшит анализ рынка трейдером, сочетая идентификацию тренда с точками входа и предупреждениями о развороте. Этот индикатор позволяет пользователям уверенно и точно ориентироваться в сложностях рынка Форекс Помимо первичных сигналов, индикатор Trend Ai определяет вторичные точки входа, возникающие во время откатов или коррекций, позволяя трейдерам извлекать выгоду из коррекции цены в рамках установленного тренда. Важные преимущества: · Работае
FX Levels: Исключительно точные уровни поддержки и сопротивления для всех рынков Краткий обзор Ищете надежный способ определить уровни поддержки и сопротивления для любых инструментов—валют, индексов, акций или сырьевых товаров? FX Levels сочетает традиционный «Lighthouse» метод с современным динамическим подходом, обеспечивая почти универсальную точность. Благодаря сочетанию опыта реальных брокеров и автоматических ежедневных плюс «в реальном времени» обновлений, FX Levels поможет вам выявлят
Получите БЕСПЛАТНЫЙ индикатор AUX, поддержку EA и полное руководство, посетив – https://www.mql5.com/en/blogs/post/763955 Определи тренд. Прочти паттерн. Выбери момент входа. 3 шага менее чем за 30 секунд! Торгуйте легко — никакого анализа не требуется. Ваш умный помощник готов упростить ваш рабочий процесс Больше никакой перегрузки графиков. Торгуйте уверенно с помощью интеллектуального определения направления. Совместим со всеми валютами, криптовалютами, акциями, металлами, индексами и любыми
FX Dynamic: Отслеживайте волатильность и тренды с помощью настраиваемого ATR-анализа Обзор FX Dynamic — это мощный инструмент, который использует расчёты среднего истинного диапазона (ATR) для предоставления трейдерам непревзойдённой информации о дневной и внутридневной волатильности. Настраивая понятные пороги волатильности (например, 80%, 100% и 130%), вы можете быстро определять потенциальные возможности для прибыли или получать предупреждения, когда рынок выходит за типичные рамки. FX Dyna
Atbot
Zaha Feiz
4.62 (55)
AtBot: Как это работает и как его использовать ### Как это работает Индикатор "AtBot" для платформы MT5 генерирует сигналы на покупку и продажу, используя комбинацию инструментов технического анализа. Он интегрирует простую скользящую среднюю (SMA), экспоненциальную скользящую среднюю (EMA) и индекс средней истинной амплитуды (ATR) для выявления торговых возможностей. Кроме того, он может использовать свечи Heikin Ashi для повышения точности сигналов. Оставьте отзыв после покупки и получите спе
IX Power MT5
Daniel Stein
4.9 (10)
IX Power: Получите рыночные инсайты для индексов, сырьевых товаров, криптовалют и форекс Обзор IX Power — это универсальный инструмент для анализа силы индексов, сырьевых товаров, криптовалют и форекс. В то время как FX Power предлагает наивысшую точность для валютных пар, используя данные всех доступных пар, IX Power фокусируется исключительно на данных рынка базового символа. Это делает IX Power отличным выбором для некорреляционных рынков и надежным инструментом для форекса, если вам не нуж
Следующее поколение автоматизированных зон спроса и предложения. Новый инновационный алгоритм, работающий на любом графике. Все зоны создаются динамически в соответствии с ценовым действием рынка. ДВА ТИПА СИГНАЛОВ --> 1) ПРИ ПОПАДАНИИ ЦЕНЫ В ЗОНУ 2) ПРИ ФОРМИРОВАНИИ НОВОЙ ЗОНЫ Вы не получите еще один бесполезный индикатор. Вы получаете полную торговую стратегию с проверенными результатами.     Новые особенности:     Оповещения, когда цена достигает зоны спроса/предложения     Оповещения
Сколько раз вы покупали торговый индикатор с отличными бэк-тестами, подтверждением производительности на реальном счете с фантастическими цифрами и статистикой повсюду , но после использования в итоге сливали свой счет? Не стоит доверять только сигналу, необходимо знать, почему он появился в первую очередь, и это то, что RelicusRoad Pro делает лучше всего! Руководство пользователя + Стратегии + Обучающие видео + Приватная группа с VIP доступом + Доступна мобильная версия Новый взгляд на рынок
This indicator uses support and resistance, volume and some special formula to calculate the volume to filter the candles. If the volume reaches a specific value, And at the same time, Candle breaks the support/resistance line, There would be a signal and we can enter the market. Signals appear when the current candle closes. then you can enter the trade when a new candle appears. Please don't forget to follow your money management plan. MT4 Version Support/Resistance Breakout MT4 :   https:/
Shock Pullback
Suleiman Alhawamdah
5 (1)
Проще говоря, вы можете начать торговлю, когда рядом с текущей свечой начинают появляться белые цифры — так называемые «пипсы». Белые «пипсы» указывают на то, что сделка на покупку или продажу в данный момент активна и движется в правильном направлении, что обозначается их белым цветом. Когда движение белых пипсов прекращается и превращается в статичный зелёный цвет, это сигнализирует об окончании текущего импульса. Зелёный цвет цифр представляет собой общий заработанный профит в «пипсах», незав
Step into the world of Forex trading with confidence, clarity, and precision using Gold Indicator a next-generation tool engineered to take your trading performance to the next level. Whether you’re a seasoned professional or just beginning your journey in the currency markets, Gold Indicator equips you with powerful insights and help you trade smarter, not harder. Built on the proven synergy of three advanced indicators, Gold Indicator focuses exclusively on medium and long-term trends elimina
Купите RFI LEVELS сейчас и получите PRO версию бесплатно Для получения напишите в личные сообщения. ИНСТРУКЦИЯ RUS   -    INSTRUCTIONS  ENG    -   VERSION MT4    Основные функции: Отображения активных зон продавцов и покупателей! Индикатор отображает все правильные первые импульсные уровни/зоны для покупок и продаж. При активации этих уровней/зон, где начинается поиск точек входа, уровни изменяют цвет и заливаются определенными цветами. Также появляются стрелки для более интуитивного восприяти
SuperScalp Pro  — гибридный Supertrend-скальпер SuperScalp Pro расширяет классическую концепцию Supertrend, превращая её в гибридный инструмент для скальпинга, предназначенный для краткосрочных и среднесрочных сетапов на нескольких таймфреймах (M1–H1). Индикатор сочетает визуально понятную зону Supertrend с несколькими опциональными фильтрами подтверждения, обеспечивая входы с высокой вероятностью при простом управлении риском: уровни стоп-лосса и тейк-профита динамически рассчитываются по ATR и
Trend Trading - это индикатор, предназначенный для получения максимальной прибыли от трендов, происходящих на рынке, путем определения времени отката и прорыва. Он находит торговые возможности, анализируя, что делает цена во время установленных тенденций. [ Руководство по установке | Руководство по обновлению | Устранение неполадок | FAQ | Все продукты ] Торгуйте на финансовых рынках с уверенностью и эффективностью Прибыль от устоявшихся тенденций без проволочек Признать прибыльные откаты, пр
The iChannels
BeeXXI Corporation
5 (2)
Сверхбыстрое распознание параболических каналов ( а также линейных, горизонтальных и волнообразных) на всей глубине истории, создавая иерархию каналов. Необходима настройка: Max bars in chart: Unlimited Данный индикатор предназначен в первую очередь для алгоритмического трейдинга, но можно использовать и для ручной торговли  Данный индикатор будет иметь в ближайшем будущем очень активную эволюцию и подробные описания, как применять для создания роботов
[ MT4 Version ]  [ Kill Zones ]  [ SMT Divergences ] How to trade using Order Blocks:  Click here User Interface Performance:  During testing in the strategy tester, the UI may experience lag. Rest assured, this issue is specific to the testing environment and does not affect the indicator's performance in live trading. Elevate your trading strategy with the  Order Blocks ICT Multi TF  indicator, a cutting-edge tool designed to enhance your trading decisions through advanced order block analysis
Топовый индикатор МТ5, дающий сигналы для входа в сделки без перерисовки! Идеальные точки входа в сделки для  валют, крипты, металлов, акций, индексов !  Смотрите  видео  (6:22) с примером отработки всего одного сигнала, окупившего индикатор. Версия индикатора для MT4 Преимущества индикатора Сигналы на вход без перерисовки Если сигнал появился, он никуда НЕ исчезает! В отличие от индикаторов с перерисовкой, которые ведут к потере депозита, потому что могут показать сигнал, а потом убрать его. Б
Другие продукты этого автора
Description   : The "Market Structure HH HL LH LL" indicator is a powerful and at the same time simple tool for analyzing price dynamics in financial markets. This indicator helps traders and investors identify changes in trends and identify important points in price time series. Displays "BOS" and "CHoCH" lines. Key components of the indicator: HH (Higher High): The top at which the price closes above the previous high top. HH indicates a strengthening uptrend. HL (Higher Low): The minimum
The trend indicator "   Super Trend Flexible Alert   " has a minimum of settings. This indicator is designed to be as easy to use as possible. The indicator shows the trend with a main colored line ("SuperTrend" line, which you can see in the "Data Windows" window). Also, in places where the trend changes, the indicator shows colored arrows (   "STBuy" and "   STSell" icons, which you can see in the "Data Windows" window       ). In places where the trend changes, the indicator doesn't give a s
The Candle Length Indicator Alarm generates a sound alert, sends a push notification and an email when the size of the current candlestick changes. The size of the current candlestick can be measured in two ways: The first method: the size of the candlestick is measured from the beginning of the candlestick (from the OPEN price). The second method: the size of the candlestick is measured from current price. The indicator has the following settings: sound — a sound file from the folder: "...\Meta
The Buy Sell Color Background indicator changes the background color depending on position direction. It has three settings: Background color for BUY - background color for a Buy position Background color for SELL - background color for a Sell position Default background color - background color with no open position After you detach the indicator from a chart, its background color changes to Default background color .
Утилита "Калькулятор сигналов" работает прямо из терминала MetaTrader 5, и это большое преимущество, так как терминал осуществляет предварительный отбор и сортировку сигналов. Таким образом, пользователь видит в терминале MetaTrader 5 только сигналы с максимальной совместимостью с его торговым счётом. "Калькулятор сигналов" позволяет дать ответ на один из самых частых вопросов пользователей сервиса Сигналы: "Смогу ли я подписаться на сигнал NNN, и какой объём позиции будет копироваться на мой то
This indicator belongs to the "Stochastic" category. I tried to simplify the control of the indicator as much as possible, so the minimum settings are shown in the input parameters: this is the choice of an icon for the signal arrows. The "Buy" signal is encoded with the ' Buy Arrow code ' parameter, and the "Sell" signal is encoded with the ' Sell Arrow code ' parameter. Signal arrow codes for signals (please use values ​​from 32 to 255) are taken from the Wingdings font. The indicator works on
An Expert Advisor based on the custom indicator. Search for a signal at every tick. Positions are closed by an opposite signal. No trailing. There is no stop loss. There is no take profit. Has a minimum of settings Money management: Lot OR Risk   - type Money management The value for "Money management"   - Money management value Deviation   - admissible slippage Buy Arrow code   (font Wingdings) - character code from 'Wingdings' font for BUY signals Sell Arrow code   (font Wingdings) - characte
The indicator displays three lines and monitors two types of intersections. Three lines of the indicator: "   MA   " - slow indicator "Moving Average", "   DEMA Slow   " - slow indicator "   Double Exponential Moving Average" and "   DEMA Fast   " - fast indicator "Double Exponential Moving Average". Two types of intersections       : "   Alert Price MA   " - the price crosses the   "MA" line and   "   Alert DEMA DEMA   " - the lines cross       "DEMA Slow" and   "DEMA Fast   ". When crossing,
This Expert Advisor belongs to the class of utilities for manual and semi-automatic trading. The "   Pending order at the extremums of the day   " EA places two pending orders at the extremums of the previous day. Parameter "   Pending Orders: ...       " allows you to select the type of pending orders: "   Buy Stop and Sell Stop   " or "   Buy Limit and Sell Limit   "   .       extremum       'Low' offset is made downwards). "   New pending -> delete previous ones   " set to "   true   " will f
The "Panel Partial Closure" utility-panel is intended for quick partial closing of a position that has a profit. It has only two parameters: "   Partial closure #1   " and "   Partial closure #2   ". Works for any symbol and for any 'Magic number' - that is, the utility is primarily intended for manual trading. How it works: For example, you have several positions on "EURUSD", "Jump 100 Index" and "XAUUSD" (gold). The utility finds the position with the largest profit - in the screenshot, this
The 'Supertrend MetaTrader 5' indicator is the basis of the simplest trend trading system. And yet it remains very effective. The indicator works on any timeframe (on the timeframe of the current chart). From the name you can see that this indicator follows the trend, and when the trend changes, the indicator accurately shows the point of the trend change. The basis of 'Supertrend MetaTrader 5' is comparing price and 'Average True Range indicator' values multiplied by a multiplier (there is als
MQL5 "Daily resistance and support" indicator - draws daily support and resistance lines. Drawing is carried out only with the help of graphical objects (trend lines) - indicator buffers are not used in this indicator. The indicator has no settings - the search for levels is carried out on the last 500 bars from the "D1" timeframe and this parameter is hardwired inside the code. Manual trading: When trading manually, this indicator is recommended to be used on timeframes from "M10" to "H1". It
Multi Symbol Trailing
Vladimir Karputov
5 (1)
The "   Multi Symbol Trailing   " utility moves Stop Loss for all positions that are currently open (multi-symbol trailing). It is intended primarily to assist in manual trading. There are no restrictions for the utility either by the name of the currency pair or by the individual identifier (Magic number) - the utility processes absolutely all positions that are currently open. The unit of measurement for the "   Trailing Stop   " and "   Trailing Step   " parameters is points (the difference
The trend indicator "Trend Two Moving Average" uses two types of Arrow to display calculation results - these are "Trend UP" and "Trend DN".       Arrows "Trend Up"       are drawn       By       price       'Low'       bar   ,       A       Arrows "Trend DN" -       By       price       'high'. The trend search algorithm is based on the analysis of the price of a bar and the values of two 'Moving Average' indicators. The trend direction is calculated on the current (zero) bar. Therefore, it is
Three TimeFrames indicator-panel. The indicator is made in the form of a panel based on the CAppDialog class. The panel can be minimized or moved around the current chart using the mouse. The indicator shows three timeframes of the current symbol in the panel. In the current version, the indicator has a minimum number of settings - these are the parameters of three timeframes: "Younger timeframe", "   Middle   timeframe   " and "   Older   timeframe   ". When launched, the indicator-panel autom
The "   Market Session Times   " indicator shows the time of four trading sessions: Asia, Europe, America and Pacific. The time of trading sessions is set   in the format       GMT and thus does not depend on the trading server at all. The following data is used: Trading Session City GMT Asia Tokyo Singapore Shanghai 00:00−06:00 01:00−09:00 01:30−07:00 Europe London Frankfurt 07:00−15:30 07:00−15:30 America New York Chicago 13:30−20:00 13:30−20:00 Pacific Wellington Sydney 20:00−02:45 22:00−0
Trading system for a variety of trading transactions. Allows you to set the balance to wander around zero - used for specific rebate tasks or similar. Configured to work with hedging   accounts.   There cannot be more than one position in the market   . One general setting, the "   Step, Stop Loss, Take Profit   " parameter is measured in points (example for EURUSD: 1.00055-1.00045 = 10 points). The advisor stops trading (while remaining on the chart) if, when   placing a position, it encounters
The indicator shows Fractals from the higher timeframe. It is possible to display two types of Fractals: 'Regular Fractal' and 'BW Fractal'. Consider the formation of the Fractal 'UP'. 'Regular Fractal' is a very strict Fractal in which each subsequent 'high' price (to the left and right of the central bar) is smaller. Whereas in 'BW Fractal' there is only one condition: the central bar (its price 'high') must be the highest. Visually, the difference between these two modes can be seen in diagr
AI Support Resistance This is an indicator that searches for the “Support” and “Resistance” lines. The search is carried out using an algorithm for numerical analysis and data processing. There are three search options available (“mode #1”, “mode #2” and “mode #3”). Each of these options differs in its internal algorithm (at the moment these are completely internal settings, they are not available to the user). We can say that these options differ in the severity of the search. Limitation: At t
The " Open Time Manager " utility opens a position at a specified time and then turns on classic trailing. Time (' Hour ':' Minute ') is always set in the GMT time zone with a GMT Ofset offset. It is possible to select three options for opening a position using the ' Trade mode ' parameter: ' BUY ' ' SELL ' ‘ BUY and SELL (simultaneously) ’ ‘ OFF (no trade, only trailing works) ’ The fourth parameter is used when you only need to enable trailing for your positions and not open new positions. St
The trend trading strategy "Super Trend Flexible Alert EA" is built on the indicator of the same name "Super Trend Flexible Alert". The advisor uses all the information from the indicator, so the advisor has only three parameters, these are: “Working timeframe” – specifies the working timeframe, the timeframe on which the indicator is created, and also from which the “OHLC” data is taken. "Stop Loss" is the constant size of the stop loss, measured in "points" (you can see an example of what "po
The indicator shows bullish and bearish divergence. The indicator itself (like regular stochastic) is displayed in a subwindow. Graphical interface   : In the main window, graphical objects “trend line” are created - produced from the “Low” price to the “Low” price (for bullish divergence) and produced from the “High” price to the “High” price (for bearish divergence). The indicator draws in its window exclusively using graphic buffers: “Main”, “Signal”, “Dot”, “Buy” and “Sell”. The "Buy" and "
The dashboard scans the readings of two indicators: 'MACD' and 'Stochastic'. Displays signals in three columns: for MACD, for Stochastic, and the resulting column (if the signal is the same for both indicators).  Scanning can be selected on one or more timeframes. If you disable all timeframes, the dashboard will still load, but with settings specifically for such cases. Signals are always checked for the zero bar (zero bar is the rightmost bar on the chart) of the indicator. Description of para
ATR Bands Alert is a channel indicator where the channel width is calculated as a constant multiplier ("Multiplier") and the value of the "Average True Range" indicator. Unlike Bollinger Bands, the bandwidth is not changed so often – in the ATR Bands Alert indicator, the bands often have long straight lines. The interpretation of the ATR Bands Alert is based on the fact that the price is inside the bands for most of the time, and if the price reaches one of the boundaries, it may indicate a tr
The Bollinger Bands Dashboard indicator offers a convenient and informative way to track Bollinger Bands indicator signals on different timeframes using one panel (Dashboard). This tool allows traders to quickly and easily obtain the information they need, enabling efficient decision-making in the market. Main characteristics: 1. **Signals Panel**: The Dashboard displays Bollinger Bands signals for selected timeframes, providing users with clear and structured information. 2. **Flexibility in
Introducing the utility "   VIRTUAL BREAKEVEN   !" "Current symbol" is the symbol of the chart on which the utility works. The utility keeps a count of all positions on the current symbol and ignores the "Magic number" of these positions. The utility works on the current symbol and tracks the Breakeven level in the deposit money. When the profit of all positions on the current symbol becomes >= «Breakeven» + «Breakeven Step» the utility will start tracking «       Breakeven       ". A common ex
Tensline
Vladimir Karputov
Простий, ефективний, прибутковий — експерт, який працює на вас Цей Expert Advisor створений для тих, хто цінує простоту та контроль . Мінімум налаштувань — максимум результату. Ви не витрачаєте час на складну оптимізацію: налаштування інтуїтивні, запуск — за лічені хвилини. Тільки одна позиція в ринку — жодного хаосу, жодних накладок. Без стоп-лоссів, тейк-профітів чи трейлінгу — повний контроль над логікою виходу. Гнучкий вибір стратегії — оберіть ту, що найкраще відповідає вашому
Фильтр:
Нет отзывов
Ответ на отзыв