Смотри обучающее видео по маркету на YouTube
Как купить торгового робота или индикатор
Запусти робота на
виртуальном хостинге
виртуальном хостинге
Протестируй индикатор/робота перед покупкой
Хочешь зарабатывать в Маркете?
Как подать продукт, чтобы его покупали
Новые технические индикаторы для MetaTrader 4

Break & Retest неудержим, когда объединен с нашим другим индикатором расхождений. После покупки отправьте нам сообщение, и вы сможете получить этот второй индикатор БЕСПЛАТНО в качестве бонуса. После многих месяцев тяжелой работы и преданности мы с гордостью представляем вам наш индикатор действий цены Break and Retest, созданный с нуля. Один из самых сложных индикаторов, который мы создали, содержит более 1400 строк кода!
Основная идея нашей стратегии Break and Retest заключается в том, ч

Оживите свои торговые графики с помощью нашего инновационного конструктора тем для Metatrader!
Наш Конструктор тем позволяет создать торговую среду, которая соответствует вашему личному стилю и предпочтениям. Благодаря простому в использовании интерфейсу и полной интеграции в Metatrader, вы теперь можете полностью контролировать внешний вид и восприятие ваших графиков / Бесплатная версия MT5 .
Особенности Полная настройка: Легко изменяйте цвет свечей и фон графика, чтобы отразить ваш уник
FREE

С помощью этого торгового инструмента вы можете одновременно сканировать 15 рынков.
Представляем новый торговый индикатор 2024:
️ Мультивалютный стохастик на нескольких таймфреймах.
Есть как минимум две причины, по которым я создал этот торговый инструмент:
Во-первых, мне надоело наблюдать только за одним рынком. Во-вторых, я не хочу упустить момент входа на другой рынок.
Вот почему я хочу одновременно знать и другие рыночные условия.
По этой причине мне нужен сканер, который сможе
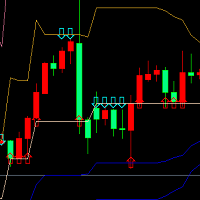
Этот индикатор основан на теории разделения золота, соответственно, чтобы получить высокую и низкую цену корневой K - линии за последние 22 (по умолчанию) и рассчитывать кривую поддержки и давления с помощью коэффициента разделения золота. Когда цена впервые приближается к линии давления вверх или несколько раз приближается к линии давления, появляется стрелка вниз, соответствующая, что указывает на давление, подходящее для пустого sell; Когда цена впервые приближается вниз к поддерживающей лин
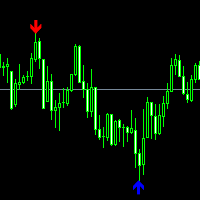
AMS Scalper Отличный индикатор для точки входа в рынок, сигналы индикатора используем только по тренду.
Настройки: Range - 50 ( размер диапазона для поиска сигнала.) Maximum candles Back - 3 (через сколько свечей ставить сигнал) P.S для появление сигнала на нулевой свече - ставим 0.
В качестве индикатора тренда, рекомендуем использовать - Trend Arrow Super
Остались вопросы? нужна помощь?, я всегда рад помочь, пишите мне в личные сообщения или В телеграмм
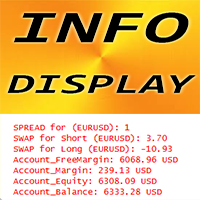
This is Free product you are welcome to use for your needs! Also I very appreciate your positive feedbacks! Thanks a lot! // More great Expert Advisors and Indicators are available here: https://www.mql5.com/en/users/def1380/seller // Also you are welcome to join to profitable , stable and reliable signal https://www.mql5.com/en/signals/1887493 Forex Indicator "INFO Display" for MT4 , Trading Support tool. INFO Display indicator shows current S pread and Swaps of forex pair whe
FREE
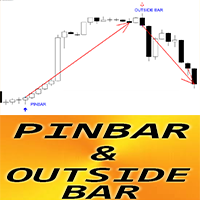
Forex Indicator " Pin Bar & Outside bar Patterns" for MT4 Indicator " Pin Bar & Outside Bar Patterns " is very powerful for Price Action trading Indicator detects Pin Bar and Outside bar Patterns on chart: Bullish pattern - Blue arrow signal on chart (see pictures) Bearish pattern - Red arrow signal on chart (see pictures) No repaint; No delays; with PC, Mobile & Email alerts Indicator "Pin Bar & Outside Bar Patterns " is excellent to combine with Support/Resistance Levels:
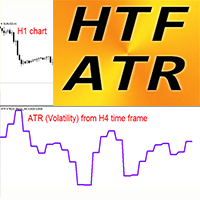
Forex Volatility Indicator HTF ATR for MT4 Average True Range itself is one of the most impotrant indicators for traders - it shows market volatility H TF ATR is a market volatility indicator used in technical analysis . HTF means - H igher Time Frame ATR is great to plan your dynamic Take Profits / SL locations: For example most optimal SL values are located in 1.2-2.5 ATR values This indicator is a useful tool to add to any trading system HTF ATR Indicator allows you t
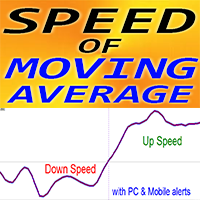
Forex Indicator "MA Speed" for MT4, No Repaint. SPEED of Moving Average - is unique trend indicator The calculation of this indicator is based on equations from physics . Speed is the 1st derivative of Moving average MA Speed indicator shows how fast MA itself changes its direction There are plenty of opportunities to upgrade even standard strategies with MA Speed . Suitable for SMA, EMA, SMMA and LWMA It is recommended to use MA Speed in trend strategies , if indic
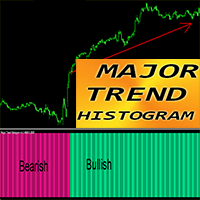
Forex Indicator "Major Trend Histogram" for MT4 Major Trend Histogram indicator designed to catch really huge trends Indicator can be in 2 colors: DeepPink for bearish trend and SpringGreen for bullish one (colors can be changed) It detects trends on the beginning stages - way more efficient than any standard MA cross M ajor Trend Histogram can be combined with any other trading methods: Price Action, VSA, other indicators Indicator has built-in Mobile and PC alerts
// More great Exper
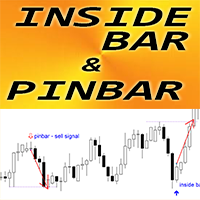
Forex Indicator " Inside Bar & PinBar Patterns" for MT4 Indicator " Inside Bar & PinBar Patterns " is very powerful for Price Action trading Indicator detects Inside Bar and PinBar Patterns on chart: Bullish pattern - Blue arrow signal on chart (see pictures) Bearish pattern - Red arrow signal on chart (see pictures) No repaint; No delays; Inside Bar itself has High R/R ratio (reward/risk) with PC, Mobile & Email alerts Indicator " Inside Bar & PinBar Patterns " is excellent t
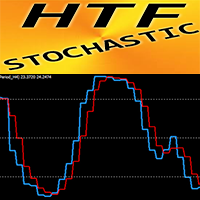
Forex Indicator HTF Stochastic for MT4 Stochastic oscillator is one of the best indicators on the market - perfect tool for many traders. H TF means - H igher Time Frame OverBought zone - above 80; OverSold one - below 20 HTF Stochastic indicator is excellent for Multi-Time Frame trading systems especially with Price Action entries. This Indicator allows you to attach Stochastic from Higher time frame to your current chart --> this is professional trading approach I n
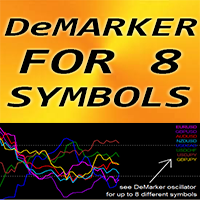
Forex Indicator "DeMarker for 8 Symbols" for MT4, No repaint DeMarker oscillator curve indicates the current price position relative to previous highs and lows during the indicator calculation period DeMarker provides the most efficient regular divergence signals among other oscillators It is great to take Sell entries with regular divergence in OverBought zone (above 0.7) and Buy entries with regular divergence in OverSold zone (below 0.3) "DeMarker for 8 Symbols" gives oppo
ICT Template Indicator visualizes and automatically updates all important ICT elements for Scalpers, Day and Swing traders. It allows you too keep your chart clean and bring any elements by just one click to the side buttons. Thanks to mobile notifications on external liquidity levels, you will not miss any opportunity and you don't have to sit behind the screens whole day. Each element has fully customizable colours, width, line types, max timeframe to be shown etc... so you can really tweak yo
FREE

Форекс индикатор TrendNavigator это технический индикатор. TrendNavigator это инструмент, который позволяет трейдерам, применяющим данную стратегию, лучше понять, что происходит на рынке, и предсказать, в каком направлении цена продолжит движение.
Значения индикатора рассчитывается на основе движений цены валютной пары или любого другого финансового актива. В рамках технического анализа индикатор TrendNavigator используется трейдерами для прогнозирования будущих значений цен или общего на

Индикатор Trend Seeker идеально подходит для отслеживания долгосрочных трендов на рынке Форекс и может быть использован без ограничений по инструментам или временным интервалам. Этот индикатор позволяет попытаться прогнозировать будущие значения, но его основное применение заключается в генерации сигналов на покупку и продажу. AlphaTrend Seeker отслеживает рыночный тренд, игнорируя резкие колебания и шумы вокруг средней цены. Он основан на идее технического анализа, утверждающего, что рынок име

Индикатор "Trend Tandem" - это инструмент анализа тренда на финансовых рынках, который помогает трейдерам определить направление движения цены.
Параметры:
RISK (Риск): Определяет уровень риска, учитываемый в анализе тренда. Чем выше значение, тем более агрессивно учитывается волатильность. SSP (Период ССП): Определяет период скользящего среднего, используемого для выявления тренда. Чем больше значение, тем более гладким будет трендовый сигнал. CountBars (Количество баров): Определяет количе

TwoMA Crosses indicator displays arrows based on whether the short term moving average crosses above or below the long term moving average. A moving average doesn't predict price direction. Instead, it defines the current direction. Despite this, investors use moving averages to filter out the noise. Traders and investors tend to use the EMA indicator, especially in a highly volatile market because it’s more sensitive to price changes than the SMA.
Download for FREE TwoMA Crosses EA from th
FREE

本指标是根据黄金分割理论,分别获取过去22(默认)根K线高低价,并通过黄金分割系数计算得出支撑、压力曲线。 当价格第一次向上靠近压力线,或者多次靠近压力线时,会出现向下的箭头符合,提示有压力,适宜做空sell; 当价格第一次向下靠近支撑线,或者多次靠近支撑线时,会出现向上的箭头符合,提示有支撑,适宜做多buy; 在数据窗口,会提示各条支撑、压力线的价格数值,出现的箭头符合数值为up、down。
这个指标,适合在所挂的图表里做短线,也即进场开仓后,持仓几根K线柱,然后可以平仓。做多的话,止损可以在支撑线下方,止盈在压力线附近。做空的话,止损可以在压力线上方,止盈在支撑线附近。
本指标涉及的黄金分割系数分别为0.382、0.618、1.618、2.168、4.236,计算得到对应的支撑压力线。 由于MT4的指标数量有限,本指标分成了2个EX4文件,第一个的黄金分割系数为0.382、0.618、1.618,第二个为2.168、4.236,第二个文件名为“Golden Ratio Support Pressure Indicator extend”,可免费下载和使用。
FREE
This indicator informs the user when the ATR is above a certain value defined by the user, as well as when the ATR prints a percentage increase or percentage decrease in its value, in order to offer the user information about the occurrence of spikes or drops in volatility which can be widely used within volatility-based trading systems or, especially, in Recovery Zone or Grid Hedge systems. Furthermore, as the volatility aspect is extremely determining for the success rate of any system based o
FREE
This indicator informs the user when the ATR is above a certain value defined by the user, as well as when the ATR prints a percentage increase or percentage decrease in its value, in order to offer the user information about the occurrence of spikes or drops in volatility which can be widely used within volatility-based trading systems or, especially, in Recovery Zone or Grid Hedge systems. Furthermore, as the volatility aspect is extremely determining for the success rate of any system based o
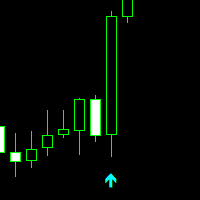
Professional Trade Arrow
Non-repaint MT4 technical indicator.
works on all timeframes 1 minute to the monthly timeframe
the trade vision buy and sell arrow is a multi currency and synthetic indicator
Aqua arrow look for selling opportunities
Crimson arrow look for buying opportunities.
wait for candle to close and arrow to appear before taking any trades.
Settings: Key value - 3.0 ( This parameter is adjusted for a better signal.) We recommend a trend indicator - Trend

Indicador de Bandas de Fibonacci para Metatrader 4 . Este indicador funciona de forma similar a las conocidas Bandas de Bollinger clásicas, pero en lugar de usar la desviación estándar para trazar las bandas usa números de Fibonacci y el ATR (Average True Range). Puede usarse para trazar niveles de soporte y resistencia que pueden emplearse en sistemas de scalping de corto plazo y swing trading. Las bandas del indicador son calculadas de la siguiente forma: Línea central : Media móvil de n peri
FREE

Индикатор "Trend Api" представляет собой инновационный инструмент для анализа тренда на рынке Форекс. Он обладает уникальными возможностями и широким набором настроек, которые помогут трейдерам принимать обоснованные решения при торговле.
Этот индикатор основан на анализе рыночного тренда и помогает выявлять направление движения цен. Он использует различные математические алгоритмы и статистические методы для определения силы и устойчивости тренда на рынке.
Одной из ключевых особенностей ин

The Breakout Line in technical analysis serves as a crucial tool for understanding market dynamics and potential shifts in price direction. It's designed to highlight rapid accelerations or declines in the market's trajectory. Unconventional Analysis : The Breakout Line is not your typical technical indicator; it's tailored to capture swift market movements, offering a unique perspective on price trends. Angle of the Breakout Line : The sharper the angle formed by the Breakout Line, the stro

Keltner Trend Pro - Unleash the Power of Price Action! Are you ready to transform your trading approach? Meet Keltner Trend Pro, an Expert Advisor meticulously crafted to harness the dynamic movements of the market using the renowned Keltner Channel and Average True Range (ATR) indicators. Limited-time Special Opportunity: Seize the moment! Be among the first 10 (Purchasing 9/10) to seize this unique opportunity, and not only will you acquire a top-tier trading algorithm but also enjoy an exclu

The indicator has 3 lines: green, blue and red.
Between the blue and green line - bullish channel. Between the blue and the red line - a bearish channel.
In addition, there is a signal line that moves inside the channel. This line changes colour from green to red and vice versa, thus indicating what the sentiment of the market is.
The strategy is easy to follow.
When you are in the bullish channel and get a green signal line it is a signal of buying. When you are in a bearish channel
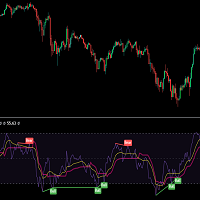
MOST is applied on this RSI moving average with an extra default option added VAR/VIDYA (Variable Index Dynamic Moving Average)
MOST added on RSI has a Moving Average of RSI and a trailing percent stop level of the Moving Average that can be adjusted by changing the length of the MA and %percent of the stop level.
BUY SIGNAL when the Moving Average Line crosses above the MOST Line
LONG CONDITION when the Moving Average is above the MOST
SELL SIGNAL when Moving Average Line crosses belo

MA Trend Following Indicator for MT4 is a simple technical analysis tool designed to follow the trend in any currency pair chosen by the trader by combining 3 moving averages on two different time frames, one long term and one short term.
It basically provides a bullish or bearish signal when the moving averages on one time frame align with the moving averages on a different time frame to have a confluence signal.
The indicator is presented as a screener with multiple currency pairs (that

Smart Mone Liquidity Zone
Overview: Smart Mone Liquidity Zone is a sophisticated MetaTrader 4 indicator meticulously crafted to illuminate crucial liquidity zones on price charts, amplifying traders' capacity to discern optimal trading opportunities. Engineered by Yuri Congia, this indicator empowers traders with profound insights into market dynamics, enabling astute decision-making within various timeframes. Key Features: Liquidity Zone Illumination: The indicator strategically highlights l

Even when most brokers will give you a historic list of all your trading, with the time of the entry, if it was a sell, or a buy, the profit or loss, which is good.
It won't tell you:
Why did you enter the market? so you won't be able to determine if you followed your trading rules, or if you break all your rules and entered the market in a whim or feeling.
Trading is a learning skill, so you have to evaluate your trading performance at the end of your day.
In order to learn what things
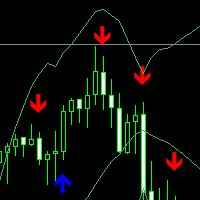
A visual tool to assist in trading and analysing bolinger bands. Arrows are not to be used for entry but rather assist in developing potential bias. Repaints in lower timeframes. Predicts if price will be higher or lower than the signal candle. Perfect for mean reversion trading, binary options or futures contracts on larger time frames. The indicator was backtested on 5 years of data and has a 90% accuracy for predicting price reversals over time.
FREE

MAXLUM SYSTEM is a Trading System that uses anti-Margin Call without using SL with a positive correlation Hedging Strategy
Simple example of BUY on EURUSD and SELL on GBPUSD at the same time This kind of trading will not occur as a Margin Call By calculating the GAP difference between the 2 pairs we can take advantage of the GAP
This indicator will be more effective if you use Data Analysis Please join the Maxlum System Telegram group for details
Recommended Pair NZDUSD - AUDUSD EURUSD -

buy sell star indicator has a different algoritms then up down v6 and buy sell histogram indicators. so that i put this a another indicator on market. it is no repaint and all pairs and all time frame indicator. it need minimum 500 bars on charts. when the white x sign on the red histogram that is sell signals. when the white x sign on the blue histogram that is sell signals. this indicator does not guarantie the win.price can make mowement on direction opposite the signals. this is multi tim
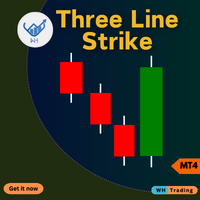
Трехлинейный индикатор страйка для MetaTrader 4 (MT4). Этот продвинутый инструмент разработан, чтобы помочь вам точно и легко определить потенциальные развороты рынка.
Независимо от того, являетесь ли вы новичком или опытным трейдером, этот индикатор может улучшить ваши торговые решения и максимизировать вашу прибыль. Contact me after purchase for guidance Ключевая особенность: Точные сигналы разворота . Обнаруживайте потенциальные развороты тренда на основе трехлинейной модели страйка
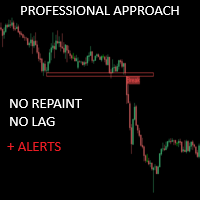
Critical Zones был создан специально для ручных трейдеров, которые ищут более точные входы в рынок. Этот индикатор использует передовые алгоритмы для обнаружения зон интереса, вычисляя наиболее значимые поддержки и сопротивления на графике, а также их прорывы и ретесты. Индикатор может быть настроен на отправку предупреждений и уведомлений при обнаружении потенциально выгодных возможностей для покупки/продажи, что позволяет трейдерам оставаться в курсе торговых возможностей, даже когда они не н

Точный торговый анализ у вас под рукой: программное обеспечение для анализа торговли нового поколения Основное программное обеспечение для анализа торговли, доступное на рынке, часто предоставляет только почасовую или еженедельную статистику коэффициента прибыли и убытков, что не отвечает требованиям более точного анализа торговли. Однако на реальном торговом рынке каждый день складываются уникальные обстоятельства. Понедельники тихие, среды активные с тройным овернайт-процентом, а пятницы искл
FREE
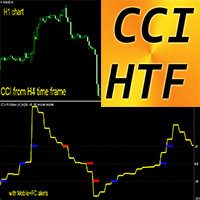
Forex Indicator CCI HTF Oscillator for MT4 Upgrade your trading methods with the professional CCI HTF Oscillator for MT4. H TF means - H igher Time Frame Commodity Channel Index (CCI) measures the difference between the current price and the historical average price Important levels: +/-200, +/-100
It is great to take Sell entries from above +200 zone and Buy entries from below -200
This indicator is excellent for Multi-Time Frame trading systems with Price Action entries

Откройте для себя силу анализа объема с помощью нашего индикатора профиля объема для Metatrader! / Версия для MT5
Basic Volume Profile - это индикатор, специально разработанный для ручных трейдеров, желающих оптимизировать свою торговлю. Индикатор Volume Profile - это незаменимый инструмент для любого серьезного трейдера, желающего лучше понять поведение рынка. С помощью нашего инновационного решения вы можете четко и ясно представить, как распределяется объем торгов по ценам. Это позволит ва
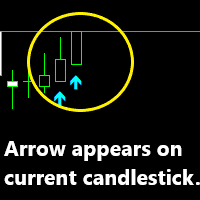
Advanced artificial intelligence indicator that is 100% non-repaint and appears on current candlestick. The indicator is based on arrows which serve as your entry points. Buy arrow is your buy signal and orange arrow are your sell signal as more arrows appear the stronger the trend and you can add more entries. The indicator works on all timeframe from the one-minute timeframe to the monthly timeframe. The AI Non-repaint indicator works on all forex pairs.
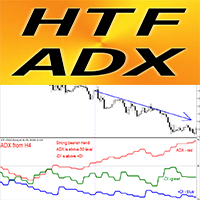
Forex Indicator HTF ADX for MT4 Upgrade your trading methods with the professional HTF ADX indicator for MT4. H TF means - H igher Time Frame ADX (red line) is used to measure trend strength - if ADX value is above 30 and has upstairs shape - trend is strong If the +DMI (blue line) is above the -DMI (green one): price is moving up, and ADX measures the strength of the uptrend If the -DMI (green line) is above the +DMI (blue one) : price is moving down, and ADX meas
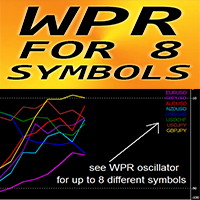
Forex Indicator "WPR for 8 Symbols" for MT4, No repaint WPR itself is one of the best oscillators for scalping It is great to take Sell entries from strong OverBought zone (above -10) and Buy entries from strong OverSold zone (below -90) "WPR for 8 Symbols" gives opportunity to control WPR values of up to 8 different symbols just on 1 chart
This indicator is excellent to combine with Price Action entries from OverSold/Bought areas as well . // More great Expert Advisors and
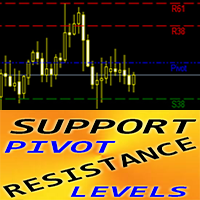
Forex Indicator "Pivot Support Resistance Levels Day Week Month" for MT4 Indicator " Pivot SR Levels D_W_M " is a very powerful auxiliary indicator for Price Action trading This particular indicator is using Fibonacci numbers in calculation. Pivot Levels are calculated as an average of significant prices from the performance of a market in the prior trading period Pivot Levels itself represent levels of highest resistance or support, depending on the overall market condition Indicator "
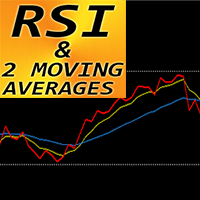
Forex Indicator "RSI and 2 Moving Averages" for MT4 This indicator is excellent for Momentum trading systems . " RSI and 2 MAs" Indicator allows you to see Fast and Slow Moving Averages of RSI itself Indicator gives opportunities to see the trend change very early " RSI and 2 MAs" can be used to catch the momentum into the trend direction It is very easy to set up this indicator via parameters (see the picture) Indicator can be used on any time-frame // More great Expert Advisors and I

The indicator defines the buy and sell arrows with high performance and consistent results. Suitable for trend trading or following the trend. Automatic analysis of market opportunities ; Help traders earn more from their investments;
Never repaints, recalculates or backpaints signals; This is FREE demo version of the indicator and works only on "EUR USD M5" . The demo version does not work on SUFFIX OR PREFIX brokers ! Trend Reversing PRO All other details about the indicator here
FREE
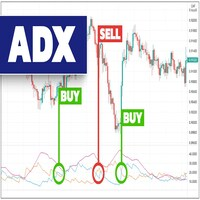
The indicator provides buy and sell signals on the charts every time ADX DI- and DI+ crosses each other. Blue arrow for uptrend (DI+>DI-). Red arrow for downtrend (DI->DI+). This technical analysis tool can be applied to various trading strategies. The ADX Crosses Signals Indicator is based on the Average Directional Index Metatrader Indicator. The ADX is a lagging indicator, meaning that a trend must already be established before the index can generate its signal.
Inputs PERIOD; AlertOn
FREE

Indicator for the 4th strategy of the Pipsurfer EA. This indicator will allow the user to visually see the points of entry for strategy 4 of Pipsurfer. In the settings you will be able to adjust the parameters to mix and match to your trading style and find the settings that you want to either trade manually or tune the EA to do. Strategy 4 uses a market structure trend continuation approach to trading and looks for confirmed highs in downtrends and confirmed lows in uptrends to find great trend
FREE

Выделяет торговые сессии на графике Демо-версия работает только на графике AUDNZD !!! Полная версия продукта доступна по адресу: (*** будет добавлено ***) Trading Sessions Indicator (Индикатор торговых сессий) отображает начала и окончания четырех торговых сессий: тихоокеанской, азиатской, европейской и американской. возможностью пользовательской настройки начала/окончания сессий; возможность отображения только выбранных сессий; работает на M1-H2 таймфреймах;
В индикаторе можно настроить следу
FREE
The MACD 2 Line Indicator is a powerful, upgraded version of the classic Moving Average Convergence Divergence (MACD) indicator.
This tool is the embodiment of versatility and functionality, capable of delivering comprehensive market insights to both beginner and advanced traders. The MACD 2 Line Indicator for MQL4 offers a dynamic perspective of market momentum and direction, through clear, visually compelling charts and real-time analysis.
Metatrader5 Version | All Products | Contac
FREE

Описание работы
Индикатор 'MA7 Clover' основан на свечных формах. Показывает свечной паттерн 'Пин-бар'. Подробная информация о индикаторе 'MA7 Clover' .
Настройки индикатора
General settings – общие настройки: Min body size – минимальный размер тела, проценты; Max body size – максимальный размер тела, проценты; Min nose size – минимальный размер носа, проценты; Max nose size – максимальный размер носа, проценты.
Message settings – настройки сообщений: Send message to the terminal (Alert) –

The indicator defines the buy and sell arrows with high performance and consistent results. Suitable for trend trading or following the trend. Automatic analysis of market opportunities ; Help traders earn more from their investments;
Never repaints, recalculates or backpaints signals; This is FREE demo version of the indicator and works only on "EUR USD M5" . The demo version does not work on SUFFIX OR PREFIX brokers ! Forex Trend Commander All details about the indicator here :
FREE

**Product Description: Awesome Supply Demand**
**Overview:** Awesome Supply Demand is a specialized software platform designed to assist traders and market analysts in identifying supply and demand zones in the financial markets. With its advanced features, the platform enables users to observe Fail to Return (FTR) and Flag Limit (FL) patterns efficiently, facilitating more accurate and data-driven decision-making.
**Key Features:**
1. **Supply and Demand Zone Identification:** The pla
FREE

This trial scanner works with the other "Smart Market Structure Opportunity Scanner", and is basically an extension of that scanner with added features to find more accurate entry opportunities for day trading or refined swing trading. The most important added features are: 1) The ADRs ( Average Daily Range ) for the last 5 days would have color and +/- sign that shows the direction of each days ADR move. 2) I added RSI values for each of the trading timeframes ( 1min, 5min, 15min, 30min
FREE
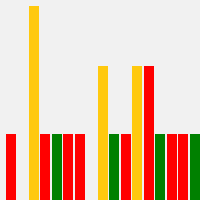
I'm excited to introduce you to the fifth bar on Martin Armstrong's Forecast Array - The Trading Cycle .
This innovative tool represents a transverse form of cyclical frequency analysis, offering a unique perspective on market trends.
The model employs a color-coded system for easy interpretation. In this model, green signals the ideal timing for highs, red indicates ideal lows, and yellow signifies a convergence of highs and lows occurring simultaneously. This intuitive approach allows
To download MT5 version please click here .
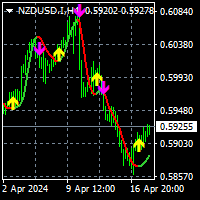
- This is the exact conversion from TradingView: " PA-Adaptive Hull Parabolic " By "Loxx".
- This is a non-repaint and light processing load indicator
- You can message in private chat for further changes you need.
- All input options are available except candle coloring.
- Buffers are available for processing within EAs.
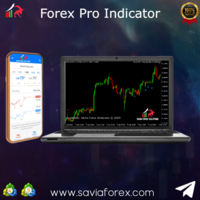
Savia Forex Pro Indicator The Savia Forex Solutions Forex Pro Indicator gives you highly accurate entries on all Forex/Currency pairs, Indices and Cryptocurrencies. The Forex Pro Indicator is dynamic and powerful and is optimized for all timeframes and ALL Currency pairs, Indices, Commodities, and Cryptocurrency pairs. Trade with improved confidence and maximize your success rate. Benefits Dynamic and Powerful FRP is fully optimized for all chart timeframes FMPL works with any asset. It can be

This Fibonacci Indicator is showing fibo retracement lines on chart same as the default tool from Metatrader's menu, except this one is fully automatic and changes along with the chart (with modes B and C, then mode A is always fixed by set levels)
AND it also offers the line levels for the Expert Advisors to read (buffers) , so you can set your trades based on crossover\crossunder on those fibo lines.
You can choose from 3 modes for selecting the max HIGH and min LOW limit,
and you can set

The Forex Correlation Indicator is a powerful tool designed to analyze and display the correlation between different major forex pairs in the market. This indicator helps traders identify relationships and trends between currency pairs, allowing for more informed trading decisions. Key Features: Displays correlation coefficients between pairs. Visualizes correlation strength through color-coded indicators. Customizable settings for timeframes and correlation calculations. User-friendly interfac
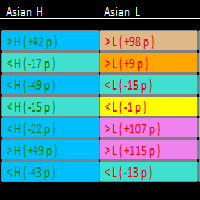
This scanner works with the other "Smart Market Structure Opportunity Scanner", and is basically an extension of that scanner with added features to find more accurate entry opportunities for day trading or refined swing trading. The most important added features are: 1) The ADRs ( Average Daily Range ) for the last 5 days would have color and +/- sign that shows the direction of each days ADR move. 2) I added RSI values for each of the trading timeframes ( 1min, 5min, 15min, 30min, 60m

Goichi Hosada ( founder of Ichimoku ) in his development of Ichimoku, spent 4.5yrs of his study just on number theory. He studied pretty much every Eastern and Western theory under the sun, and eventually settled upon 3 basis numbers that he not only made the basis of Ichimoku theory, but underlined all of reality. NOTE: I have an interesting follow up story to tell about this so remind me to discuss it later. The three numbers he made as the basis for Ichimoku were 9, 17 and 26. So the idea t
FREE
Приобретите индикатор Trend Swing, и вы можете получить еще один индикатор под названием Market Analysis БЕСПЛАТНО в качестве БОНУСА! Свяжитесь с нами лично, чтобы получить инструкции и ваш БОНУС! АКЦИЯ: $49 в течение 48 часов для празднования официального выпуска! Следующая цена - $89. (заканчивается в четверг 11-го числа в 23:59 по времени Восточного побережья)
Trend Swing - профессиональный индикатор, разработанный с нуля нашей командой экспертов. Этот индикатор чрезвычайно изощрённы

Trend Master Chart – это индикатор тренда, который вам нужен. Он накладывает диаграмму и использует цветовое кодирование для определения различных рыночных тенденций/движений. Он использует алгоритм, который объединяет две скользящие средние и разные осцилляторы. Периоды этих трех элементов можно изменить. Работает на любом таймфрейме и любой паре.
С первого взгляда вы сможете определить восходящий или нисходящий тренд и различные точки входа в этот тренд. Например, во время заметного восходя
FREE

Индикатор рисует уровни на каждый день. При входе во вчерашнюю зеленую зону - покупайте, а при входе во вчерашнюю красную зону - продавайте.
Стоп 20 пунктов. Цель - 20 пунктов или больше.
Просто разместите свои ордера и ждите.
Пары для торговли: EURUSD GBPUSD
Никаких специальных навыков не требуется. Алгоритм рассчитывает все самостоятельно.
Процент успеха отличный. Просто, но эффективно!

MASONS - инструмент который зделает из вас профессионального аналитика! Метод определения волновых движений при помощи наклонных каналов,качественно передаёт схематику движения любого инструмента,показывая не только возможные развороты на рынке,но и цели дальнейших движений!Разрушает миф о том что рынок живой ,чётко показывая схематику движениями от одного диапозона к другому! Профессиональный инструмент,подходит для среднесрочной перспективы с определением текущего тренда!
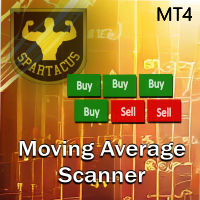
Moving Average Scanner — это многокадровый сканер, который идеально подходит для быстрого просмотра тренда на нескольких таймфреймах без изменения графика.
Он может использовать до 4 скользящих средних по вашему выбору за 9 единиц времени. Он полностью настраиваемый и может быть перемещен в любое место графика простым «перетаскиванием».
Скользящие средние можно настроить в 4 различных методах расчета. Вы также можете установить оповещения на основе количества скользящих средних и количеств
FREE

Техническая торговая система "BB Reversal Arrows" разработана с целью прогнозирования реверсных точек для принятия торговых решений.
Текущая рыночная ситуация анализируется индикатором и структурируется под несколько критериев: Ожидание разворотных моментов, потенциальные разворотные точки, сигналы покупки и продажи.
Индикатор не содержит лишнюю информацию, имеет визуальный понятный интерфейс, позволяя трейдерам принимать обоснованные решения.
Все стрелки появляются по закрытию свечи, без
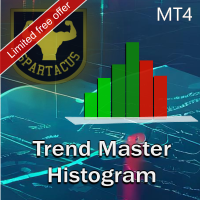
Trend Chart Histogram — индикатор, основанный на алгоритме с использованием двух скользящих средних и нескольких осцилляторов. Благодаря цветовому коду он позволяет быстро определить тенденцию и воспользоваться крупнейшими рыночными импульсами. Светлые цвета указывают на тренд, темные цвета определяют импульсы, а серый указывает на то, что вам не следует входить в рынок.
Версия для МТ5 здесь.
Обратите внимание: индикатор бесплатный до 15 мая. Тогда его цена составит $49. Входные параметры: -
FREE
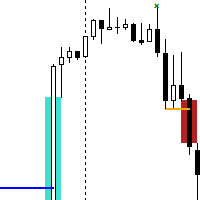
The Break of Structure (BoS) and Change of Character indicator with Fair Value Gap (FVG) filter is a specialized tool designed to enhance trading strategies by pinpointing high-probability trading opportunities on price charts. By integrating the BoS and Change of Character concepts with the FVG formation, this indicator provides traders with a robust filtering mechanism to identify optimal entry and exit points. The indicator identifies instances where the structure of price movements is disrup
FREE
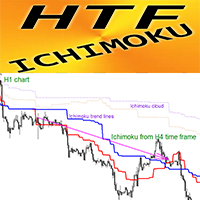
Forex Indicator HTF Ichimoku for MT4 Ichimoku indicator is one of the most powerful trend indicators . H TF means - H igher Time Frame This indicator is excellent for Trend Traders as well as combination with Price Action entries. HTF Ichimoku Indicator allows you to attach Ichimoku from Higher time frame to your current chart. Up trend - red line above blue one (and both lines are above cloud) / Down trend - red line below blue one (and both lines are below cloud) Open BUY orders

Forex Indicator INSIDE Bar Pattern for MT4 Indicator " INSIDE Bar " is very powerful indicator for Price Action trading Indicator detects INSIDE Bar patterns on chart: Bullish INSIDE Bar - Blue arrow signal on chart (see pictures) Bearish INSIDE Bar - Red arrow signal on chart (see pictures) No repaint; No delays; High R/R ratio (reward/risk); PC, Mobile & Email alerts are included Indicator " INSIDE Bar Pattern" is excellent to combine with Support/Resistance Levels: htt
123456789101112131415161718192021222324252627282930313233343536373839404142434445464748495051525354555657585960616263646566676869707172737475767778798081828384858687888990919293949596979899100101102103104105106107108109110111112113114115116117118119120121122123124125126127128129130131132133134135136137
Узнайте, как легко и просто купить торгового робота в MetaTrader AppStore - магазине приложений для платформы MetaTrader.
Платежная система MQL5.community позволяет проводить оплату с помощью PayPal, банковских карт и популярных платежных систем. Кроме того, настоятельно рекомендуем протестировать торгового робота перед покупкой, чтобы получить более полное представление о нем.
Вы упускаете торговые возможности:
- Бесплатные приложения для трейдинга
- 8 000+ сигналов для копирования
- Экономические новости для анализа финансовых рынков
Регистрация
Вход
Если у вас нет учетной записи, зарегистрируйтесь
Для авторизации и пользования сайтом MQL5.com необходимо разрешить использование файлов Сookie.
Пожалуйста, включите в вашем браузере данную настройку, иначе вы не сможете авторизоваться.