
📊 MACRO SNAPSHOT
Gold navigates a two-phase dynamic after rallying +1.27% on August 17 to $4,426, then pulling back -0.50% to $4,394 on profit-taking. Soft US data drives the narrative: retail sales plunged -0.6% vs +0.1% expected, Michigan consumer confidence dropped to 51.0 vs 55.2, and softer CPI/PPI reduced September Fed hike probability to 30% from 55%. DXY weakened to 99.5-99.7 range, supporting gold. However, rising oil prices (Brent ~$89, WTI ~$83) and 10Y Treasury yields climbing to 4.74% cap upside. Geopolitical tension in the Strait of Hormuz remains elevated with 60-day Iran-US deadline approaching without compromise. Central banks bought record 289 tons in Q2 2026, while ETFs saw $3B inflow in July. FOMC Minutes due August 20 at 14:00 ET represent the next key catalyst.
🔑 KEY LEVELS
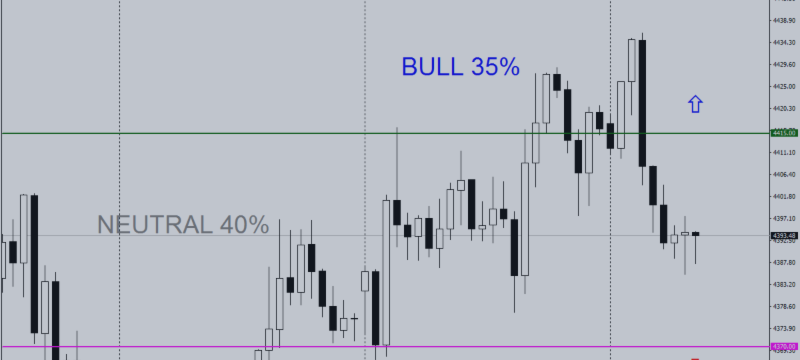
Support: 4370 | 4333 | 4262
Resistance: 4415 | 4448 | 4518
Decision rule: Watch for sustained H1 closes above 4415 for bullish continuation or below 4370 for deeper correction toward 4333.

PROBABILISTIC SCENARIOS
BULL (35%): If price reclaims and holds above 4415 with two consecutive H1 closes, target 4448 initially, then 4465-4475 zone. Confirmation requires displacement candle closing above 4420 with expanding volume.
NEUTRAL (40%): If price oscillates between 4370 and 4415, expect range-bound consolidation around 4392 midpoint. Market likely digests recent +10% monthly gain ahead of FOMC Minutes.
BEAR (25%): If price breaks and sustains below 4370 with confirmed H1 close, target 4333 initially, then 4310-4305 zone. This would signal deeper profit-taking after failed attempt at 4440+ highs.
📐 PRICE ACTION & MARKET STRUCTURE
From a structural perspective, the H1 chart exhibits a clear market structure shift from bullish impulse (August 5-11) to distribution phase (August 12-18). Price created higher highs to 4440 region but failed to sustain, forming a supply block between 4425-4440. Current price trades in discount relative to the 4370-4440 dealing range. Recent candles show liquidity sweep above 4430 followed by mitigation and rejection. The 4370-4380 zone represents a demand area from August 14-15 consolidation. Watch for displacement candles to confirm directional bias. Premium array above 4415 limits upside without fresh catalyst, while sell-side liquidity rests below 4365.
️ DISCLAIMER: This content is strictly for educational and informational purposes only. It does not constitute financial advice, investment advice, trading signals, or a recommendation to buy or sell any instrument. Past performance does not guarantee future results. Always conduct your own research and consult a licensed financial advisor before making any investment decision.
💬 Where are you watching gold this week — breakout above 4415 or fade back to 4370? I'd genuinely love to hear your take on how the FOMC Minutes might shift the bias. Drop it below.