|
13+ anos
experiência
|
0
produtos
|
0
versão demo
|
|
7
trabalhos
|
0
sinais
|
0
assinantes
|
Trajecta - Consultoria e Projeto de Robôs - http://www.trajecta.com.br
LinkedIn: https://br.linkedin.com/in/figurelli
Livros publicados: https://goo.gl/j9mhPi
Cursos publicados: https://www.udemy.com/user/rogerio-figurelli/
Entrevista com Rogério Figurelli (ATC 2012) https://www.mql5.com/en/articles/561
---
LinkedIn: https://br.linkedin.com/in/figurelli
Livros publicados: https://goo.gl/j9mhPi
Cursos publicados: https://www.udemy.com/user/rogerio-figurelli/
Entrevista com Rogério Figurelli (ATC 2012) https://www.mql5.com/en/articles/561
---


Widianto Pramana

Wolfgang Rockert
Ontem
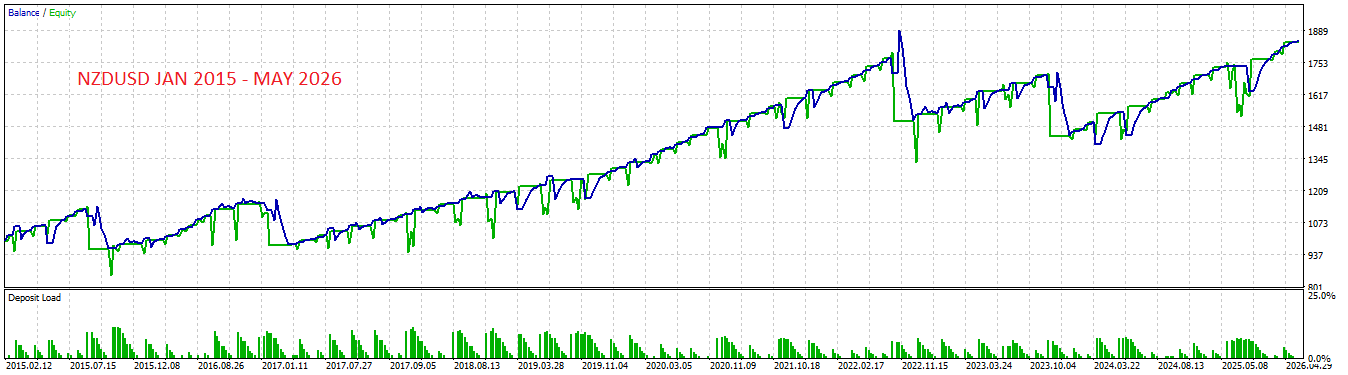
if you start on the peak then you loose a lot after some days DD from 25 - 41 % is Terrible
Widianto Pramana
4 horas atrás
Appreciate the honest feedback — this is exactly the kind of question that deserves a real answer, not a sales pitch. You're correct on both points: DD of 25–41% is significant, and entering at the wrong time with an averaging EA can amplify that temporarily. Here's the context behind the numbers: • The 41% figure is the worst-case across 11 years — not a regular occurrence
• The EA recovered each time and closed the 11-year test in profit
• NZDUSD (the recommended starting pair) had the lowest DD at 25.66% and the highest Recovery Factor at 1.80 I'm genuinely curious — what DD level would you consider acceptable for an EA running 11+ years through COVID, 2022 rate hikes, and multiple volatile cycles? Asking because I'd like to understand where the community benchmark sits. And for anyone reading: yes, this EA carries real risk. Please demo test before going live.