Rogerio Figurelli
Rogerio Figurelli
3.7 (14)
  • Information
14+ years
experience
0
products
0
demo versions
7
jobs
0
signals
0
subscribers
Trajecta - Consultoria e Projeto de Robôs - http://www.trajecta.com.br
LinkedIn: https://br.linkedin.com/in/figurelli
Published books: https://goo.gl/j9mhPi
Evgeniy Zhdan
Evgeniy Zhdan Published product

Big KC — Keltner Channel panels for multiple timeframes Big KC displays Keltner Channels for up to four timeframes at once, in a compact panel placed directly on your price chart. There is no need to switch charts or open extra windows: volatility and direction of several timeframes are visible at the same time. Every timeframe has its own channel settings. MetaTrader 5 version:  https://www.mql5.com/en/market/product/207053 How it works The indicator draws a single panel on the chart that

Evgeniy Zhdan
Evgeniy Zhdan Published product

Big KC — Keltner Channel panels for multiple timeframes Big KC displays Keltner Channels for up to four timeframes at once, in a compact panel placed directly on your price chart. There is no need to switch charts or open extra windows: volatility and direction of several timeframes are visible at the same time. Every timeframe has its own channel settings. MetaTrader 4 version: https://www.mql5.com/en/market/product/207054 How it works The indicator draws a single panel on the chart that

Vytautas Paliokas
Vytautas Paliokas
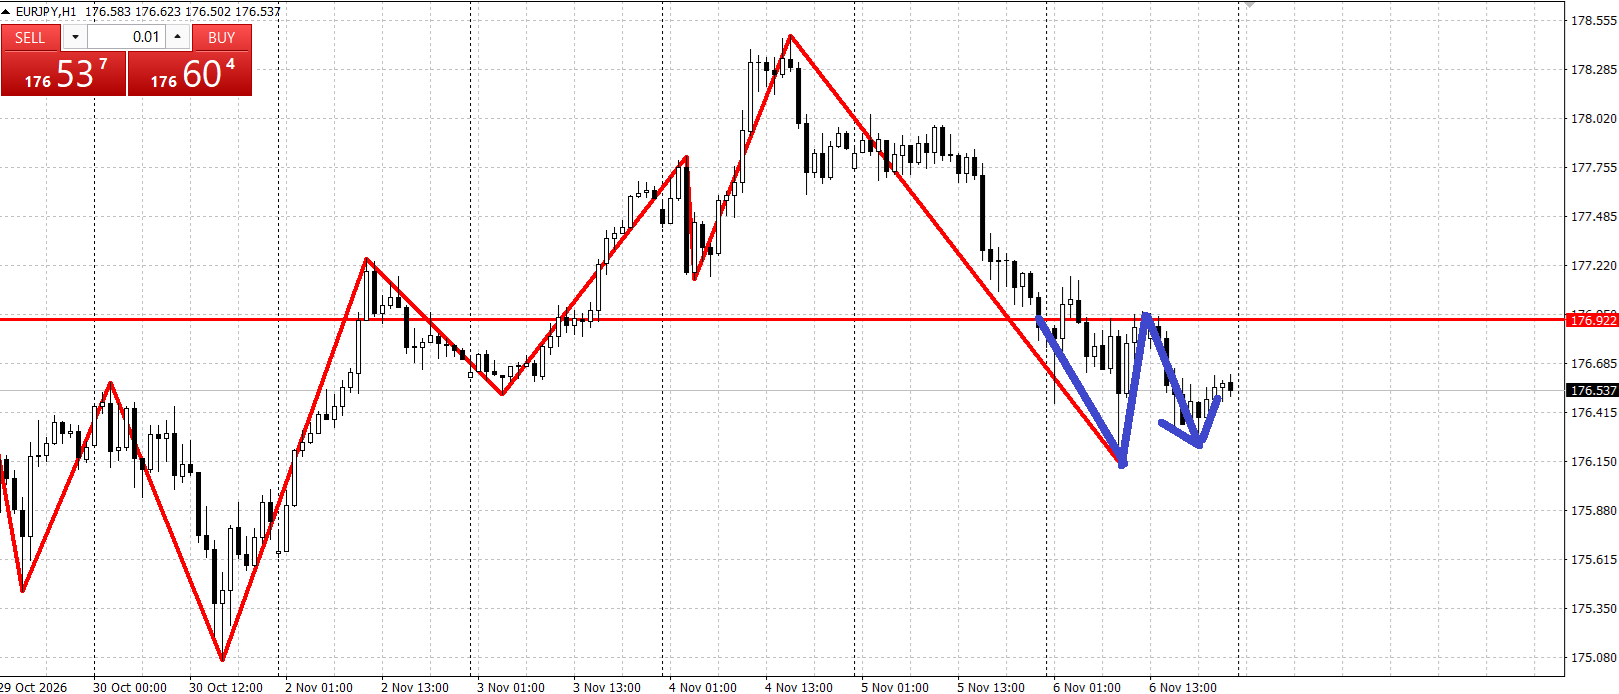
EUR/JPY Intraday Breakdown: 176.70 Buy Entry to Scratch Exit 📈
https://www.mql5.com/en/signals/2398696

Entry Thesis (176.70): Bought EUR/JPY at a key technical support zone. Looking for a bullish bounce and upside expansion off intraday demand.

Price Action & Execution: The anticipated bullish follow-through struggled to gain traction. Sellers capped upside attempts, leaving price consolidating sideways in a tight range.

Risk Management & Exit: As upside momentum stalled out heading into the Friday close, closed the trade near break-even rather than carrying weekend holding risk.

Key Takeaway: Protecting capital when a buy setup loses momentum is a disciplined win. Preserve equity and move on to the next opportunity!
Evgeniy Zhdan
Evgeniy Zhdan Published product

Pythagorean — Trend Direction Change Indicator Overview Pythagorean shows the current trend direction right on the price chart as a row of colored dots that follow price. Green dots mean upward movement, red dots mean downward movement. A change of dot color marks a change of trend direction. The indicator works on any symbol and any timeframe. Values on a closed candle are never redrawn. MT4-version: https://www.mql5.com/en/market/product/80110 How to read it Green dots: the trend points up

Vladimir Pastushak
Vladimir Pastushak
Hello, traders! Today I would like to discuss one of the most important questions for anyone starting their journey in financial markets: how can we make money from trading without exposing our accounts to uncontrolled losses...
Vladimir Pastushak
Vladimir Pastushak
Здравствуйте, друзья! Сегодня я предлагаю поговорить на тему, которая интересует практически каждого начинающего трейдера. Как заработать на финансовых рынках, не потерять свой депозит и превратить торговлю из постоянной борьбы с рынком в понятную и управляемую деятельность...
Evgeniy Zhdan
Evgeniy Zhdan
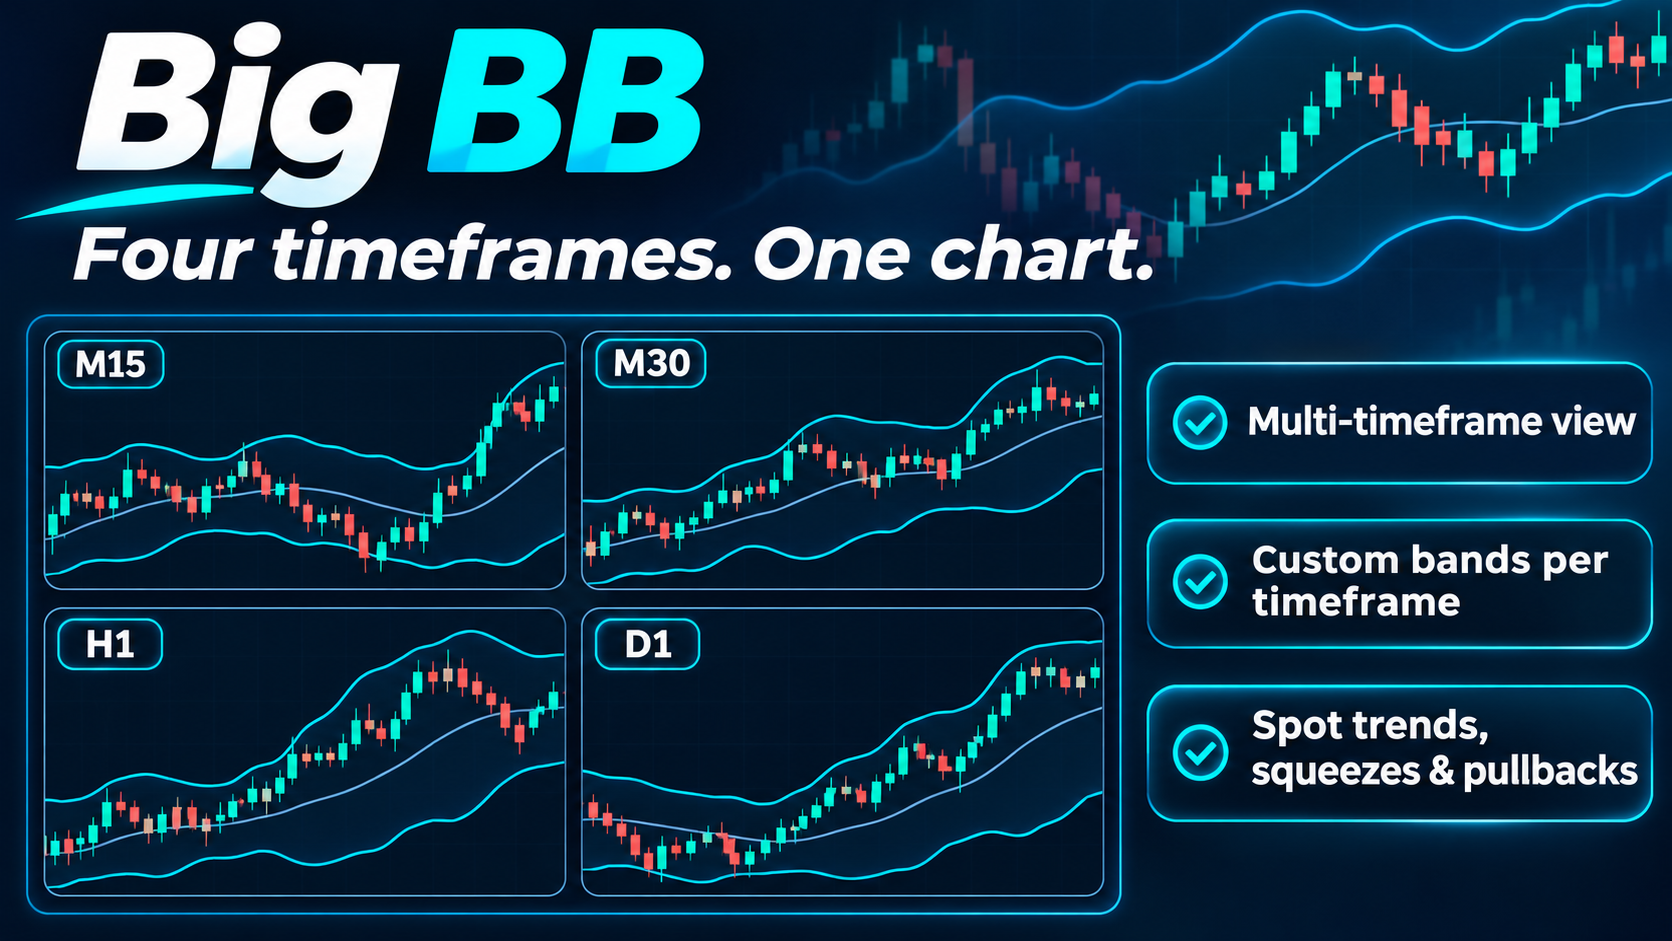
Big BB — Bollinger Bands mini-panels for four timeframes on one chart

Big BB places compact panels directly on the price chart. Each panel shows the recent candles of a chosen timeframe together with the Bollinger Bands of that timeframe. There is no need to switch between M15, M30, H1 and D1: all of them are visible at the same time. Each timeframe has its own Bollinger Bands period and deviation.

MT-4 version: https://www.mql5.com/en/market/product/206941

MT-5 version: https://www.mql5.com/en/market/product/206940
Evgeniy Zhdan
Evgeniy Zhdan Published product

30.00 USD

Big BB — Bollinger Bands mini-panels for four timeframes on one chart Big BB places compact panels directly on the price chart. Each panel shows the recent candles of a chosen timeframe together with the Bollinger Bands of that timeframe. There is no need to switch between M15, M30, H1 and D1: all of them are visible at the same time. Each timeframe has its own Bollinger Bands period and deviation. MetaTrader 5 version:  https://www.mql5.com/en/market/product/206940 What you see on the

Ihor Otkydach
Ihor Otkydach
ULTRA sistemiyle yapılan işlem haftası sona erdi. Sonuç: 1191 USD Ne güzel bir başlangıç! ULTRA SİSTEM AÇIKLAMASI BURADA BURADA TİCARET YAPMAK İÇİN EN İYİ ARACI KURUM TELEGRAM GRUBUM BURADA YouTube kanalım burada. ULTRA sisteminin fiyat tablosundaki görünümü şu şekildedir...
Ihor Otkydach
Ihor Otkydach
La settimana di trading con il sistema ULTRA si è conclusa. Risultato: 1191 USD Che bell'inizio! DESCRIZIONE DEL SISTEMA ULTRA QUI IL MIO MIGLIOR BROKER PER IL TRADING QUI IL MIO GRUPPO TELEGRAM QUI IL MIO CANALE YOUTUBE QUI Ecco come appare il sistema ULTRA sul grafico dei prezzi...
Ihor Otkydach
Ihor Otkydach
La semaine de trading avec le système ULTRA est terminée. Résultat : 1191 USD Quel beau début ! DESCRIPTION DU SYSTÈME ULTRA ICI MON MEILLEUR COURTIER POUR LE TRADING ICI MON GROUPE TELEGRAM ICI MA CHAÎNE YOUTUBE ICI Voici à quoi ressemble le système ULTRA sur le graphique des prix...
Ihor Otkydach
Ihor Otkydach
ULTRA 시스템을 이용한 일주일간의 거래가 종료되었습니다. 결과: 1191 USD 아주 좋은 시작이네요! 울트라 시스템 설명은 여기에 있습니다. 제가 추천하는 최고의 거래 브로커는 다음과 같습니다. 제 텔레그램 그룹은 여기입니다 제 유튜브 채널은 여기입니다. ULTRA 시스템의 가격표는 다음과 같습니다...
Ihor Otkydach
Ihor Otkydach
Die Handelswoche mit dem ULTRA-System ist beendet. Ergebnis: 1191 USD Was für ein schöner Start! ULTRA-SYSTEMBESCHREIBUNG HIER MEIN BESTER BROKER FÜR DEN HANDEL HIER MEINE TELEGRAM-GRUPPE HIER HIER IST MEIN YOUTUBE-KANAL So sieht das ULTRA-System im Preisdiagramm aus...
Ihor Otkydach
Ihor Otkydach
ULTRAシステムを用いた取引週間が終了しました。 結果:1191米ドル 素晴らしいスタートですね! ウルトラシステムの説明はこちら ここで取引するのに最適なブローカー 私のテレグラムグループはこちら 私のYouTubeチャンネルはこちら 価格表におけるULTRAシステムの表示は以下のとおりです...
Ihor Otkydach
Ihor Otkydach
A semana de negociação com o sistema ULTRA chegou ao fim. Resultado: 1191 USD Que ótimo começo! DESCRIÇÃO DO SISTEMA ULTRA AQUI Minha melhor corretora para operar no mercado financeiro está aqui...
Ihor Otkydach
Ihor Otkydach
Ha finalizado la semana de operaciones con el sistema ULTRA. Resultado: 1191 USD ¡Qué buen comienzo! DESCRIPCIÓN DEL SISTEMA ULTRA AQUÍ MI MEJOR CORREDOR PARA OPERAR AQUÍ MI GRUPO DE TELEGRAM AQUÍ MI CANAL DE YOUTUBE AQUÍ Así es como se ve el sistema ULTRA en el gráfico de precios...
Ihor Otkydach
Ihor Otkydach

一週內獲利 1191 美元

8 November 2026, 08:55
使用ULTRA系统进行交易的一周已经结束。 结果:1191 美元 真是个不错的开始! 超强系统描述在此 我在这里交易的最佳经纪商 我的 Telegram 群组在这里 我的YouTube频道在这里 这就是ULTRA系统在价格图表上的样子:...
Ihor Otkydach
Ihor Otkydach
The week of trading with the ULTRA system has ended. Result: 1191 USD What a nice start! ULTRA SYSTEM DESCRIPTION HERE MY BEST BROKER FOR TRADING HERE MY TELEGRAM GROUP HERE MY YOUTUBE CHANNEL HERE This is how the ULTRA system looks on the price chart...
Ihor Otkydach
Ihor Otkydach
The week of trading with the ULTRA system has ended. Result: 1191 USD What a nice start! ULTRA SYSTEM DESCRIPTION HERE MY BEST BROKER FOR TRADING HERE MY TELEGRAM GROUP HERE MY YOUTUBE CHANNEL HERE This is how the ULTRA system looks on the price chart...
Evgeniy Zhdan
Evgeniy Zhdan Published product

30.00 USD

Big BB — Bollinger Bands mini-panels for four timeframes on one chart Big BB places compact panels directly on the price chart. Each panel shows the recent candles of a chosen timeframe together with the Bollinger Bands of that timeframe. There is no need to switch between M15, M30, H1 and D1: all of them are visible at the same time. Each timeframe has its own Bollinger Bands period and deviation. MetaTrader 4 version: https://www.mql5.com/en/market/product/206941 What you see on the chart A