Trend Esay MTF

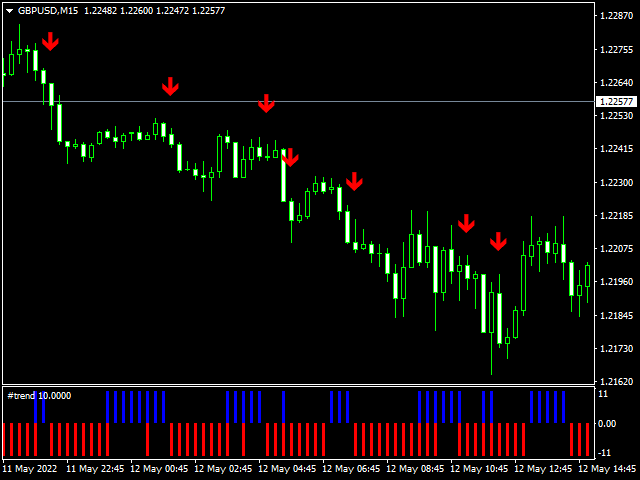
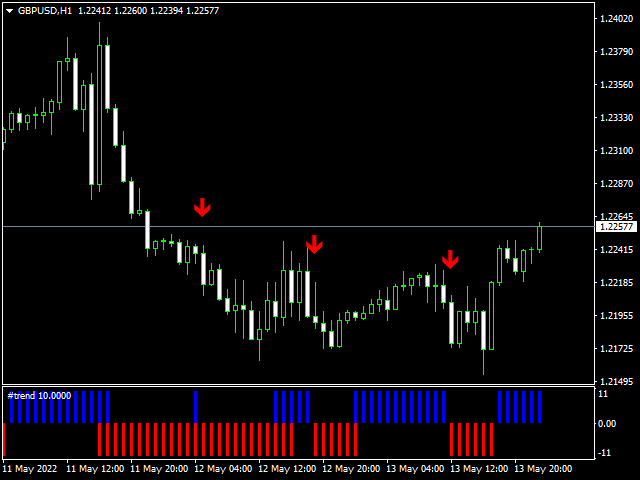
Trend indicator Trend Esay MTF is an indicator that draws arrows directly on the price chart.

Like every trend indicator, it works well with good price movement and worse in a flat.

A feature of this indicator is the ability to send alerts both in the terminal and on a smartphone.

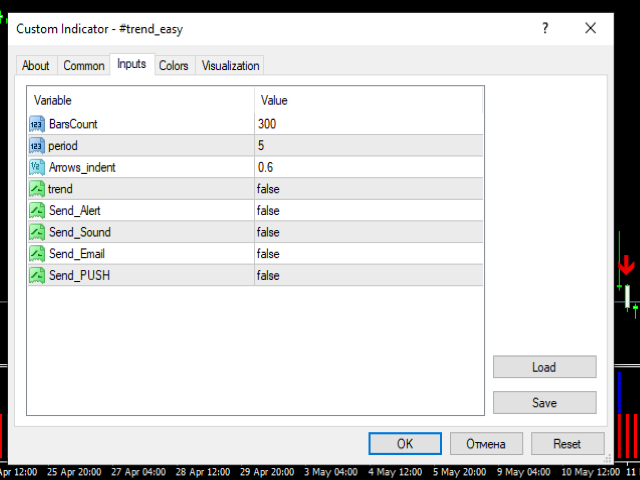
The indicator menu contains the number of bars in the history of the indicator

and period value for determining the trend.

The "trend" function has been added to the indicator menu, which filters the indicator signals.


Produtos recomendados
Lines Profit Loss
Taras Slobodyanik
4.65 (17)
O indicador exibe lucro (perda) no símbolo atual. Você pode arrastar e soltar livremente a linha para exibir o lucro ou perda atual. Você pode encontrar meus produtos aqui Parâmetros Calculation in money or in points — calcule o lucro/perda em pontos ou dinheiro. Add pending orders to calculate — leve em consideração os pedidos pendentes nos cálculos. Magic Number (0 - all orders on symbol) — número mágico, caso seja necessário avaliar pedidos específicos. Offset for first drawing (points fro
FREE
Candle Countdown — Tempo preciso até o fechamento da vela para MT4 Candle Countdown é um  instrumento simples e preciso que mostra o tempo restante até o fechamento da vela atual diretamente no gráfico. Quando a entrada depende do fechamento da vela, até mesmo alguns segundos fazem diferença. Este indicador permite ver o tempo exato e tomar decisões sem pressa ou suposições. Um indicador para controle preciso do fechamento da vela. O indicador mostra: tempo restante até o fechamento da vela hor
FREE
Índice de Decomposição de Volume (VDI) O VDI é um indicador proprietário de análise de volume, desenvolvido para identificar a força e a direção do movimento do preço com base na decomposição do volume em atividades de compra e venda. O indicador visualiza a proporção entre compras e vendas, projetando os dados de preços das velas sobre o volume correspondente. Isso permite ao trader obter uma visão mais completa da dinâmica do mercado — ou seja, quanto do volume foi impulsionado por compradores
FREE
Heiken Ashi Button
Lee Teik Hong
4.75 (4)
Heiken Ashi Button Heiken-Ashi , often spelled Heikin-Ashi, is a Japanese word that means "Average Bar." The Heiken-Ashi approach can be used in conjunction with candlestick charts to spot market trends and forecast future prices. It's useful for making candlestick charts easier to read and analysing patterns. Traders can use Heiken-Ashi charts to determine when to stay in trades while the trend continues and close trades when the trend reverses. The majority of earnings are made when markets a
FREE
Show Pips
Roman Podpora
4.26 (58)
Este indicador de informação será útil para quem quer estar sempre atento à situação atual da conta. O indicador exibe dados como lucro em pontos, porcentagem e moeda, bem como o spread do par atual e o tempo até o fechamento da barra no período atual. VERSÃO MT5 -   Indicadores mais úteis Existem várias opções para colocar a linha de informação no gráfico: À direita do preço (corre atrás do preço); Como comentário (no canto superior esquerdo do gráfico); No canto selecionado da tela. Também é
FREE
This classic "old school" MAGIC MACD indicator gives you the cross of the parameters you set. Standart setting is (12,26,9) . The arrows give you a possible change of trend. Be careful and do not use this indicator as a single signal source. FREE version  Please feel free to check out our other REX indicator series. We do have other free indicators.     "OLD BUT GOLD"
FREE
MASi Three Screens
Aleksey Terentev
5 (2)
MASi Three Screens is based on the trading strategy by Dr. Alexander Elder. This indicator is a collection of algorithms. Algorithms are based on the analysis of charts of several timeframes. You can apply any of the provided algorithms. List of versions of algorithms:     ThreeScreens v1.0 - A simple implementation, with analysis of the MACD line;     ThreeScreens v1.1 - A simple implementation, with analysis of the MACD histogram;     ThreeScreens v1.2 - Combines the first two algorithms in
FREE
Descrição O Market Phase Analyzer é um indicador avançado desenvolvido para identificar as três principais fases do mercado: Acumulação, Manipulação e Distribuição. Através da análise automática de sessões, o indicador desenha a Caixa Asiática (Asia Box), detecta movimentos de varredura acima ou abaixo de níveis-chave e confirma reversões com o filtro ATR para reduzir sinais falsos. Principais Funcionalidades Destaque da sessão asiática com caixa personalizável. Detecção automática de varred
FREE
Williams Precision Prime
Steffen Reinhold Noll
5 (2)
Williams Precision Prime – Precision Meets Legend Williams Precision Prime is a high-performance trend-following indicator that bridges the gap between Larry Williams' time-tested logic and modern algorithmic filtering, all wrapped in the exclusive Peak Precision design. Engineered for traders who demand clarity, stability, and mathematically sound entries, this system utilizes a triple-layer EMA strategy (100, 50, and 21) to identify high-probability "Cross-Momentum" setups within a confirmed d
FREE
Zentrade
Dmytro Kasianov
Zentrade é o seu passo rumo ao nível profissional. É um indicador que oferece consistência, clareza e precisão para que possa operar com confiança, sabendo que o seu sinal não desaparecerá e a sua lógica não será comprometida. Sem redesenho. Nunca. Os sinais de COMPRA e VENDA são gerados instantaneamente na vela atual e são permanentes. O que vê é a realidade. Lógica inalterada. Os sinais anteriores não são eliminados nem alterados. Pode analisar o histórico com total confiança de que o
FREE
Wise Men Indicator demo
Bohdan Kasyanenko
3 (2)
The indicator displays signals according to the strategy of Bill Williams on the chart. Demo version of the indicator has the same features as the paid, except that it can work only on a demo account . Signal "First Wise Man" is formed when there is a divergent bar with angulation.  Bullish divergent bar - with lower minimum and closing price in the upper half. Bearish divergent bar - higher maximum and the closing price at the bottom half. Angulation is formed when all three lines of Alligator
FREE
The Slope
Naim El Hajj
4 (3)
The Slope  is an MT4 indicator that calculates the slope of the price, and draws a histogram so you could see when it's positive, negative, or ranging. Key Features: Calculates Slope of the Line Chart Shows the numbers as a Histogram below the chart Choose Different Periods for calculating the slope. Sends  Alerts and Push Notifications when slope changes direction Settings: CalculationPeriod:  The number of bars used to calculated the slope ( for example, if CalculationPeriod = 10, The Slope w
FREE
Super Trend Ind
Alexander Chertnik
4.73 (41)
Super Trend Indicator uses two moving averages for calculating the trend direction.  Combination with other market signals and analysis is necessary and provides more stable results. Indicator can be easily customized by the user including change of colors, with and arrow sizes. FREE   Super Trend Expert Advisor >  https://www.mql5.com/en/market/product/81160?source=Site +Profile+Seller
FREE
SuperTrend V
Muhammad Hassaan
*This is TradingView indicator converted to mql4* The SuperTrend V indicator is a popular technical analysis tool used to identify trends and potential trend reversals in financial markets. It is based on the concept of the SuperTrend indicator but incorporates additional features and variations. The SuperTrend V indicator uses a combination of price action and volatility to determine the trend direction and generate trading signals. Here are the key components and features of the indicator: Ca
Color Macd Tf
Syarif Nur Arief
5 (1)
MACD is well known indicator that still can be use for prediction where price will go next few minutes, hours or even weekly  With colored bar of Macd, your eyes can easily catch when color is changed based what market price movement to find any early trend on market. here is the parameter of the indicator: TF_MACD , default is 1 Hour , this mean you can see clearly MACD of 1 Hour TimeFrame on Lower TimeFrame. InpPrice , default is Price Close , this is original MACD parameter from Metaquotes st
FREE
NearONE
Vasiliy Anokhin
5 (1)
NearONE displays the average value of the price deviation in points for a specified period in a subwindow of a selected trading instrument. Inputs : DRAWs - number of bars to display the indicator; NearPeriod - indicator period. If NearPeriod is 0 , recommended periods are used for each chart timeframe. If NearPeriod = 0: M1 timeframe - period = 60 ; M5 timeframe - period = 48 ; M15 timeframe - period = 96 ; M30 timeframe - period = 192 ; H1 timeframe - period = 96 ; H4 timeframe - period = 3
FREE
Description: This Free Indicator will allow you to monitor the Max/Min spread in a bar/candle. By running it 24h/24h will allow you to recognize which period of time having maximum spread, based on that you will understand the market more, and could develop/improve to have better trading strategy. Parameters: limit: <specify the limit of spread, above which the indicator will mark the price, at which high spread occurs> Note: Beside the price marked due to high spread above, the indicator al
FREE
Not everyone can write an indicator. But anyone can have an idea. The indicator Universal Separate Window Free , which takes as an input parameter the formula by which the indicator line will be drawn, will help to implement it. This indicator is intended for use in the separate chart window. All indicators of the series Universal : Main window Separate window Free MT4 Universal Main Window Free MT5 Universal Main Window Free MT5 MT4 Universal Separate Window Free MT5 Universal Separate Window
FREE
Delta AG Free
Yurij Kozhevnikov
5 (2)
The difference between the arithmetic and geometric means at the specified range. Since the greater is the difference between the values, the greater the resulting figure is, actually the indicator shows volatility fluctuations. The arithmetic mean of a certain number of values ​​is the sum of the values ​​divided by their number. The geometric mean is the root of the power of the number of values ​​extracted from the product of these values. If all values ​​are equal, the arithmetic mean and th
FREE
Price Velocity
Oleg Pechenezhskiy
5 (2)
The indicator calculates the average price velocity over the specified time period. It is known that the trading time flows unevenly, in bursts. It either goes faster, or slows down. This indicator will tell if the trading time has accelerated and it is necessary to go to the smaller timeframes to search for trade signals. Usage Alert is generated when the price velocity exceeds the specified threshold. The threshold value can be modified using the buttons on the information panel. A .wav file
FREE
APriceChannel is a modification of the standard Price_Channel indicator. The EA draws 2 levels - the upper level shows the price High for the specified period of time, the lower level shows the price Low for the same period. In addition to the period, you can set vertical offset in points to widen the channel up and down. This prevents false breakouts of current support/resistance levels. Inputs Period - time period in bars - the number of bars to calculate the price High/Low. Offset up and dow
FREE
SC MTF Rsi MT4
Krisztian Kenedi
5 (1)
Indicador de Índice de Força Relativa (RSI) com suporte multi-timeframe, sinais visuais personalizáveis e sistema de alertas configurável. Serviços de programação freelance, atualizações e outros produtos TrueTL estão disponíveis no meu perfil MQL5 . Feedbacks e avaliações são muito apreciados! O que é o RSI? O Índice de Força Relativa (RSI) é um oscilador de momentum que mede a velocidade e a magnitude das variações de preço. O indicador oscila entre 0 e 100, comparando a magnitude dos ganho
FREE
FlatBreakout
Aleksei Vorontsov
FlatBreakout (Free Version) Flat Range Detector and Breakout Panel for MT4 — GBPUSD Only FlatBreakout is the free version of the professional FlatBreakoutPro indicator, specially designed for flat (range) detection and breakout signals on the GBPUSD pair only. Perfect for traders who want to experience the unique fractal logic of FlatBreakout and test breakout signals on a live market without limitations. Who Is This Product For? For traders who prefer to trade breakout of flat ranges (breakout,
FREE
Toby Strategy Indicator
Ahmd Sbhy Mhmd Ahmd ʿYshh
The indicator rely on The Toby strategy >> The mother candle which is bigger in range than the previous six candles. A vertical line shows the last Toby Candle with the targets shown up and down. The strategy is about the closing price out of the range of the toby candle to reach the 3 targets..The most probable to be hit is target1 so ensure reserving your profits and managing your stop lose.
FREE
Trendline indicator
David Muriithi
2 (1)
Are you tired of drawing trendlines every time you're analyzing charts? Or perhaps you would like more consistency in your technical analysis. Then this is for you. This indicator will draw trend lines automatically when dropped on a chart. How it works Works similar to standard deviation channel found on mt4 and mt5. It has 2 parameters: 1. Starting Bar 2. Number of bars for calculation The   starting bar   is the bar which drawing of the trend lines will begin, while the   number of bars for c
FREE
This is a   custom MT4 indicator   called   “Elsna Moving Average” . It plots   three moving averages (MA1, MA2)   on the chart with customizable periods, shifts, methods, and applied prices. MA1 & MA2   can optionally be used to create   fill areas   (histogram-like shading) based on a color-fill setting You can   show or hide each MA   individually. The indicator is designed for   trend identification and visualization , helping traders see MA relationships and potential support/resistance zon
FREE
Candlestick Oscillator
Stephen Reynolds
4 (1)
Candlestick Oscillator is a truly unique Oscillator that uses the concepts of within candlestick trading called the Record Session High. This is a method of analysing candlesticks to gauge when a trend might be wearing out and therefore ready for reversal or pause. We call it a record session high when we get 8 or more previous candles that have higher closes. We call it a record session low when we get 8 or more previous candles that have lower closes.  We don't rely on the typical Oscillation
FREE
............................................hi................................................ .........................its a simple indicator of movings ............................ .........................a diffrent show of moving averages.......................... ...............can select period , shift , mode and applied price.................. ............many traders use movings for find market movement................. ...........................it can helpfull for finding trends.......
FREE
Stat Monitor is a good information indicator. Benefits of the indicator: The indicator provides useful information - the current spread, the cost of one lot of the symbol, trading leverage and the recommended lot size for trading. You can use the indicator on the MetaTrader 4 trading platform of any broker. The indicator provides useful information. Version of the Stat Monitor indicator for MetaTrader 5 I wish you all good luck in trading and stable profit!
FREE
Price Force Analyzer
Joel Protusada
1 (1)
P R I C E   F O R C E   A N A L Y Z E R    This is a complex indicator that calculates the force of the price direction.           V E R Y  I M P O R T A N T     This is not a stand alone indicator. Use it together with your own strategy. This indicator only confirms your possible position. You can run it in any charts and timeframes but H1 is recommended. Make sure that the pair is volatile at the time of trading. If you don't have a solid volatility-based strategy yet, y
FREE
Os compradores deste produto também adquirem
Gann Made Easy
Oleg Rodin
4.83 (162)
Gann Made Easy é um sistema de negociação Forex profissional e fácil de usar, baseado nos melhores princípios de negociação usando a teoria do sr. W. D. Gann. O indicador fornece sinais precisos de COMPRA e VENDA, incluindo níveis de Stop Loss e Take Profit. Você pode negociar mesmo em movimento usando notificações PUSH. Entre em contato comigo após a compra para receber instruções de negociação e ótimos indicadores extras gratuitamente! Provavelmente você já ouviu muitas vezes sobre os métodos
O sistema PRO Renko é um sistema de negociação altamente preciso especialmente concebido para a negociação de gráficos RENKO. Trata-se de um sistema universal que pode ser aplicado a vários instrumentos de negociação. O sistema neutraliza eficazmente o chamado ruído de mercado, dando-lhe acesso a sinais de inversão precisos. O indicador é muito fácil de usar e tem apenas um parâmetro responsável pela geração de sinal. Você pode facilmente adaptar a ferramenta a qualquer instrumento de negocia
M1 Sniper
Oleg Rodin
5 (22)
O M1 SNIPER é um sistema indicador de negociação fácil de usar. É um indicador de seta projetado para o período M1. O indicador pode ser usado como um sistema independente para scalping no período M1 e pode ser usado como parte do seu sistema de negociação existente. Embora este sistema de negociação tenha sido projetado especificamente para negociação no M1, ele também pode ser usado em outros períodos. Originalmente, desenvolvi este método para negociar XAUUSD e BTCUSD. Mas considero-o útil ta
Advanced Supply Demand
Bernhard Schweigert
4.91 (299)
Atualmente com 40% de desconto! A melhor solução para qualquer Trader Novato ou especialista! Este indicador é uma ferramenta de negociação exclusiva, de alta qualidade e acessível porque incorporamos uma série de recursos proprietários e uma nova fórmula. Com esta atualização, você poderá mostrar fusos horários duplos. Você não só será capaz de mostrar um TF mais alto, mas também mostrar ambos, o TF do gráfico, MAIS o TF mais alto: MOSTRANDO ZONAS ANINHADAS. Todos os traders de Oferta e Demanda
Scalper Inside PRO
Alexey Minkov
4.74 (69)
Scalper Inside PRO – Since 2020. An exclusive indicator that utilizes an innovative algorithm to swiftly and accurately determine the market trend. The indicator automatically calculates opening, closing, and profit levels, providing detailed trading statistics. With these features, you can choose the most appropriate trading instrument for the current market conditions. Additionally, you can easily integrate your own arrow indicators into Scalper Inside Pro to quickly evaluate their statistics
Market Makers
Mohamed Hassan
5 (3)
After purchase, contact me privately to receive 1 month of free testing with EA Forex Proton! This advanced MT4 trading robot automatically executes signals from any MT4 indicator, including Market Makers. The latest version also includes AI integration, allowing each trade signal to be analyzed using Artificial Intelligence. Live Signal with EA Forex Proton: Click here Market Makers is a powerful price action trading system designed to identify high-probability Buy and Sell opportunities based
Sinal de tendência GoldRush Arrow O indicador Sinal de tendência GoldRush Arrow fornece uma análise precisa e em tempo real das tendências, adaptada para scalpers de alta velocidade e curto prazo em XAU/USD. Criada especificamente para o intervalo de tempo de 1 minuto, esta ferramenta exibe setas direcionais para pontos de entrada claros, permitindo que os scalpers naveguem em condições de mercado voláteis com confiança. O indicador consiste em setas de alerta PRIMÁRIAS e SECUNDÁRIAS. Os sin
NAM Divergences
NAM TECH GROUP, CORP.
5 (1)
Indicador de detecção MT4 Multi-timeframe Divergence e Overbougt / Oversold. Características - Totalmente personalizável no painel de controle do gráfico, fornece interação completa. - Oculte e mostre o painel de controle onde quiser. - Informação em tempo real sobre divergências não capitalizadas. - Informações em tempo real sobre situações de sobrecompra / sobrevenda. - Informações em tempo real sobre divergências regulares. - Informações em tempo real sobre divergências ocultas. -
Trend Screener
STE S.S.COMPANY
4.79 (95)
Indicador de tendência, solução única inovadora para negociação e filtragem de tendências com todos os recursos de tendências importantes construídos dentro de uma ferramenta! É um indicador multi-timeframe e multi-moedas 100% sem repintura que pode ser usado em todos os símbolos/instrumentos: forex, commodities, criptomoedas, índices e ações. OFERTA POR TEMPO LIMITADO: O indicador Support and Resistance Screener está disponível por apenas US$ 65 vitalício. (Preço original US$ 250) (oferta esten
Auto Optimized Parabolic RSI: Avançado Motor de Momentum 3D A maioria dos indicadores de varejo falha porque depende de parâmetros estáticos que quebram no momento em que a volatilidade do mercado muda. O Auto Optimized Parabolic RSI resolve o problema de "obsolescência do indicador" recalculando continuamente a sua própria vantagem matemática, trazendo uma adaptação quantitativa de nível institucional diretamente para o seu terminal MT5. A Vantagem Principal: Otimização 3D em Memória Personaliz
Super Signal – Skyblade Edition Sistema profissional de sinais de tendência sem repintar / sem atraso com taxa de acerto excepcional | Para MT4 / MT5 Funciona melhor em timeframes mais curtos, como 1 minuto, 5 minutos e 15 minutos. Principais características: Super Signal – Skyblade Edition é um sistema inteligente de sinais desenvolvido especificamente para operações com tendência. Utiliza uma lógica de filtragem em múltiplas camadas para detectar apenas movimentos direcionais fortes sustenta
O Apollo SR Master é um indicador de Suporte/Resistência com recursos especiais que tornam a negociação com zonas de Suporte/Resistência mais fácil e confiável. O indicador calcula as zonas de Suporte/Resistência em tempo real, sem qualquer atraso, detectando topos e fundos de preço locais. Em seguida, para confirmar a área de Suporte/Resistência recém-formada, o indicador exibe um sinal especial que indica que a zona pode ser considerada e usada como um sinal de VENDA ou COMPRA. Nesse caso, a f
O indicador " Dynamic Scalper System " foi desenvolvido para o método de scalping, operando dentro de ondas de tendência. Testado nos principais pares de moedas e ouro, é possível a compatibilidade com outros instrumentos de negociação. Fornece sinais para a abertura de posições de curto prazo ao longo da tendência, com suporte adicional para o movimento dos preços. O princípio do indicador: As setas grandes determinam a direção da tendência. Um algoritmo para gerar sinais de scalping sob a fo
ACTUALMENTE COM 40% DE DESCONTO A melhor solução para qualquer novato ou comerciante especializado! Este Indicador é uma ferramenta comercial única, de alta qualidade e acessível, porque incorporámos uma série de características proprietárias e uma nova fórmula. Com apenas UM gráfico, pode ler a força da moeda para 28 pares de Forex! Imagine como a sua negociação irá melhorar porque é capaz de apontar o ponto exacto do gatilho de uma nova tendência ou oportunidade de escalada? Manual do util
Ultimate Sniper Dashboard
Hispraise Chinedum Abraham
4.82 (22)
Desconto de $299! Os preços podem aumentar no futuro! Leia a descrição abaixo! Melhor Sistema de Entrada para Ultimate Sniper Dashboard: NÍVEIS DINÂMICOS FINAIS. (Por favor, verifique os meus produtos) O Ultimate Sniper Dashboard só funciona em mercados ao vivo devido aos limites de teste MT4 em várias moedas. Apresentamos o painel de instrumentos de Ultimate-Sniper! O nosso melhor, que contém tanto HA-Sniper, MA-Sniper. e muitos modos especiais. O Ultimate Sniper Dashboard é uma besta absolu
Currency Strength Wizard é um indicador muito poderoso que fornece uma solução completa para uma negociação bem-sucedida. O indicador calcula o poder deste ou daquele par forex usando os dados de todas as moedas em vários intervalos de tempo. Esses dados são representados em uma forma de índice de moeda fácil de usar e linhas de energia de moeda que você pode usar para ver o poder desta ou daquela moeda. Tudo o que você precisa é anexar o indicador ao gráfico que deseja negociar e o indicador mo
Atomic Analyst
Issam Kassas
5 (5)
Primeiramente, vale ressaltar que este Indicador de Negociação não repinta, não redesenha e não apresenta atrasos, tornando-o ideal tanto para negociação manual quanto automatizada. Manual do utilizador: configurações, entradas e estratégia. O Analista Atômico é um Indicador de Ação de Preço PA que utiliza a força e o momentum do preço para encontrar uma vantagem melhor no mercado. Equipado com filtros avançados que ajudam a remover ruídos e sinais falsos, e aumentam o potencial de negociação.
KT Alpha Hunter Arrows MT4
KEENBASE SOFTWARE SOLUTIONS
A maioria dos indicadores de setas entrega um sinal e deixa você descobrir todo o resto sozinho. O KT Alpha Hunter Arrows entrega um plano de trading completo. Cada seta de sinal aparece com um plano completo já desenhado no gráfico: linha de entrada, stop loss, quatro níveis de take profit e um veredito de edge em tempo real, mostrando se aquele ativo e timeframe valem a pena ser operados naquele momento. O pacote inclui o Trade Manager EA, que cuida da execução depois que você entra na operaçã
Dynamic Forex28 Navigator
Bernhard Schweigert
4.43 (7)
Dynamic Forex28 Navigator - A ferramenta de negociação Forex de última geração. ATUALMENTE 49% DE DESCONTO. Dynamic Forex28 Navigator é a evolução dos nossos indicadores populares de longa data, combinando o poder de três em um: Indicador Advanced Currency Strength28 (695 avaliações) + Advanced Currency IMPULSE com ALERTA (520 avaliações) + Sinais CS28 Combo (Bônus). Detalhes sobre o indicador https://www.mql5.com/en/blogs/post/758844 O que o Next-Generation Strength Indicator oferece?  Tudo
ACTUALMENTE 40% DE DESCONTO!! A melhor solução para qualquer novato ou comerciante especializado! Este indicador é uma ferramenta comercial única, de alta qualidade e acessível, porque incorporámos uma série de características proprietárias e uma fórmula secreta. Com apenas UM gráfico, dá alertas para todos os 28 pares de moedas. Imagine como a sua negociação irá melhorar porque é capaz de identificar o ponto exacto de desencadeamento de uma nova tendência ou oportunidade de escalada! Constr
Supply and Demand Dashboard PRO
Bernhard Schweigert
4.8 (20)
Actualmente 40% OFF ! Este painel é uma peça de software muito poderosa que trabalha em múltiplos símbolos e até 9 prazos. Baseia-se no nosso principal indicador (Melhores críticas: Advanced Supply Demand ).   O tablier dá uma óptima visão geral. Mostra:   Valores filtrados da Oferta e da Procura, incluindo a classificação da força da zona, Distâncias de/para as zonas e dentro das zonas, Destaca as zonas aninhadas, Dá 4 tipos de alertas para os símbolos escolhidos em todos os (9) períodos de
TPSpro RFI Levels
Roman Podpora
4.86 (28)
INSTRUÇÕES RUS  /  INSTRUÇÕES   ENG  /  Versão MT5 Principais funções: Exibe zonas ativas de vendedores e compradores! O indicador exibe todos os níveis/zonas de impulso iniciais corretos para compras e vendas. Quando esses níveis/zonas são ativados, onde a busca por pontos de entrada começa, os níveis mudam de cor e são preenchidos com cores específicas. Setas também aparecem para uma percepção mais intuitiva da situação. LOGIC AI - Exibição de zonas (círculos) para busca de pontos de entrada
FX Volume
Daniel Stein
4.63 (38)
FX Volume: Vivencie o Verdadeiro Sentimento de Mercado sob a Perspectiva de um Corretor Visão Geral Rápida Quer aprimorar sua abordagem de trading? FX Volume fornece insights em tempo real sobre como traders de varejo e corretores estão posicionados—bem antes de relatórios atrasados como o COT. Seja para buscar ganhos consistentes ou simplesmente ter uma vantagem mais clara no mercado, FX Volume ajuda você a detectar grandes desequilíbrios, confirmar rompimentos e aperfeiçoar sua gestão de ris
Cycle Sniper
Elmira Memish
4.39 (36)
Please contact us after your purchase and we will send you the complimentary indicators to complete the system Cycle Sniper is not a holy grail but when you use it in a system which is explained in the videos, you will feel the difference. If you are not willing to focus on the charts designed with Cycle Sniper and other free tools we provide, we recommend not buying this indicator. We recommend watching the videos about the indiactor and system before purchasing. Videos, settings  and descri
Documentation for connecting Metatrader 4 with Python with a simple drag and drop EA.   A full end-to-end solution ,fully tested ,fast and efficient! The Pytrader ecosystem consists of a python script and a MT4 EA. (  MT5  version ) Further for the licensing an indicator is used.  The communication between the python script and the EA is based on sockets. EA is the  Server   and the python script the  Client .  It is always query(function / python script) and output(data / server). The EA doe
- Real price is 80$ - 50% Discount (It is 39$ now) - just for 2 purchases. Contact me for instruction, add group and any questions! - Non-repaint - I just sell my products in Elif Kaya profile, any other websites are stolen old versions, So no any new updates or support. - Lifetime update free Related product:   Bitcoin Expert Introduction The breakout and retest strategy is traded support and resistance levels. it involves price breaking through a previous level.  The break and retest strateg
Pare de adivinhar. Comece a operar com vantagem estatística. Os índices de ações não são negociados como forex. Eles têm sessões definidas, gaps noturnos e seguem padrões estatísticos previsíveis. Este indicador fornece os dados de probabilidade que você precisa para operar índices como DAX, S&P 500 e Dow Jones com confiança. O que o torna diferente A maioria dos indicadores mostra o que aconteceu. Este mostra o que provavelmente acontecerá em seguida. Todos os dias de negociação, o indicador an
O indicador Route Lines Prices - foi concebido para identificar a direção dos preços. A sua interface simples contém múltiplos algoritmos para calcular o comportamento dos preços e a direção futura. Estes algoritmos incluem cálculos de volatilidade e suavização de preços com base nos períodos de tempo utilizados. O indicador possui um único parâmetro para alterar o valor de " Calculating price values ". O valor padrão de 1 fornece um cálculo automático equilibrado, que pode ser utilizado sem ne
Volatility Trend System - um sistema de negociação que dá sinais para entradas. O sistema de volatilidade fornece sinais lineares e pontuais na direção da tendência, bem como sinais para sair dela, sem redesenho e atrasos. O indicador de tendência monitora a direção da tendência de médio prazo, mostra a direção e sua mudança. O indicador de sinal é baseado em mudanças na volatilidade e mostra entradas no mercado. O indicador está equipado com vários tipos de alertas. Pode ser aplicado a vários i
Trend indicator AI
Ramil Minniakhmetov
4.54 (84)
O indicador Trend Ai é uma ótima ferramenta que irá melhorar a análise de mercado de um trader, combinando a identificação de tendências com pontos de entrada acionáveis e alertas de reversão. Este indicador permite que os usuários naveguem pelas complexidades do mercado forex com confiança e precisão Além dos sinais primários, o indicador Trend Ai identifica pontos de entrada secundários que surgem durante retrações ou retrações, permitindo que os comerciantes capitalizem as correções de preço
Mais do autor
Resistance and Support is an easy to use indicator to apply horizontal lines of resistance and support. There are two windows for adding levels. When you press the button, a line appears on the price chart. It is possible to move this line with the mouse, thereby changing the indicator readings. In the indicator menu there is a choice of possible alerts - no alert, alert on touching the level and an alert for closing the candle after the level.
FREE
Resistance and Support is an easy to use indicator to apply horizontal lines of resistance and support. There are two windows for adding levels. When you press the button, a line appears on the price chart. It is possible to double-click this line with the mouse to activate and move it, thereby changing the indicator readings. In the indicator menu there is a choice of possible alerts - no alert, alert on touching the level   an alert for closing the candle after the level.
FREE
My Notes
Wiktor Keller
My notes is a simple indicator that will help you put any notes on your price chart. W ith one click you get as many notes as you choose from the menu. All blanks for your entries are lined up in one column. You only need to move the records to the right place on the graph and click on the record. The menu consists of four items: My_sum_Note number of entries , default 5 ; MyMessage Font font name, default "Arial"; MyMessage FontSize font size, default 10; MyMessageColor is the font color, Black
FREE
Trend easy
Wiktor Keller
1 (1)
Trend easy простой трендовый индикатор в виде гистограмы. окно индикатора разделено на две части верхняя гистограма движение в бай, нижняя гистограма движениие в сел. Кроме гистограмы, сигнал индикатора дублируется на графике стрелками. В меню индикатора имеется количество баров в истории индикатора  значения периода для определения тренда разрешение рисования стрелок на графике код и цвета стрелок алерты и отступ стрелок
FREE
Adaptiv Ma это индикатор средняя линия  значение которой выставляется в меню и применяется на тейфрейме Н4. В последствии она адаптируется к выбранному определенному таймфрейму. В меню индикатора задаются следующие параметры 1. Период индикатора 2.Метод определения Ма. 3. Стиль Ма. 4.Толщина линии Ма. 5.Цвет линии Ма. При переключении между таймфреймами автоматически переключается значение периода Ма для адаптации к новому таймфрейму. Пишите насколько вам была полезен такой индикатор. 
FREE
Infometer
Wiktor Keller
Infometer индикатор для вывода информации в одном из углов - сколько пунктов  (пипсов) или в валюте депозита профита во всех отрытых ордеров данного торгового инструмента. В меню индикатора внесены такие данные 1. Угол вывода информации. 2. Цвет вывода информации. 3. вывод валюты депозита и пипсов. 4. Выбор вывода информации - профит и пункты - профит -пункты. На белом фоне автоматически информация выводится черным цветом на других фонах цвет вывода информации определяется в меню.
FREE
The Breakeven indicator is based on determining the breakeven levels of orders for a given instrument.  The indicator draws the breakeven level of BUY orders, the breakeven level of SELL orders.  If the number of lots between BUY orders and SELL orders between each other, the indicator draws the ALL breakeven level.  Drawing of levels is disabled in the indicator menu.
Rails
Wiktor Keller
The RAILS indicator is the identification of the candlestick analysis pattern - Price Action. It signals an imminent price reversal or pullback. The main feature is the identification of candle combinations. In this case, the indicator is looking for two adjacent candles that are directed in different directions. In the upper part there is an information panel where information about different timeframes and identified "Rails" paptterns. There is also information - how many bars to that the pat
One of the Price Action patterns called PinBar is implemented in a custom indicator. Usually means a large candle with a small body and a large tail. Such candles appear at the end of a movement or candles that indicate a continuation of the trend. The peculiarity of this PinBar indicator is that it determines the pattern on all timeframes. Information output by arrows is organized for the active timeframe and additionally for timeframes H1, H4, D1.
The Soldbar indicator is a price action candlestick pattern indicator. It indicates the begin or end of a trend. The information panel shows the last Soldbar of the found pattern on all time frames. When you hover the mouse arrow over an information bar, the pop-up menu shows the time of that bar. The signal of the active window is displayed by arrows, it is separately possible to turn on additional information timeframes H1, H4, D1.
Outsidebar is an indicator of price action candlestick patterns. The following information changes in the indicator menu 1. The number of bars in history. 2. Indent of the information panel. 3.Filter by trend. 4. Turning on the arrows of the current chart. 5. Turning on the arrows of the typhreys H1, H4, D1. 6. Inclusion of alert, signal, e-mail, push notification. 7.Select a signal. 8. Arrow indent.
Back to the Future is a trend indicator. It consists of four parts. 1. Part is the fibo levels that define the minimum and maximum targets. 2. This is a target level that defines the minimum correction targets and trend targets. 3. Dynamic levels correction targets and trend targets.. 4. Trend levels based on trend lines. All parts are included in the indicator menu. the indicator Back to the Future does not repaint. The change of information comes after the calculation of the last 3 bars.
Divergence HiLo
Wiktor Keller
3.5 (2)
Stock! Now there is a special price for the first 10 buyers. Hurry up. Divergence HiLo is an indicator that identifies highs and lows prices (High end Low) . Based on a special algorithm, the indicator determines the value of divergence or convergence. In addition to divergence or convergence values, the indicator determines the expected take levels profit. The price chart shows divergence lines, possible profit levels and arrows that indicate the formed signal of the indicator in buy or sell.
The logical continuation of the divergence indicator is the Divergence HiLo Dashboard indicator - a divergence scanner immediately for three currency pairs. In the indicator menu, select which currency pairs we will analyze. The analysis is carried out on the timeframes M15, H1, H4, D1. In addition to divergences, tops and bottoms are analyzed. All data is entered into tables Alerts are provided in the indicator. According to the logic of the indicator, the signal appears after the end of 3 bars
The Breakeven levels indicator is an indicator that, according to its algorithm of work, determines the number of open orders on a certain instrument finds the level at which all orders go from loss to profit. Separately, for sell and buy orders, the general level of the beginning of profit is found. In the lower left or right corner, information is displayed on three buttons to choose from. When you press the button, a horizontal line of a certain level is displayed on the screen. On the right
Divergence HiLo scaner is a good tool for market analysis.   The indicator looks through all currency pairs and finds those that meet the selection conditions, where corrections or reversals to the main movements are supposed to begin. The indicator values ​​are entered in the final table. 1 value is swap 2 Currency pair. 3  The number of bars after finding the selection conditions. The bar color blue is used for the buy signal. The bar color yellow is used for the sell signal. The color of the
Trade panel manual is a multifunctional trading assistant. It allows you to open market and pending orders in one click. Value is set via button menu edit or deleted by specific buttons pending orders and the value of take profit and stop loss in one click. Through the edit menu of the button, a value is set that can be easily changed by simply moving level_tp lines for take profit or stop loss levels and for pending orders. It is possible to select orders and determine for them and set the leve
The Volume com indicator is an indicator in which the price movement control mode is organized using tick volumes. Volume com indicator gives signals that can be filtered and get a good result   The main advantage of the signals of this indicator is that they appear both at the end of the trend and along its course. The indicator works on all timeframe. The first indicator in the series .
The Volume Str indicator is an indicator based on tick volumes. The very name of the indicator "Volume Street" indicates the use and sorting of volumes. according to a certain algorithm, which leads to a good result at the output. Look at the screenshots and you will see what signals it gives. The indicator does not redraw and you can use its signals after the first bar closes.
Volume mag indicator is another indicator that is used to calculate entry points tick volume. The indicator rarely gives a signal, but this can be said to be its advantage. The indicator's signals are not redrawn and do not lag, but are issued after the close of the current candle. The indicator does not overload the terminal and calculates entry points within the BarsCount value, which is set in the menu, by default 500 bar.
The Volume New indicator is the main indicator for calculating direction of price movement by tick volumes. The indicator generates the maximum number of signals that it is possible to filter according to your strategies. The indicator does not redraw or lag and generates a signal according to the settings SIGNALBAR values, default 1 - after the close of the current candle. The number of history bars for calculation is set in the indicator menu by the value BarsCount, default is 500 bars.
Back to the Future это индикатор который определяет направление тренда. Определяет  четыре уровня для роста и падения  1-й уровень  флета 2 -й уровень  коррекции  3-й уровень продолжения тренда и 4-й уровень  возможного разворота. Индикатор рисует трендовые линии краткострочного и долгострочного тренда. Так же индикатор определяет  динамические сел и бай зоны в виде прямоугольников. От ближайшего максимума или минимума рисует фибо уровни для определения целей движения.  В меню индикатора отключа
Filtro:
Sem comentários
Responder ao comentário