Colored TRIX

4.5

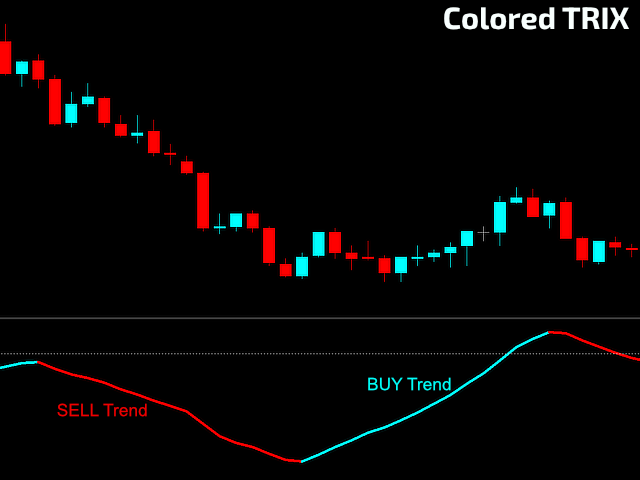
Developed by Jack Hutson in the 80's, the Triple Exponential Moving Average (a.k.a. TRIX) is a Momentum technical indicator that shows the percentage of change in a moving average that has been smoothed exponentially 3 times. The smoothing process was put in place in order to filter out price movements that are considered insignificant for the analysis period chosen.

We at Minions Labs found hard to follow the smoothness of the original TRIX line, so we colored the TRIX line with BUY and SELL trend movements.


HOW TO READ THIS INDICATOR

  • You can use this oscillator to identify Oversold and Overbought areas.
  • You can use this indicator to analyze periods where the zero-line is crossed by the TRIX signal.
  • Some traders prefer TRIX over MACD because of its smoothness.
  • Since it is not a leading indicator, the TRIX indicator can be used as a confirmation tool and/or as a trend filtering system.
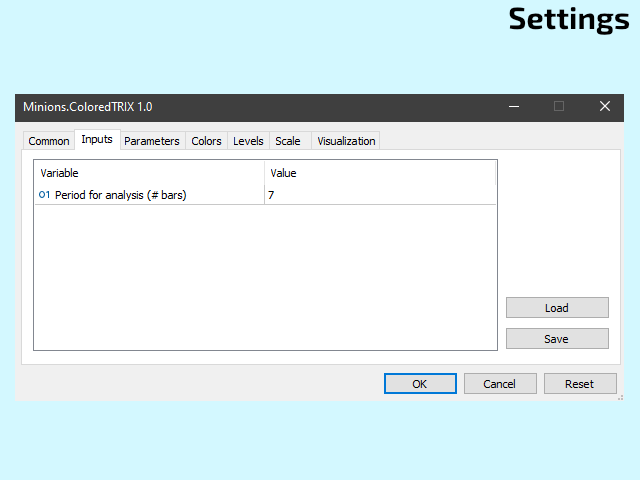

PARAMETERS

  • Period of Analysis.


As always, if you like this indicator, all I am asking is a little Review (not a Comment, but a REVIEW!)...   

This will mean A LOT to me... And this way I can continue to give away Cool Stuff for Free...

With No Strings Attached!  Ever!


Live Long and Prosper!

;)


Comentários 2
soeuseidoni10
74
soeuseidoni10 2024.04.26 10:56 
 

muito bom, poderia ter duas linhas horizontais indicando sobre compra e sobre venda e setas de entrada e saída da operação.

Dzimabie Rockson Junior
141
Dzimabie Rockson Junior 2024.01.31 15:01 
 

Good indicator. An alert will make it great

Produtos recomendados
Divergentes
Dion Lima Dasilva
Descrição Este Expert Advisor (EA) implementa uma estratégia baseada na divergência de preços entre o mini dólar (WDO$N) e o dólar cheio (DOL$N). Ele monitora, segundos antes da abertura do mercado ou ao longo do dia (conforme o modo escolhido), possíveis discrepâncias entre esses dois ativos e efetua ordens no mini dólar, apostando na convergência futura. Principais Recursos Divergência Mínima Configurável: A estratégia utiliza um parâmetro de divergência mínima de 10 pontos, ajustável de acor
FREE
ZigZag SMC MT5
Kallebe Lins De Oliveira Santos
O Indicador ZigZag SMC/SMT para MT5 é a ferramenta ideal para traders que desejam identificar com precisão topos e fundos baseados nos conceitos avançados de Smart Money Concepts (SMC) e Smart Money Trap (SMT) . Principais Benefícios: Identificação automática de topos e fundos estratégicos. Baseado em conceitos utilizados por traders institucionais . Ideal para análise de liquidez, estrutura de mercado e manipulação . Simples de usar: basta adicionar ao gráfico e acompanhar os ponto
FREE
Multiple Timeframe MACD indicator. This indicator was built for making multiple timeframe analysis possible in MT5 using MACD Indicator. MACD Indicator traditionally shows two lines and one histogram. MACD Line(Yellow) is calculated by subtracting 12period EMA(fast) from 26period EMA (slow). Signal Line(Blue) is created by a 9period EMA from MACD Line. Histogram is just the difference between MACD and Signal lines. Histogram is colored based on the difference between its value and the previous h
Marca Dagua
Erison Francisco De Sales
3 (1)
Adiciona marca d'água com nome do ativo em negociação. Pode ser ajustado definindo tamanho da fonte e coloração do texto. Testado com vários ativos do mercado B3 e Forex  Adione ao gráfico e configure de acordo com a necessidade. Caso tenha problemas sinta-se a-vontade para nos avisar e providenciaremos a correção logo que possível. ______________________________
FREE
Moving Ratio
Ricardo Rodrigues Lucca
"Moving Ratio Candle" serve para verificar o quão distante uma vela de um ponto de pressão teórico. Além disso, temos dois limitadores o primeiro pela média e o segundo pela mediana. O desenho do indicador é em formato de barra e a linha que cruza cortando a barra da esquerda para direita é a partir do calculo do fechamento para ambos os lados. O resto segue um calculo mais padrão. O mesmo poderia ser feito como linha, mas eu quero saber o comportamento desse indicador em relação a vela de preço
FREE
FiveStarFX Gold Reversal Edge Professional automated trading solution designed for structured execution and controlled risk management in the Gold market. Built for traders who value discipline, precision, and consistency. Key Features Fully automated trading One trade at a time (controlled exposure) Fixed Stop Loss and Take Profit Smart Break-Even protection Profit lock with buffer Step-based trailing management Spread protection system Works on any broker Trade Management The E
FREE
Trend Everest
Eduardo Da Costa Custodio Santos
O indicador  Trend Everest MT5 é um indicador seguidor de tendência que auxilia na tomada de decisão. Ele tem como base o cálculo de ATR que auxiliar e a média hull. Uma questão fundamental é que o indicado Trend Everest para MT5 não repinta, dessa forma você pode fazer seu backtest com maior confiança. Quando estiver Verde Tendência de Alta Quando estiver Vermelho tendência de baixa. Não que o Mercado é fractal, então quanto maior o tempo gráfico maior seu gral de assertividade.
Maximize your trading performance with Dd-uP , a revolutionary indicator based on an Exponential Moving Average (EMA) smoothing. This indicator is represented by a distinct yellow line on your charts, making it easy to identify market trends and providing precise and reliable trading signals. Key Features: Advanced EMA Smoothing : Track market trends with an EMA smoothing that reacts quickly to price changes, offering precise and real-time analysis. Buy and Sell Signals : Receive clear signals w
FREE
XCalper HiLo Activator
Aecio de Feo Flora Neto
HiLo Activator v1.02 by xCalper The HiLo Activator is similar to moving average of previous highs and lows. It is a trend-following indicator used to display market’s direction of movement. The indicator is responsible for entry signals and also helps determine stop-loss levels. The HiLo Activator was first introduced by Robert Krausz in the Feb. 1998 issue of Stocks & Commodities Magazine.
Moving Average 4TimeFrames
Ronnie Ferreira Silva
3.67 (3)
Moving Average 4 TimeFrames Exiba 4 médias móveis de 4 timeframes diferentes no mesmo gráfico. Para não poluir o gráfico, o indicador vai plotar a média completa somente no tempo gráfico corrente de uma das 4 médias cadastradas, para os outros tempos gráficos de médias cadastradas o indicador exibe apenas uma parte da média para que você saiba onde ela está naquele tempo gráfico. Exemplo: Exiba no gráfico de 5 minutos onde está passando a média móvel aritimética de 200 períodos  dos 5 minuto
FREE
WaveTrend Arrow LIGHT is a clean and lightweight WaveTrend-based arrow indicator for MetaTrader 5. This free version focuses purely on visual buy & sell arrows , generated from WaveTrend WT1 and WT2 crossings, without alerts or notifications. It is designed for traders who prefer a simple, non-repainting arrow indicator and for developers who want a stable signal source for EA integration . Features: Buy & Sell arrows based on WaveTrend crossing Non-repainting signals (closed bar option) Clean a
FREE
Price Momentum
Flavio Javier Jarabeck
4.92 (12)
Value Chart indicator presents the Price evolution in a new form. This indicator, Price Momentum , was developed taking all the calculations presented in the book " Dynamic Trading Indicators " by Mark W. Helweg and David Stendahl (2002). The technique involves de-trended Prices from a user-defined Period of analysis and the addition of a Volatility index correction. The result is an Oscillator with 3 zones: Fair Price Value, Overbought/Oversold and Extremely Overbought/Oversold zones. Adding th
FREE
Intraday Momentum Index IMI
Danilo Hudson Couto Monteiro
Indicador IMI (Intraday Momentum Index) Descrição O Indicador IMI (Intraday Momentum Index) é uma poderosa ferramenta de análise técnica desenvolvida para identificar a força do momentum e potenciais reversões no mercado. Este indicador quantifica a relação entre ganhos e perdas durante um período específico, ajudando traders a avaliar a dinâmica atual do mercado. Características Oscila entre 0 e 100, facilitando a interpretação das condições de mercado Identifica com precisão áreas de sobrecomp
FREE
TendencyLine
Samuel De Souza Ferreira
Indicador TendencyLine - Análise de Tendência de Mercado (Um indicador exclusivo da PPF - Past Project Future) Descrição Geral O TendencyLine é um indicador técnico desenvolvido pela PPF - Past Project Future para ajudar os traders a identificar a tendência predominante do mercado. Ele sobrepõe uma linha de tendência baseada em um tipo de média móvel escolhida pelo usuário sobre o gráfico de preços e exibe um histograma colorido que sinaliza a direção da tendência. Principais Característic
FREE
Topos e Fundos Historicos
Valter Cezar Costa
4.5 (8)
YOUTUBE:   https://www.youtube.com/watch?v=XX9MWWuPPpw INDICADOR DE TOPOS E FUNDOS HISTORICOS   O Indicador de topos e fundos históricos é baseado no gráfico mensal onde os tubarões se esconde então desenvolvido para facilitar a identificações dessas regiões. Os recursos disponíveis são os alertas de Gatilhos de entrada   e como notificações que são enviadas ao celular.     PARAMETROS 1-) Topos   e Fundos: Você pode mudar a cor das linha e o período em anos e o intervalo de filtro entre o topo
FREE
Paula Bollinger Bands Strategy
Francisco Gomes Da Silva
3.67 (3)
Setup da Paula A estrategia da Paula foi criada por Joe Ross e muito difundida aqui no Brasil por Rodrigo Cohen Indicador Para você não precisar ficar procurando onde seriam as entradas dela no grafico eu criei esse indicador que mostra com uma seta onde seriam as entradas da Paula. A entrada da Paula A entrada é configurada quando o preço de um candle fecha fora e no candle seguinte fecha dentro, então deve operar na abertura do proximo candle. Comente Me deixe saber se esse indicador que fiz s
FREE
High Low Open Close
Alexandre Borela
4.98 (43)
Se você gosta deste projeto, deixe uma revisão de 5 estrelas. Este indicador desenha os preços abertos, altos, baixos e finais para o especificado período e pode ser ajustado para um fuso horário específico. Estes são níveis importantes olhados por muitos institucional e profissional comerciantes e pode ser útil para você saber os lugares onde eles podem ser mais activa. Os períodos disponíveis são: Dia anterior. Semana anterior. Mês anterior. Quarto anterior. Ano anterior. Ou: Dia atual. Seman
FREE
Технический индикатор Universal Oscillator является комбинацией торговых сигналов самых популярных и широко используемых осцилляторов. Индикатор представлен гистограммами, а также линиями fast и slow MA, что позволяет расширить список получаемых торговых рекомендаций и работать как по тренду, так и в боковом движении рынка. Таким образом, гистограммы позволяют определить момент пробоя ценовых значений и движение в новой фазе рынка, а линии указывают на зоны перекупленности и перепроданности.  Ос
Histograma de Rendimento L&S Caicai Aviso Importante: Este indicador é uma ferramenta integrante do robô automatizado EA Caicai Long and Short Pair Trading . Este indicador exibe visualmente o desvio percentual (Yield %) do spread atual de um par em relação à sua própria média histórica. É excelente para visualizar rapidamente o potencial financeiro bruto de uma distorção. Principais Funcionalidades: Visualização em Percentual: Entenda facilmente o tamanho da distorção em termos percentuais. Múl
FREE
Closing Price Reversal
Flavio Javier Jarabeck
5 (11)
Closing Price Reversal is a very well known and traded candlestick pattern. This little indicator paints with specific (user-selected) colors the Closing Price Reveral Up and Down patterns, as well as the Inside Bars (as a bonus). Higher timeframes are more effective  as with all other candlesticks patterns. Do NOT trade solely on this indicator. Search the web for "Closing Price Reversal" to learn about the several approaches that can be used with this pattern. One of them is combining short/me
FREE
Um novo tipo de indicador. Projetado especificamente para identificação de tendências. Uma ótima ferramenta para os investidores investirem no momento certo e adequado para um comércio decente. Você pode apresentá-lo aos seus potenciais clientes e clientes para sua satisfação. Uma ferramenta muito útil e moderna. Fácil de ler, compreender e amigável. Por esta ferramenta, você pode identificar facilmente os pontos potenciais para entrar na negociação e os pontos de baixo potencial para sair. Boa
Simple Candle Countdown
Emanuel Cavalcante Amorim Filho
Simple candle countdown - never again miss how much time is left to open a new bar! This indicator doesn't plot any line on the chart - it uses only objects and calculates the time left to open a new bar. You can set custom colors for the panel background and border and for the text color. Simple as that, the indicator is ready to use. If you find any bugs, feel free to contact me. 
FREE
MACD ADVANCED - BRIEF DESCRIPTION INTRODUCTION MACD Advanced is an enhanced version of the traditional MACD indicator featuring an intelligent 4-color system that helps traders easily identify market trends and momentum. KEY FEATURES 1. Smart 4-Color System Bright Green (Lime) - Strong Bullish: MACD > 0 and MACD > Signal Light Green (DarkSeaGreen) - Weak Bullish: MACD > 0 but MACD < Signal ️ Bright Red (Red) - Strong Bearish: MACD < 0 and MACD < Signal Orange Red (OrangeRed)
FREE
Friend of the trend : Seu Rastreador de Tendências Domine o mercado com o Friend of the trend , o indicador que simplifica a análise de tendências e te ajuda a identificar os melhores momentos para comprar, vender ou esperar. Com um design intuitivo e visualmente impactante, o Trend Analisa os movimentos de preço e entregar sinais através de um histograma colorido: Barras Verdes : Sinalizam uma tendência de alta, indicando oportunidades de compra. Barras Vermelhas : Alertam para uma tendência de
FREE
This creative simple indicator will provide a precise framework for market sentiment within technical analysis of different timeframes. For instance, for traders like me that uses   "Mark Fisher"   strategy regularly, this is a perfect indicator for having an insight to markets from short term to long term point of view, using Break points of candles' lows and highs and perfect to combine with   "Price Action" . For more options and modifications you can also edit the low timeframe candles withi
FREE
Simple Strategy Indicator The Simple Strategy indicator is a reliable tool for identifying trend direction, leveraging three popular technical indicators: MACD, RSI, and Stochastic. It provides clear trading signals for quick market analysis. Trend Detection Logic Buy signal: MACD above signal line, RSI > 50, Stochastic > 50 Sell signal: MACD below signal line, RSI < 50, Stochastic < 50 Advantages Suitable for various assets: forex, stocks, cryptocurrencies, indices Optimal on daily (D1) timefr
FREE
Probability Advanced Indicator
Dioney De Jesus Batista Alves
. O ProbabilityAdvancedIndicator é uma ferramenta sofisticada para análise de probabilidade de tendência, desenvolvida para operações de scalping e day trade. Ele combina múltiplos indicadores técnicos e análise multi-timeframe para gerar sinais visuais claros de probabilidade de compra/venda. O ProbabilityAdvancedIndicator é uma ferramenta completa para traders que buscam: Tomada de decisão baseada em probabilidade Análise técnica consolidada Flexibilidade para diferentes estilos de operação I
VFI Quantum
Nikita Berdnikov
5 (1)
Introducing VFI (Volume Flow Indicator) – a trading indicator that analyzes the relationship between volume and price movement to identify key trading opportunities. The indicator displays the strength and direction of volume flow, providing clear signals about potential entry and exit points. Signals are formed based on zero line crossovers, crossovers between the VFI line and its exponential moving average (EMA), and when the indicator exits overbought and oversold zones. Attention! This stra
FREE
ShabaSawa
Kobamelo Mashaba
A estratégia de trading Shabsawa foi projetada para identificar reversões de preço nos índices Crash 500 e Boom 500 , utilizando o timeframe M5 . A abordagem começa pela identificação de uma tendência existente, depois aguarda-se que o mercado desacelere e entre em uma fase de consolidação. Um rompimento dessa consolidação confirma uma possível mudança de direção, após o qual a operação é realizada em um pullback para obter um melhor ponto de entrada e reduzir o risco. A estratégia é simples de
Os compradores deste produto também adquirem
SuperScalp Pro
Van Minh Nguyen
5 (10)
SuperScalp Pro – Sistema avançado de indicador de scalping com múltiplos filtros SuperScalp Pro é um sistema avançado de indicador de scalping que combina o clássico Supertrend com múltiplos filtros inteligentes de confirmação. O indicador opera de forma eficiente em todos os timeframes de M1 a H4 e é especialmente adequado para XAUUSD, BTCUSD e principais pares Forex. Pode ser usado como sistema independente ou integrado de forma flexível a estratégias de trading existentes. O indicador integra
Se você comprar este indicador, receberá meu Gerenciador de Operações Profissional + EA  GRATUITAMENTE. Primeiramente, vale ressaltar que este Sistema de Trading é um Indicador Não Repintado, Não Redesenho e Não Atrasado, o que o torna ideal tanto para o trading manual quanto para o automatizado. Curso online, manual e download de predefinições. O "Sistema de Trading Inteligente MT5" é uma solução completa de trading projetada para traders novos e experientes. Ele combina mais de 10 indicadores
Entry In The Zone and SMC Multi Timeframe is a real-time market analysis tool developed based on Smart Money Concepts (SMC). It is designed to analyze market structure, price direction, reversal points, and key zones across multiple timeframes in a systematic way. The system displays Points of Interest (POI) and real-time No Repaint signals, with instant alerts when price reaches key zones or when signals occur within those zones. It functions as both an Indicator and a Signal System (2-in-1), c
Divergence Bomber
Ihor Otkydach
4.89 (83)
Cada comprador deste indicador recebe adicionalmente, e de forma gratuita: A ferramenta exclusiva "Bomber Utility", que acompanha automaticamente cada operação, define os níveis de Stop Loss e Take Profit e fecha operações de acordo com as regras da estratégia; Arquivos de configuração (set files) para ajustar o indicador em diferentes ativos; Set files para configurar o Bomber Utility nos modos: "Risco Mínimo", "Risco Balanceado" e "Estratégia de Espera"; Um vídeo tutorial passo a passo que aju
FX Trend MT5 NG
Daniel Stein
5 (4)
FX Trend NG: A Nova Geração de Inteligência de Tendência Multi-Mercado Visão Geral FX Trend NG é uma ferramenta profissional de análise de tendências e monitoramento de mercado em múltiplos períodos de tempo. Permite compreender a estrutura completa do mercado em segundos. Em vez de alternar entre vários gráficos, você visualiza instantaneamente quais ativos estão em tendência, onde o momentum está enfraquecendo e onde existe alinhamento forte entre diferentes timeframes. Oferta de Lançamento
ARICoins
Temirlan Kdyrkhan
ARICoin is a powerful trading companion designed to generate high-probability entry signals with dynamic TP/SL/DP levels based on volatility. Built-in performance tracking shows win/loss stats, PP1/PP2 hits, and success rates all updated live. Key Features: Buy/Sell signals with adaptive volatility bands Real-time TP/SL/DP levels based on ATR Built-in MA Filter with optional ATR/StdDev volatility Performance stats panel (Success, Profit/Loss, PP1/PP2) Alerts via popup, sound, push, or email Cust
Grabber System MT5
Ihor Otkydach
4.82 (22)
Apresento a você um excelente indicador técnico: Grabber, que funciona como uma estratégia de trading “tudo incluído”, pronta para usar. Em um único código estão integradas ferramentas poderosas de análise técnica de mercado, sinais de entrada (setas), funções de alertas e notificações push. Cada comprador deste indicador também recebe gratuitamente: Utilitário Grabber: ferramenta para gerenciamento automático de ordens abertas Vídeo tutorial passo a passo: como instalar, configurar e operar com
Trend Screener Pro MT5
STE S.S.COMPANY
4.84 (101)
Desbloqueie o poder da negociação de tendências com o indicador Trend Screener: sua solução definitiva de negociação de tendências, alimentada por lógica difusa e sistema de múltiplas moedas! Eleve sua negociação de tendências com o Trend Screener, o revolucionário indicador de tendências alimentado por lógica difusa. É um poderoso indicador de acompanhamento de tendências que combina mais de 13 ferramentas e recursos premium e 3 estratégias de negociação, tornando-o uma escolha versátil para to
Gold Entry Sniper
Tahir Mehmood
5 (5)
Gold Entry Sniper – Painel ATR Multi-Tempo Profissional para Scalping e Swing Trading em Ouro Gold Entry Sniper é um indicador avançado para MetaTrader 5 projetado para fornecer sinais de compra/venda precisos para XAUUSD e outros ativos, com base na lógica de Trailing Stop ATR e análise multi-tempo . Ideal tanto para scalpers quanto para swing traders. Principais Recursos e Vantagens Análise Multi-Tempo – Veja a tendência de M1, M5 e M15 em um único painel. Trailing Stop Baseado em ATR – Níveis
Power Candles MT5
Daniel Stein
5 (6)
Power Candles – Sinais de entrada baseados em força para qualquer mercado Power Candles leva a análise de força comprovada da Stein Investments diretamente para o seu gráfico de preços. Em vez de reagir apenas ao preço, cada candle é colorido com base na força real do mercado, permitindo identificar instantaneamente a construção de momentum, aceleração de força e transições limpas de tendência. Uma única lógica para todos os mercados Power Candles funciona automaticamente em todos os símbolos de
AriX
Temirlan Kdyrkhan
1 (4)
AriX Indicator for MT5 A powerful trend-following and signal-evaluation tool AriX is a custom MT5 indicator that combines Moving Averages and ATR-based risk/reward logic to generate clear buy/sell signals. It visualizes dynamic SL/TP levels, evaluates past trade outcomes, and displays win/loss statistics in a clean on-chart panel. Key features include: Buy/Sell signals based on MA crossovers ATR-based SL/TP1/TP2/TP3 levels with visual lines and labels Signal outcome tracking with real-time stat
Quantum TrendPulse
Bogdan Ion Puscasu
5 (22)
Apresentando   Quantum TrendPulse   , a ferramenta de negociação definitiva que combina o poder do   SuperTrend   ,   RSI   e   Stochastic   em um indicador abrangente para maximizar seu potencial de negociação. Projetado para traders que buscam precisão e eficiência, este indicador ajuda você a identificar tendências de mercado, mudanças de momentum e pontos de entrada e saída ideais com confiança. Principais características: Integração SuperTrend:   siga facilmente a tendência predominante do
Atomic Analyst MT5
Issam Kassas
4.03 (30)
Primeiramente, vale ressaltar que este Indicador de Negociação não repinta, não redesenha e não apresenta atrasos, tornando-o ideal tanto para negociação manual quanto automatizada. Manual do utilizador: configurações, entradas e estratégia. O Analista Atômico é um Indicador de Ação de Preço PA que utiliza a força e o momentum do preço para encontrar uma vantagem melhor no mercado. Equipado com filtros avançados que ajudam a remover ruídos e sinais falsos, e aumentam o potencial de negociação.
Game Changer es un indicador de tendencia revolucionario, diseñado para usarse en cualquier instrumento financiero y transformar su MetaTrader en un potente analizador de tendencias. Funciona en cualquier marco temporal y facilita la identificación de tendencias, señala posibles reversiones, actúa como mecanismo de trailing stop y proporciona alertas en tiempo real para una respuesta rápida del mercado. Tanto si es un profesional experimentado como si es un principiante que busca una ventaja com
Apresentando       Quantum Breakout PRO   , o inovador Indicador MQL5 que está transformando a maneira como você negocia Breakout Zones! Desenvolvido por uma equipe de traders experientes com experiência comercial de mais de 13 anos,       Quantum Breakout PRO       foi projetado para impulsionar sua jornada comercial a novos patamares com sua estratégia de zona de fuga inovadora e dinâmica. O Quantum Breakout Indicator lhe dará setas de sinal em zonas de breakout com 5 zonas-alvo de lucro e su
Smart Stop Indicator – Precisão inteligente de stop-loss diretamente no seu gráfico Visão geral O Smart Stop Indicator é a solução ideal para traders que desejam definir seu stop-loss de forma clara e metódica, sem adivinhações ou decisões baseadas apenas na intuição. A ferramenta combina lógica clássica de price action (topos mais altos, fundos mais baixos) com um sistema moderno de detecção de rompimentos para identificar onde realmente deve estar o próximo nível lógico de stop. Seja em tend
RFI levels PRO MT5
Roman Podpora
3.67 (3)
O indicador mostra com precisão os pontos de reversão e as zonas de retorno de preço onde o   Principais players . Você identifica onde novas tendências estão se formando e toma decisões com máxima precisão, mantendo o controle sobre cada negociação. VERSION MT4     -    Revela seu potencial máximo quando combinado com o indicador   TREND LINES PRO. O que o indicador mostra: Estruturas de reversão e níveis de reversão com ativação no início de uma nova tendência. Exibição dos níveis de   TAKE P
Order Block Pro (MQL5) – Versão 1.0 Autor: KOUAME N'DA LEMISSA Plataforma: MetaTrader 5 Descrição: Order Block Pro é um indicador avançado projetado para detectar automaticamente Blocos de Ordem de alta e baixa no seu gráfico. Ao analisar velas de consolidação seguidas de velas de impulso fortes, o indicador identifica áreas-chave onde o preço provavelmente se acelerará. Ideal para traders que desejam: Identificar pontos de entrada e saída precisos. Detectar zonas dinâmicas de suporte e resistê
LINHAS DE TENDÊNCIA PRO   -   Ajuda a entender onde o mercado está realmente mudando de direção. O indicador mostra inversões de tendência reais e pontos onde os principais participantes retornam ao mercado. Você vê     Linhas BOS   Análise de tendências e níveis-chave em prazos maiores — sem configurações complexas ou ruídos desnecessários. Os sinais não são repintados e permanecem no gráfico após o fechamento da barra. VERSÃO MT4   -   Revela seu potencial máximo quando combinado com o   indic
Este é um indicador para MT5 que fornece sinais precisos para entrar em uma negociação sem redesenhar. Ele pode ser aplicado a qualquer ativo financeiro: forex, criptomoedas, metais, ações, índices. Ele fornecerá estimativas bastante precisas e informará quando é melhor abrir e fechar um negócio. Assista o vídeo (6:22) com um exemplo de processamento de apenas um sinal que compensou o indicador! A maioria dos traders melhora seus resultados de negociação durante a primeira semana de negociação c
ARIPoint
Temirlan Kdyrkhan
ARIPoint is a powerful trading companion designed to generate high-probability entry signals with dynamic TP/SL/DP levels based on volatility. Built-in performance tracking shows win/loss stats, PP1/PP2 hits, and success rates all updated live. Key Features: Buy/Sell signals with adaptive volatility bands Real-time TP/SL/DP levels based on ATR Built-in MA Filter with optional ATR/StdDev volatility Performance stats panel (Success, Profit/Loss, PP1/PP2) Alerts via popup, sound, push, or email Cu
FX Power MT5 NG
Daniel Stein
5 (31)
FX Power: Analise a Força das Moedas para Decisões de Negociação Mais Inteligentes Visão Geral FX Power é a sua ferramenta essencial para compreender a força real das principais moedas e do ouro em quaisquer condições de mercado. Identificando moedas fortes para comprar e fracas para vender, FX Power simplifica as decisões de negociação e revela oportunidades de alta probabilidade. Quer você prefira seguir tendências ou antecipar reversões usando valores extremos de Delta, esta ferramenta adap
Market Flow Pro
Gabriele Sabatino
4 (1)
Market Flow Pro Market Flow Pro is an intelligent trading advisor for the MetaTrader 5 platform, designed for automatic trading on financial markets using algorithmic analysis and strict risk management. -Key features: - Fully automatic trading 24/5 - Adaptive trend and momentum entry algorithm -  Built-in risk management - Flexible lot settings (fixed/auto-calculation) - Support for major currency pairs and indices - Optimised for operation on various timeframes  How it works Market
Easy SMC Trading
Israr Hussain Shah
4 (1)
Análise de Tendência Estrutural com Auto RR e Scanner de BOS Versão: 1.0 Visão Geral A Análise de Tendência Estrutural com Auto RR é um sistema de negociação abrangente, concebido para traders que dependem da Ação do Preço e da Estrutura de Mercado. Combina um filtro de tendência suavizado com a deteção de Pontos de Oscilação e sinais de Ruptura de Estrutura (BOS) para gerar configurações de negociação de alta probabilidade. O principal diferencial desta ferramenta é a sua Gestão de Risco Aut
Azimuth Pro
Ottaviano De Cicco
5 (4)
PROMOÇÃO DE LANÇAMENTO O preço do Azimuth Pro está inicialmente definido em 299$ para os primeiros 100compradores. O preço final será de 499$ . A DIFERENÇA ENTRE ENTRADAS RETAIL E INSTITUCIONAIS NÃO É O INDICADOR — É A LOCALIZAÇÃO. A maioria dos traders entra em níveis de preço arbitrários, perseguindo momentum ou reagindo a sinais atrasados. As instituições esperam o preço atingir níveis estruturados onde oferta e demanda realmente mudam. Azimuth Pro mapeia esses níveis automaticamente: VWA
Stratos Pali mt5
Michela Russo
4.5 (8)
Stratos Pali Indicator is a revolutionary tool designed to enhance your trading strategy by accurately identifying market trends. This sophisticated indicator uses a unique algorithm to generate a complete histogram, which records when the trend is Long or Short. When a trend reversal occurs, an arrow appears, indicating the new direction of the trend. Important Information Revealed Leave a review and contact me via mql5 message to receive My Top 5 set files for Stratos Pali at no cost ! Down
FX Dynamic MT5
Daniel Stein
5 (5)
FX Dynamic: Acompanhe a Volatilidade e as Tendências com Análise ATR Personalizável Visão Geral FX Dynamic é uma ferramenta poderosa que utiliza cálculos de Average True Range (ATR) para fornecer aos traders insights incomparáveis sobre a volatilidade diária e intradiária. Ao configurar limites de volatilidade claros —por exemplo, 80%, 100% e 130%—, você pode identificar rapidamente oportunidades de lucro ou receber alertas quando o mercado ultrapassar faixas normais. FX Dynamic se adapta ao f
Market Structure Order Block Dashboard MT5 é um indicador para MT5 focado em estrutura de mercado e conceitos ICT / Smart Money: HH/HL/LH/LL , BOS , ChoCH , além de Order Blocks , Fair Value Gaps (FVG) , liquidez (EQH/EQL, sweeps), sessões / Kill Zones e um Volume Profile integrado, com um dashboard compacto de confluência. Importante: é uma ferramenta de análise . Não executa operações (não é um EA). Bônus para compradores Após a compra, você pode receber 2 indicadores bônus (à sua escolha) da
Trend Forecaster
Alexey Minkov
5 (7)
The Trend Forecaster indicator utilizes a unique proprietary algorithm to determine entry points for a breakout trading strategy. The indicator identifies price clusters, analyzes price movement near levels, and provides a signal when the price breaks through a level. The Trend Forecaster indicator is suitable for all financial assets, including currencies (Forex), metals, stocks, indices, and cryptocurrencies. You can also adjust the indicator to work on any time frames, although it is recommen
FX Levels MT5
Daniel Stein
5 (13)
FX Levels: Suporte e Resistência com Precisão Excepcional para Todos os Mercados Visão Geral Rápida Procurando um meio confiável de identificar níveis de suporte e resistência em qualquer mercado—incluindo pares de moedas, índices, ações ou commodities? FX Levels combina o método “Lighthouse” tradicional com uma abordagem dinâmica de vanguarda, fornecendo uma precisão quase universal. Baseado em nossa experiência real com corretores e em atualizações automáticas diárias mais as de tempo real,
Mais do autor
Mini POC
Flavio Javier Jarabeck
4.96 (28)
For those who struggle with overbloated Volume Profile/Market Profile indicators, here is a solution that contains only the Point of Control (POC) information. Super-fast and reliable, the Mini POC indicator presents this vital information visually within your chart. Totally customizable in splittable timeframes, type of Volume, calculation method, and how many days back you need. SETTINGS Timeframe to split the POCs within the day. Volume type to use: Ticks or Real Volume. Calculation method .
FREE
Auto Support and Resistances
Flavio Javier Jarabeck
4.57 (70)
Are you tired of drawing Support & Resistance levels for your Quotes? Are you learning how to spot Support & Resistances? No matter what is your case, Auto Support & Resistances will draw those levels for you! AND, it can draw them from other timeframes, right into you current chart, no matter what timeframe you are using... You can also Agglutinate regions/zones that are too much closer to each other and turning them into one single Support & Resistance Level. All configurable. SETTINGS Timefr
FREE
Inside Bar Radar
Flavio Javier Jarabeck
4.67 (6)
The Inside Bar pattern is a very well known candlestick formation used widely by traders all over the world and in any marketplace. This approach is very simple and adds a little confirmation candle, so it adds a third past candlestick to the count to confirm the direction of the move (upward or downward). Obviously, there is no power on this candlestick formation if the trader has no context on what it is happening on the market he/she is operating, so this is not magic, this "radar" is only a
FREE
Closing Price Reversal
Flavio Javier Jarabeck
5 (11)
Closing Price Reversal is a very well known and traded candlestick pattern. This little indicator paints with specific (user-selected) colors the Closing Price Reveral Up and Down patterns, as well as the Inside Bars (as a bonus). Higher timeframes are more effective  as with all other candlesticks patterns. Do NOT trade solely on this indicator. Search the web for "Closing Price Reversal" to learn about the several approaches that can be used with this pattern. One of them is combining short/me
FREE
Economic Markers
Flavio Javier Jarabeck
4.79 (14)
Easily get all relevant economic events of the current day right into your chart, as markers. Filter what kind of markers do you want: by country (selected individually) and by Importance (High relevance, Medium, Low or any combination of these). Configure the visual cues to your liking. If there is more than one event set to the very same time, their Names will be stacked and you will see the messages merged with the plus (+) sign on the marker. Obviously that long or too much events on the sam
FREE
Tabajara V5
Flavio Javier Jarabeck
4.83 (36)
Metatrader 5 version of the famous Andre Machado's Tabajara indicator. If you don't know Andre Machado's Technical Analysis work you don't need this indicator... For those who need it and for those several friend traders who asked this porting from other platforms, here it is... FEATURES 8-period Moving Average 20-period Moving Average 50-period Moving Average 200-period Moving Average Colored candles according to the inflexion of the 20-period MA SETTINGS You can change the Period of all MA's
FREE
Aggression Volume
Flavio Javier Jarabeck
4.29 (17)
O Indicador de Volume de Agressão é o tipo de indicador que raramente é encontrado na comunidade MQL5 porque não é baseado nos dados de Volume padrão fornecidos pela plataforma Metatrader 5. Ele requer a análise de todos os Ticks de tráfego solicitados na plataforma... Dito isso, o indicador de Volume de Agressão solicita todos os Dados de Tick do seu Broker e os processa para construir uma versão muito especial de um Indicador de Volume, onde as agressões de Compradores e Vendedores são plotada
FREE
Symbol Watermark
Flavio Javier Jarabeck
4.57 (14)
Another request from my brotherhood was putting the name of the Symbol being seen - a little bigger - on the Chart, just to get sure that they are seeing the correct one... Mistakes pay a high price on the market... It is a very effective, and almost resource-null-consuming indicator that displays the current Symbol Name and Timeframe in almost any position of your Chart, with any color, and any Font Size... And also you can change the divisor character that is presented between the Symbol Name
FREE
Weis Waves
Flavio Javier Jarabeck
2.83 (18)
The original author is David Weis, an expert in the Wyckoff Method. The Weis Wave is a modern adaptation of the 1930's Wyckoff Method, another expert in Tape Reading techniques and Chart Analysis. Weis Waves takes market volume and stacks it into waves according to price conditions giving the trader valuable insights about the market conditions. If you want to learn more about this subject you can find tons of videos in YouTube. Just look for "The Wickoff Method", "Weis Wave" and "Volume Spread
FREE
Big Player Candles
Flavio Javier Jarabeck
4.91 (23)
If you heard about The Wyckoff Method, Volume Spread Analysis, etc... You are probably searching for the candlestick indicator that shows you the Volume spread all over the current bar, signaling every types of market status... You can control the several Market Levels with custom colors... It is up to you to decide how to use it. Our job is provide you with the indicator... If you like this indicator, all I am asking is a little Review (not a Comment, but a REVIEW! )...    This will mean A LO
FREE
MIDAS Super VWAP
Flavio Javier Jarabeck
4.27 (11)
Imagine VWAP, MVWAP and MIDAS in one place... Well, you found it! Now you can track the movement of Big Players in various ways, as they in general pursue the benchmarks related to this measuring, gauging if they had good execution or poor execution on their orders. Traders and analysts use the VWAP to eliminate the noise that occurs throughout the day, so they can measure what prices buyers and sellers are really trading. VWAP gives traders insight into how a stock trades for that day and deter
FREE
VWAP and MVWAP
Flavio Javier Jarabeck
3.88 (8)
Volume Weighted Average Price (VWAP) is a trading benchmark commonly used by Big Players that gives the average price a Symbol has traded throughout the day. It is based on both Volume and price. Additionally we put in this indicator the MVWAP (Moving Volume Weighted Average Price). For those who do not know the usage and the importance od this indicator I recommend a great article about this subject at Investopedia ( https://www.investopedia.com/articles/trading/11/trading-with-vwap-mvwap.asp )
FREE
Force Numbers
Flavio Javier Jarabeck
5 (1)
Several assets in several markets have the behavior of using specific numbers as Force Numbers, where support, resistance and price thrust is created. Let this indicator draw those levels of support and resistance for you. You can also stack it to show different level of Prices! This technique is being used by Tape Readers and Order Flow traders all over the world for a long time. Give it a try. Challenge yourself to study new ways of Price Action! SETTINGS What Price reference to use in the c
FREE
Stackable VWAP
Flavio Javier Jarabeck
3.5 (4)
Volume Weighted Average Price (VWAP) is a trading benchmark commonly used by Big Players that gives the average price a Symbol has traded throughout the day. It is based on both Volume and price. Additionally we put in this indicator the MVWAP (Moving Volume Weighted Average Price). For those who do not know the usage and the importance od this indicator I recommend a great article about this subject at Investopedia ( https://www.investopedia.com/articles/trading/11/trading-with-vwap-mvwap.asp
FREE
Server Clock
Flavio Javier Jarabeck
5 (5)
Many friends asked me for a simple, non-obtrusive, resource-friendly clock to track the time during their trades. It seems pretty obvious, but it is a must-have for those trading the market manually, waiting for the Market News, or just to visually know what time it is... Trading is an absorbing endeavor! So, here it is... Totally configurable, including Font Type, Font Size and Chart Location: Upper Left/Center/Right OR Lower Left/Center/Right, with a little twist of adjusting the Offset, just
FREE
Waves Sizer
Flavio Javier Jarabeck
3.86 (7)
Wyckoff fans, enjoy! Ideally to be used with the Weis Waves indicator, but it can be easily used alone, the Waves Sizer puts the range (in resulting Price movement) done by the Price on its market swings. You can control how accurate or loose will be the swings. This tool is very helpful for visually know how much the Price has traveled in your Timeframe. This way you can confront this level of effort with the resulting Volume, etc... Weis Waves indicator: https://www.mql5.com/en/market/produc
FREE
Market Momentum
Flavio Javier Jarabeck
4.43 (7)
O indicador de Momento do Mercado é baseado no Oscilador de Zona de Volume (VZO), apresentado por Waleed Aly Khalil na edição de 2009 do jornal da Federação Internacional de Analistas Técnicos , e apresenta uma nova visão desses valiosos dados de mercado que muitas vezes são mal compreendidos e negligenciados: o VOLUME. Com essa nova abordagem de "ver" os dados de Volume, os traders podem inferir de maneira mais adequada o comportamento do mercado e aumentar suas chances em uma negociação bem-su
FREE
Flux Diffuser
Flavio Javier Jarabeck
4.33 (6)
Based on Brazilian trader André Moraes' Difusor de Fluxo theory, the indicator is a more reliable version of the original MACD. It is a great confirmation indicator for Swing Trading and also can be used as a Day Trading tool. If you are not familiar with the concept or André's trading strategies, I strongly recommend his excelent book named "Se Afastando da Manada" in which he explains in detail how this indicator is used. Even if you don't know the Portuguese language it is not difficult to un
FREE
Price Momentum
Flavio Javier Jarabeck
4.92 (12)
Value Chart indicator presents the Price evolution in a new form. This indicator, Price Momentum , was developed taking all the calculations presented in the book " Dynamic Trading Indicators " by Mark W. Helweg and David Stendahl (2002). The technique involves de-trended Prices from a user-defined Period of analysis and the addition of a Volatility index correction. The result is an Oscillator with 3 zones: Fair Price Value, Overbought/Oversold and Extremely Overbought/Oversold zones. Adding th
FREE
Money Flow Index EA Friendly
Flavio Javier Jarabeck
3.67 (3)
O indicador tradicional Money Flow Index, desta vez, compatível com EAs . Existem 3 buffers expostos que podem ser usados por EAs para analisar automaticamente as condições de sobrecompra e sobrevenda da cotação. Basta usar a função tradicional iCustom() para obter esses sinais. Este cálculo do Money Flow Index é baseado no indicador MFI tradicional da Metaquote. CONFIGURAÇÕES Período do MFI Tipo de volume para analisar (Volume Real ou Ticks) Início da região de sobrecompra Início da região de
FREE
Price Trail Chart
Flavio Javier Jarabeck
5 (2)
For those who hate candlesticks in lower timeframes (M1 through M15) we "invented" a clean new way to follow Price movement and displacement (volatility) called Price Trail Chart . The big "secret" is to get rid of those annoying candle wicks and draw the whole complete candle without them, this way we get a cleaner chart and a new view of the Price Path. No Open or Close markings, just LOW's and HIGH's, full body candle. Additionaly we inserted a Volume monitor from our Best Downloaded indicato
FREE
ATR Monitor
Flavio Javier Jarabeck
4.8 (5)
O ATR é uma medida de volatilidade introduzida pelo famoso autor J. Welles Wilder Jr. em seu livro "New Concepts in Technical Trading Systems". Em geral, os traders estão acostumados a ver o ATR na forma de um indicador em uma sub-janela do gráfico. O que estou apresentando aqui é uma versão simplificada do ATR - apenas contendo o número atual do ATR - muito útil para monitorar apenas o momento atual do mercado. Se você quiser monitorar vários tempos gráficos dentro do gráfico corrente, bast
FREE
Mini Chart Indicators
Flavio Javier Jarabeck
The Metatrader 5 has a hidden jewel called Chart Object, mostly unknown to the common users and hidden in a sub-menu within the platform. Called Mini Chart, this object is a miniature instance of a big/normal chart that could be added/attached to any normal chart, this way the Mini Chart will be bound to the main Chart in a very minimalist way saving a precious amount of real state on your screen. If you don't know the Mini Chart, give it a try - see the video and screenshots below. This is a gr
ATR Monitor EA Friendly
Flavio Javier Jarabeck
ATR Monitor ATR is a measure of volatility introduced by market technician J. Welles Wilder Jr. in his book, "New Concepts in Technical Trading Systems". In general, traders are accustomed to seeing the ATR in the form of a sub-window indicator. What I am presenting here is a simplified version of ATR - just the current ATR number - very useful for monitoring just the very moment of the current chart. And, by default, this indicator will not show up on screen, you can just use the buffers thems
FREE
Time Spaced Moving Averages
Flavio Javier Jarabeck
5 (3)
The concept is simple: Plotting Price behavior within several periods of time. Some Symbols behave very well during the trading day - with this I mean Intraday trading - and this behavior ends up plotting effectively well with the proposed Exponential Moving Averages in this indicator... Obviously that this behavior could not be seen in all Symbols, but you can give it a try... Just drop this indicator in a chart and you will see for yourself... This indicator is intended for "Feeling the Trend"
FREE
Arrows Cleaner
Flavio Javier Jarabeck
5 (4)
For those who use the Trading Arrows on the chart for later study, but use the Triple Screen approach and got all those arrows everywhere on all additional charts, here it is: Arrows Cleaner! Just drop it on the chart and leave it there. When needed, just with 1-click you get rid of all those annoying arrows... SETTINGS You can position the little Button on any corner of the chart. Additionally you can displace it with the Offset settings. You can enlarge or shrink its size, as well as the text
FREE
Candle Zones
Flavio Javier Jarabeck
You probably heard about Candlesticks behaviors, which in most of the times could denote and trace Volume behaviors even if you are not watching Volume itself... Well, this indicator will do this. Naked traders love to rely solely on candlesticks patterns and with Candle Zones you can trap special patterns and DRAW THEM on your chart. As simple as that. There are several filters you can tweak in order to achieve the analysis you want. Just give it a try. After several months of testing, we think
FREE
Candlestick Pattern Teller
Flavio Javier Jarabeck
5 (1)
Minions Labs' Candlestick Pattern Teller It shows on your chart the names of the famous Candlesticks Patterns formations as soon as they are created and confirmed. No repainting. That way beginners and also professional traders who have difficulties in visually identifying candlestick patterns will have their analysis in a much easier format. Did you know that in general there are 3 types of individuals: Visual, Auditory, and Kinesthetic? Don't be ashamed if you cannot easily recognize Candlesti
Economic Markers PRO
Flavio Javier Jarabeck
4 (1)
Easily get all relevant economic events of the current day right into your chart, as markers. Filter what kind of markers do you want: by country (selected individually) and by Importance (High relevance, Medium, Low or any combination of these). Configure the visual cues to your liking. Additionaly you have the ability to add up to 5 personal markers of your own agenda. With Alerts and/or with blackout periods, if you are using it within an Expert Advisor! All in one Economic Calendar indicator
Market Momentum PRO
Flavio Javier Jarabeck
The Market Momentum indicator is based on the Volume Zone Oscillator (VZO), presented by Waleed Aly Khalil in the 2009 edition of the International Federation of Technical Analysts journal, and presents a fresh view of this market valuable data that is oftenly misunderstood and neglected: VOLUME. With this new approach of "seeing" Volume data, traders can infer more properly market behavior and increase their odds in a winning trade. "The VZO is a leading volume oscillator; its basic usefulness
Filtro:
soeuseidoni10
74
soeuseidoni10 2024.04.26 10:56 
 

muito bom, poderia ter duas linhas horizontais indicando sobre compra e sobre venda e setas de entrada e saída da operação.

Flavio Javier Jarabeck
351404
Resposta do desenvolvedor Flavio Javier Jarabeck 2024.04.26 16:07
Olá... se você observar a escala Y, ele não é um "Bounded Indicator"... ele apenas orbita o eixo Zero (0)... ;)
Dzimabie Rockson Junior
141
Dzimabie Rockson Junior 2024.01.31 15:01 
 

Good indicator. An alert will make it great

Responder ao comentário