SwingCross
- Indicadores
- Versão: 1.0
- Ativações: 5

Short description (one line)
ZigZag-style swing indicator that plots swing highs/lows, leg midpoints, range labels and dynamic Small/Medium/Large target levels with a latched target-chaser line.
Full description
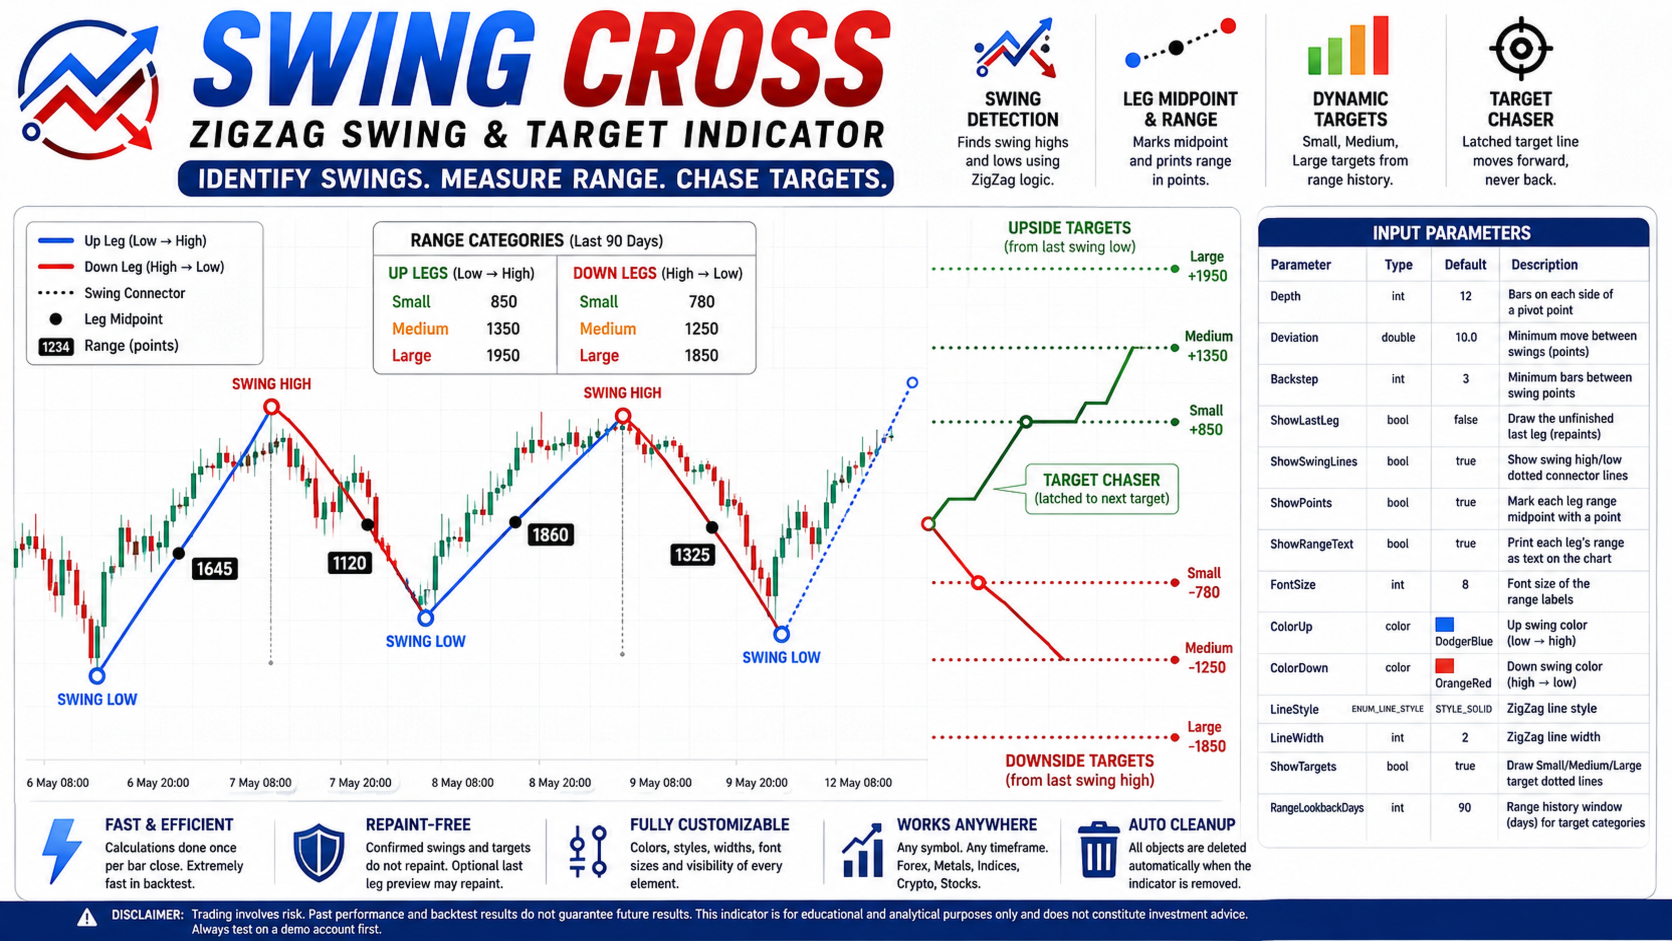
Swing Cross is a highly customizable ZigZag-style indicator that identifies swing highs and lows, draws the connecting legs, and automatically builds dynamic target levels from your symbol's recent leg-range history.
How it works
Detects local swing highs/lows using the classic ZigZag parameters — Depth, Deviation and Backstep.
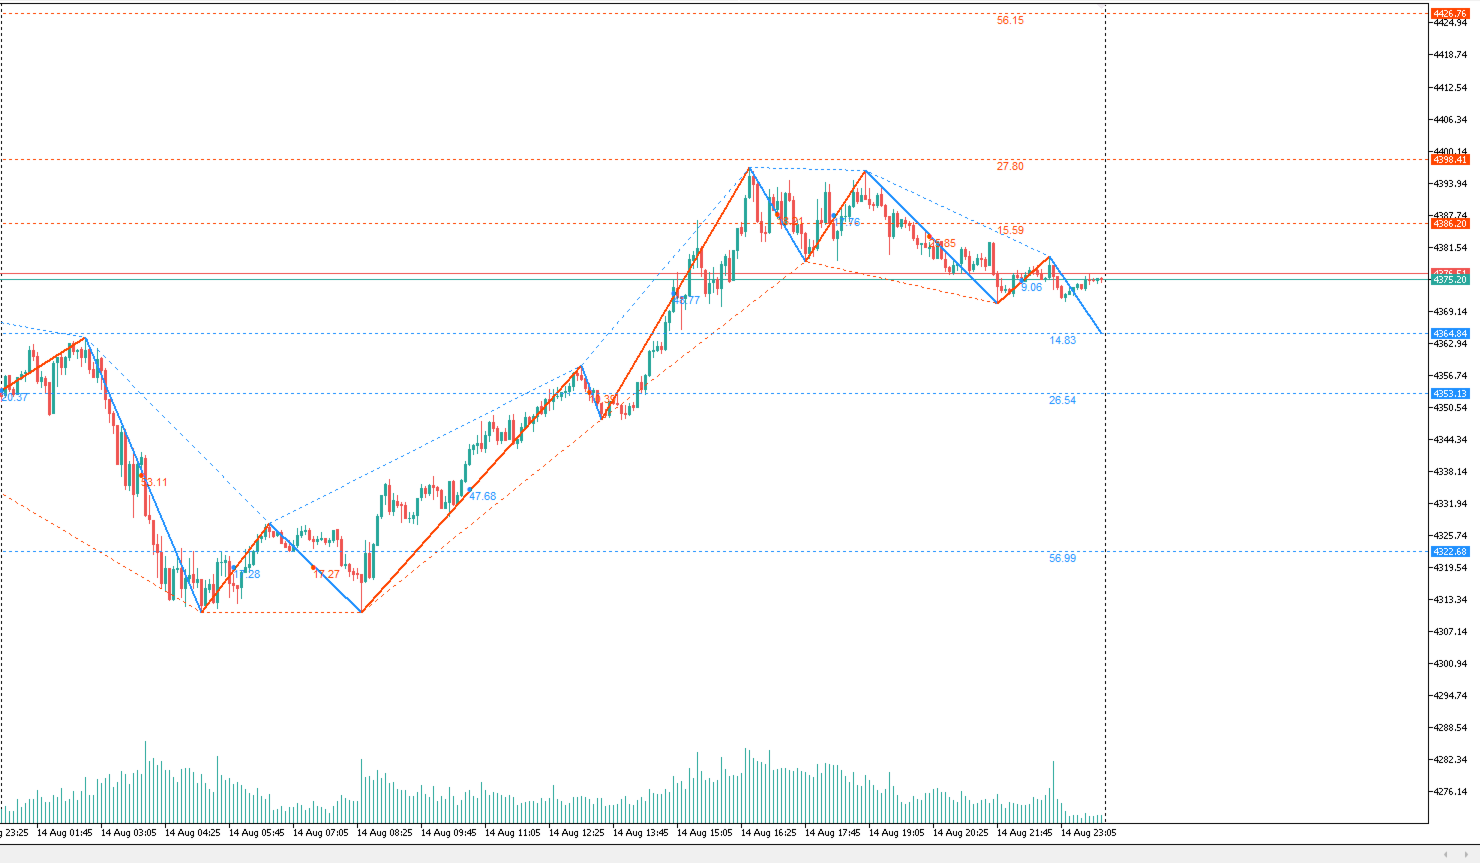
Connects every swing high to the next swing low and every swing low to the next swing high with solid colored lines (blue = up leg, red = down leg).
Marks the midpoint of each leg with a dot and prints the leg's range in points as a text label directly on the chart.
Classifies the observed leg ranges into three categories — Small, Medium and Large — computed separately for up legs and down legs over a configurable lookback window.
Draws 3 dotted target levels above the last confirmed low (upside targets) and 3 dotted levels below the last confirmed high (downside targets), using the average range of each category.
Draws a solid target-chaser line from the anchor point to the current target. When price crosses a target, the chaser latches to the next one and never steps back — no flickering while price oscillates.
Features
Fully configurable colors, line style, line width and label font size.
Every visual element can be toggled independently: zigzag legs, swing connector lines, midpoint points, range text and target lines.
Repaint-free confirmed history; optional "last leg" preview that follows the current price in real time.
Incremental calculation — swing points are re-evaluated only on bar close, so heavy work happens once per bar instead of once per tick, making it extremely fast in the Strategy Tester.
Works on any symbol and any timeframe.
All chart objects (labels, lines) are automatically cleaned up when the indicator is removed.
Input parameters
Parameter Type Default Description
Depth int 12 Bars on each side of a pivot point
Deviation double 10.0 Minimum move between swings (points)
Backstep int 3 Minimum bars between swing points
ShowLastLeg bool false Draw the unfinished last leg (repaints)
ShowSwingLines bool true Show swing high/low dotted connector lines
ShowPoints bool true Mark each leg range midpoint with a point
ShowRangeText bool true Print each leg's range as text on the chart
FontSize int 8 Font size of the range labels
ColorUp color DodgerBlue Up swing color (low → high)
ColorDown color OrangeRed Down swing color (high → low)
LineStyle ENUM_LINE_STYLE STYLE_SOLID ZigZag line style
LineWidth int 2 ZigZag line width
ShowTargets bool true Draw Small/Medium/Large target dotted lines
RangeLookbackDays int 90 Range history window (days) for target categories