Wave Vision 5
- Indicadores
- Versão: 1.1
- Atualizado: 14 outubro 2021

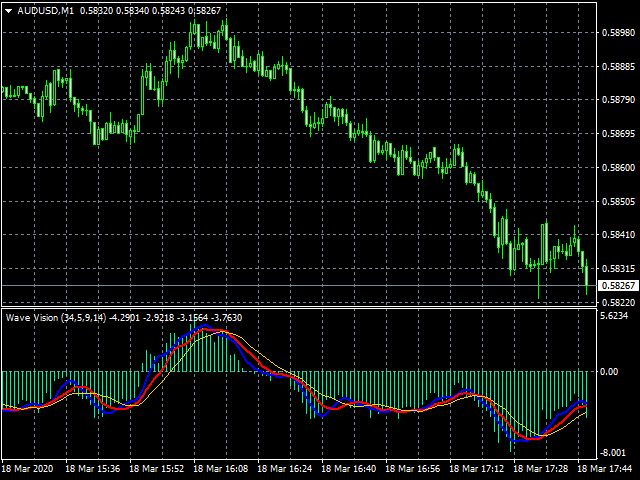
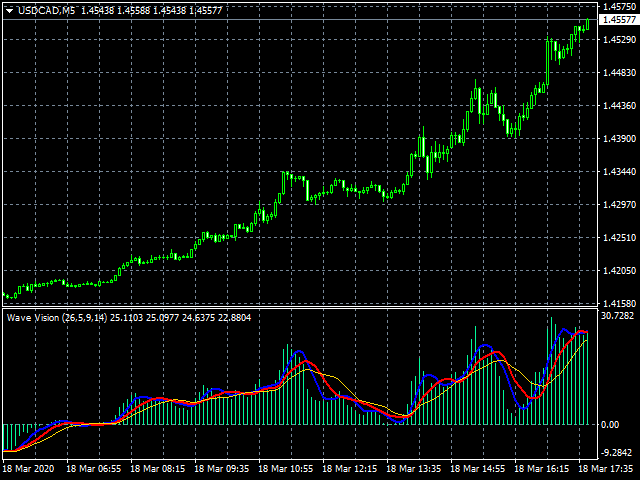
The technical indicator Wave Vision measures the relative strength of the trend movements of the price from its average values over a certain time period. The histogram shows price movement strenght relative to the zero level line. Histogram values close to zero indicate the equality of forces between buyers and sellers. Above the zero level line - bullish trend (positive values of the bar chart). Below the zero level line - bearish trend (negative values of the bar chart).
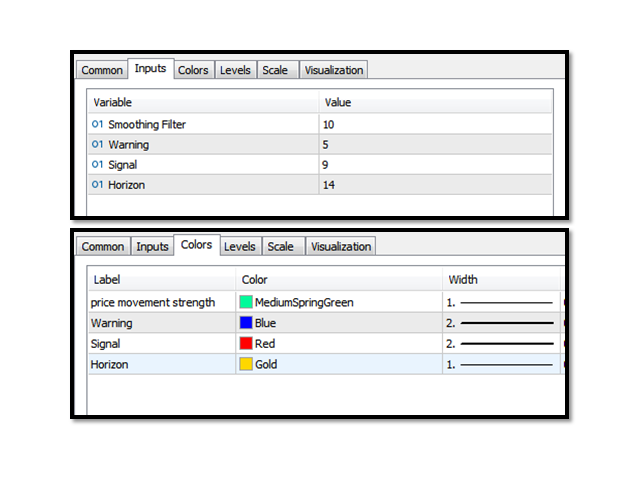
Settings:
Smoothing Filter (default) = 10.
Warning (blue line) = 5.
Signal (red line) = 9.
Horizon (gold line) = 14.
Actions of the trader depend on the values of the histogram and signal lines and their location on the indicator chart relative to each other, as well as relative to the zero level line. The most commonly used indicator signals are intersections, histogram transition from the zone of negative values to the zone of positive values and vice versa, discrepancies in the indicator and price, as well as overbought / oversold conditions.
https://www.mql5.com/en/users/meijin/seller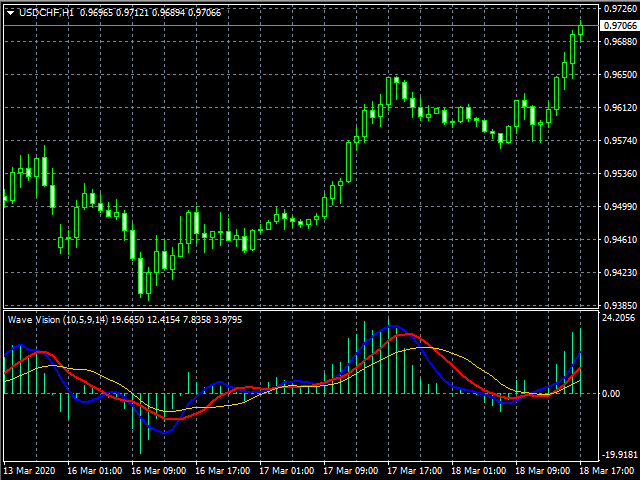

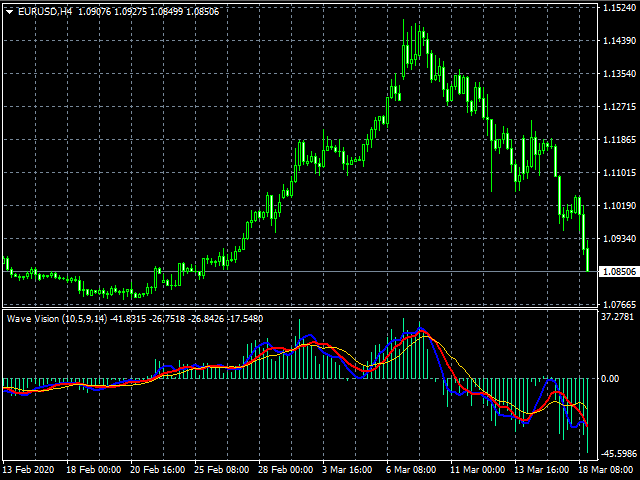
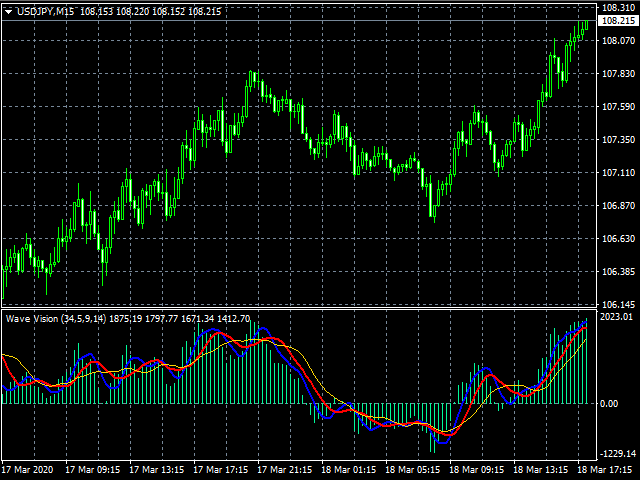

Very helpful indicator, to work in different timeframes