Cunning crocodile

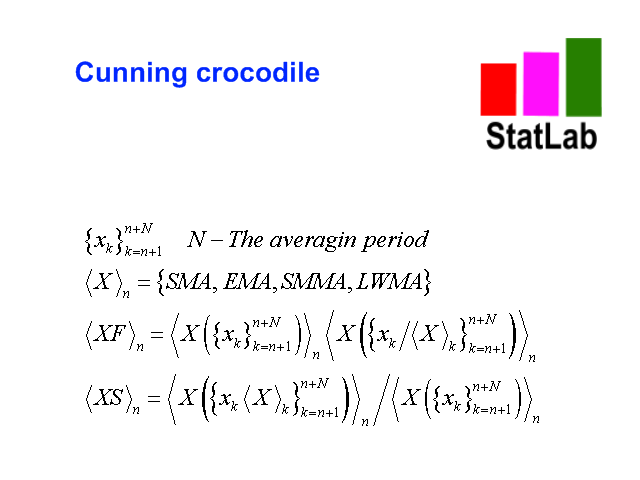
A estrutura do indicador.

             O indicador de Cunning  crocodile (crocodilo manhoso) consiste em três médias móveis (aplicado ao preço Median price  = (high + low)/2):  1) o MA (SMA , EMA, SMMA,  LWMA)  usual ou o <X> processo X médio e suas duas generalizações 2) <XF> = <X / <X >> * <X> e 3) <XS> = <X * <X >> / <X> tomando o mesmo período médio. Todas as três curvas se cruzam em pontos únicos, o que (tal cruzamento em que o crocodilo astuto, ao contrário do habitual, "nunca morde a língua") indica uma mudança na tendência do movimento dos preços. As fórmulas para estas médias generalizadas, uma das quais <XF> é mais rápida, e a outra <XS> mais lenta que a MA usual, são apresentadas na última captura de tela.


Usando o indicador «Cunning  crocodile» e suas vantagens.

              A negociação no indicador «Cunning  crocodile»  é realizada de maneira semelhante à negociação com um jacaré normal, com apenas as seguintes vantagens. Primeiro, a média pelo algoritmo <XF> tem um atraso menor que o SMMA rápido usado no Alligator clássico. Em segundo lugar, uma pequena inclinação de um <XS> lento também é mais rápida do que uma queda na inclinação de um SMMA lento de um Alligator normal. Portanto, “Cunning  crocodile” indica mais rapidamente uma transição para as condições de mercado planas ou de tendência do que o jacaré clássico.


            O indicador tem todos os tipos de alertas.   


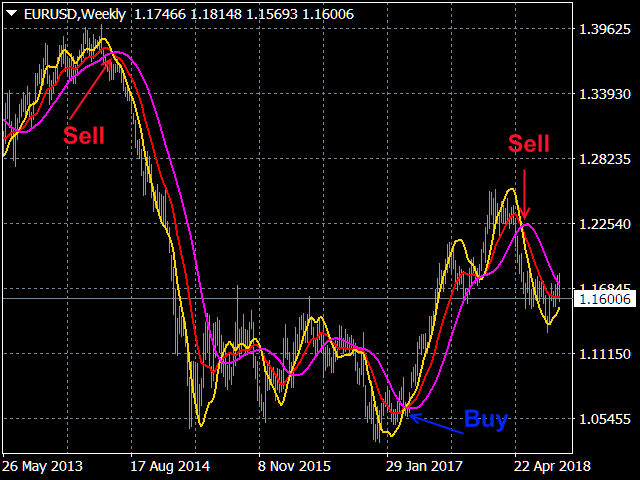
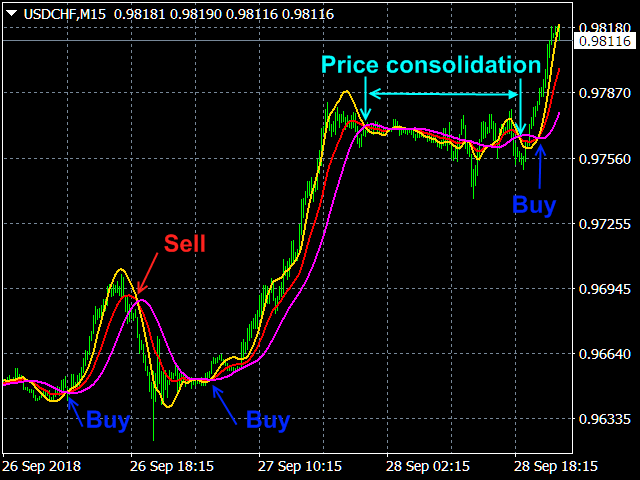
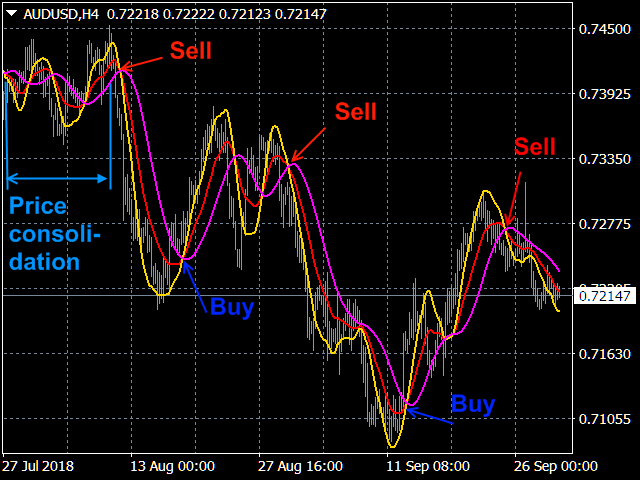
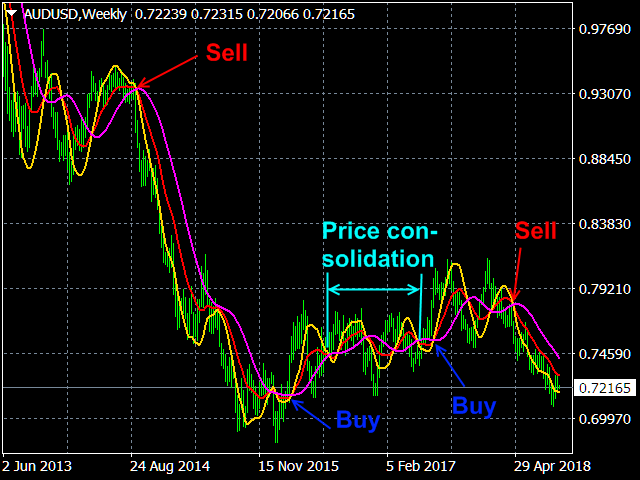
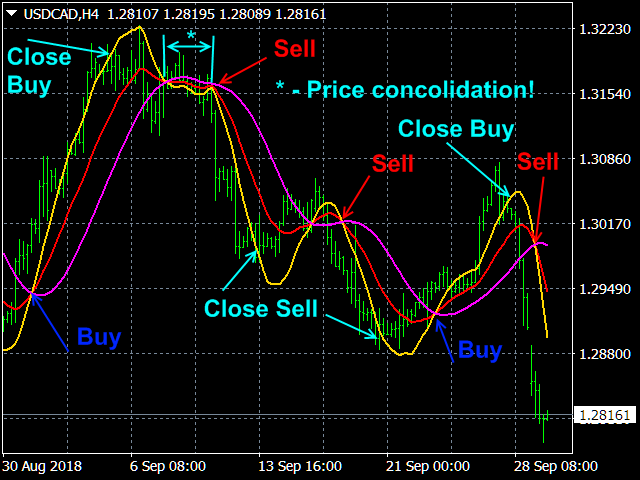
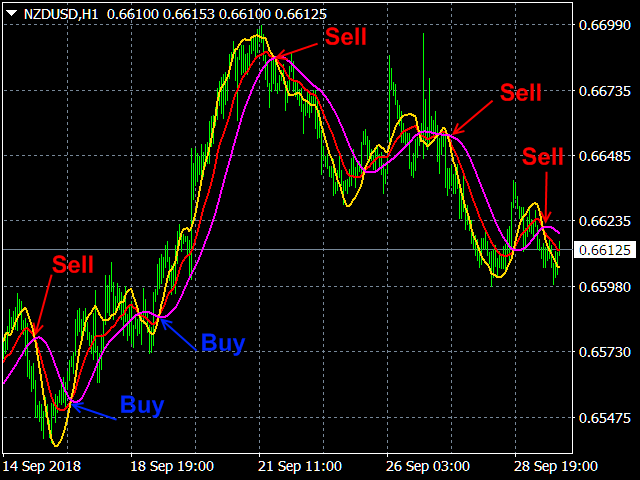
 Negociação com o indicador «Cunning  crocodile».

              Se, depois de alcançar um único ponto de intersecção de todas as três curvas, a boca do crocodilo se abrir e a média lenta <XS> tiver uma inclinação significativa, então há uma tendência. Ao mesmo tempo, uma posição em Buy (Sell)  é aberta quando o preço é maior (menor) que a média rápida <XF> e fecha quando é menor (maior) <XF> (isto é, na boca do Cunning  crocodile).

              Se a média lenta <XS> é quase horizontal e com isso (o que ocupa uma parte significativa da história) todas as três linhas se cruzam repetidamente (3-6 vezes) em pontos únicos, então há uma consolidação de preços. Ao mesmo tempo, a duração da tendência subsequente é geralmente proporcional à duração da área de consolidação anterior, na qual o mercado gasta a maior parte do tempo (70% -80%), o que fornece informações adicionais para avaliar o estado do mercado, ou seja, permite que você julgue se a tendência começa a retroceder ou se a tendência termina. Uma estimativa aproximada é de que, se a tendência já durou 25% a 40% do tempo de sua consolidação anterior, então, provavelmente, haverá um fim para a tendência; Se a tendência durou menos de 20% do tempo da consolidação anterior, é possível uma reversão de curto prazo.


Configurações de indicador

  • Price type  - Tipo de preço. Significados: Close price, Open price, High price, Low price, Median price  ((high + low)/2 – por padrão),  Typical price ((high + low + close)/3),    Weighted  price  ((high + low + 2*close)/4). 
  • The averaging method  Método de média. Significados: SMA (por padrão), EMA, SMMA,  LWMA.  
  • The averaging period -  Período médio. Significados:  inteiro,  5  por padrão.
  • The Signal method -  Tipo de alerta de sinal de negociação. Significados:  No, Send alert, Print (in expert), Comment (in chart), Sound + Print, Sound + Comment, Sound, Push + Comment, Push,  Mail + Comment, Mail.


Produtos recomendados
Coloured Bollinger Bands The Coloured Bollinger Bands indicator is an enhanced version of the standard Bollinger Bands, offering customizable features to suit your trading needs. It uses the classic Simple Moving Average (SMA) as the middle band, and allows you to easily change the appearance of the bands, including the option to select colors and line types, ensuring better visual clarity and adaptability on your charts
FREE
Idioteca FTU O indicador é para a plataforma MT4, pode ser usado sozinho, mas é melhor combinado com outros indicadores ou estratégias Combina vários indicadores como macd, adx para desenhar uma seta para sugestão de entrada ou mudança de tendência Assista a um breve vídeo de introdução no youtube: https://youtu.be/lCRJ3mFNyOQ Recursos do indicador: Setas de venda e compra Alerta visual e sonoro Continuação da tendência/sinal inicial de mudança de tendência Novas características: Limite à quant
FREE
GTAS STrend
Riviera Systems
4.5 (2)
GTAS S-Trend is a momentum indicator that helps to determine trends using combination of MACD, RSI and moving averages. This indicator was created by Bernard Prats Desclaux, proprietary trader and ex-hedge fund manager, founder of E-Winvest. Description The indicator oscillates between -65 and +65 with a neutral zone between -25 and +25 around a 0 equilibrium line. S-Trend between -25 and +25 indicates congestion zones with a bullish bias between 0 and +25, and a bearish bias between 0 and -25.
FREE
The indicator simplifies the decision-making process by recognizing the reversals using the built-in algorithm, and then confirms the signals at the support / resistance levels. In this way, the indicator tracks the market trend with unsurpassed reliability, ignoring the sharp fluctuations in the market and the noise around the average price. The indicator can be used for both small periods and long-term trading. The indicator is not redrawn and not late. 94% of deals are profitable. Take profit
The BB Arrows MTF indicator is based on the Bollinger Bands indicator. Represents input signals in the form of arrows. All signals are generated on the current bar. In 2 modes, Signals are not redrawn (Exception of very sharp jumps)! All signals in MTF mode correspond to signals of the period specified in MTF. It is maximally simplified to use both for trading with only one indicator and for using the indicator as part of your trading systems. A feature of the indicator is that the indicator ti
FREE
Email Drawdown Alert
Roman Starostin
5 (12)
Free informative Indicator-helper. It'll be usefull for traders who trade many symbols or using grid systems (Averaging or Martingale). Indicator counts drawdown as percent and currency separate. It has a number of settings: Count deposite drawdown according equity value and send e-mail or notifications to user if DD more than set; Sending e-mail when max open orders reached; Shows price and remaining pips amount before MarginCall on current chart and Account generally; Display summary trade lot
FREE
Indicator for binary options arrow is easy to use and does not require configuration works on all currency pairs, cryptocurrencies buy signal blue up arrow sell signal red down arrow tips do not trade during news and 15-30 minutes before their release, as the market is too volatile and there is a lot of noise it is worth entering trades one or two candles from the current period (recommended for 1 candle) timeframe up to m 15 recommended money management fixed lot or fixed percentage of the depo
Market Structure Zig Zag
Lesedi Oliver Seilane
4.66 (29)
Free Market structure zig zag to assist in price action trading the screenshots describe how to use and how to spot patterns new version comes with alerts, email alert and  push notification alert can be used on all pairs  can be used on all timeframes  you can add additional confirmation indicators the indicator shows you your higher high and low highs as well as your lower lows and lower highs  the indication makes price action analysis easier to spot.
FREE
Bollinger Bands Max Free
John Louis Fernando Diamante
4.67 (3)
A BB indicator with MA options You're no longer limited to the built in default of using BB off a SMA method, now you can choose from SMA-EMA-SMMA-LWMA. You now also have up to 3 standard deviation levels, with price labels. Options: - MTF - moving average type SMA-EMA-SMMA-LWMA -  3 adjustable deviation levels - separate coloring to lines and texts Troubleshooting: - If there are any issues or suggestions for the indicator, please comment and let me know. The feedback will be noted and consid
FREE
Baseado em ondas indicadoras MACD com parâmetros padrão Aplica os níveis de Fibonacci às duas últimas ondas MACD, positivas e negativas, respectivamente, se no momento em que o indicador MACD fica sem onda negativa - a cor é verde, se no momento em que o indicador MACD fica sem onda positiva - a cor é vermelha. O critério de terminação Wave é dois ticks com um sinal MACD diferente. Aplica linhas de tendência nas últimas quatro ondas MACD. Funciona bem com o especialista  Figures MACD   htt
VR Cub
Vladimir Pastushak
VR Cub é um indicador para obter pontos de entrada de alta qualidade. O indicador foi desenvolvido para facilitar cálculos matemáticos e simplificar a busca por pontos de entrada em uma posição. A estratégia de negociação para a qual o indicador foi escrito tem provado a sua eficácia há muitos anos. A simplicidade da estratégia de negociação é a sua grande vantagem, o que permite que até mesmo os comerciantes novatos negociem com sucesso com ela. VR Cub calcula os pontos de abertura de posição e
Smoothed Heiken Ashi with AC/AO Zones – Professional Trading Clarity Transform your Heiken Ashi analysis with intelligent smoothing that eliminates noise while preserving actionable signals. What Makes This Different? This isn't just another Heiken Ashi indicator. We've engineered a sophisticated smoothing engine that works with the Accelerator (AC) and Awesome Oscillator (AO) zone logic to give you cleaner entries and exits without sacrificing responsiveness. Four Smoothing Methods at Your Comm
Absolute Bands
Aleksey Ivanov
4.67 (3)
Principles of construction of the indicator.               The Absolute Bands (AB) indicator is reminiscent of the Bollinger Bands indicator with its appearance and functions, but only more effective for trading due to the significantly smaller number of false signals issued to them. This effectiveness of the Absolute Bands indicator is due to its robust nature.               In the Bollinger Bands indicator, on both sides of the moving average - Ma, there are lines spaced from Ma by the standa
FREE
Индикатор DivergenceMRDM  ситуацию, когда направление движения цены и технических индикаторов не совпадает. Что можно воспринимать как точки для входа в рынок, точки потенциального разворота рынка. Чаще всего проявляется сигнал при достижении индикатором зоны перекупленности или перепроданности. Один из четырех индикаторов: MACD , RSI , ADX , Momentum . Готовая торговая система. Индикатор не перерисовывается и не запаздывает 95% сделок прибыльные. Работает на всех валютных парах и на всех таймфр
Auto Optimized Bollinger Bands – Ferramenta adaptativa de volatilidade para mercados reais O Auto Optimized Bollinger Bands é um indicador avançado para MT4 que aprimora as bandas de Bollinger clássicas, selecionando automaticamente os melhores valores de período e desvio com base em simulações históricas de negociações. Em vez de depender de configurações fixas, o indicador realiza uma otimização em tempo real com base no comportamento real do mercado, permitindo que as bandas se ajustem dinami
Rainbow MT4
Jamal El Alama
Rainbow MT4 is a technical indicator based on Moving average with period 34 and very easy to use. When price crosses above MA and MA changes color to green, it’s a signal to buy. When price crosses below MA and MA changes color to red, it’s a signal to sell. The Expert advisor ( Rainbow EA MT4) based on Rainbow MT4 indicator, as you can see in the short video below is now available here .
FREE
Noize Absorption Index MT4
Ekaterina Saltykova
5 (1)
Noize Absorption Index - is the manual trading system that measures the difference of pressure between bears forces and bulls forces. Green line - is a noize free index that showing curent situation. Zero value of index shows totally choppy/flat market.Values above zero level shows how powerfull bullish wave is and values below zero measures bearish forces.Up arrow appears on bearish market when it's ready to reverse, dn arrow appears on weak bullish market, as a result of reverse expectation. S
Diamond Trend
Segundo Calvo Munoz
Indicator which identifies Trend and also buy/sell opportunities. Use for entries aligned to the Trend.  Although Diamond Trend is very accurate identifying entry points, it is always recommended to use a support indicator in order to reconfirm the operation. Remind to look for those Assets and Timeframes which best fit to your trader behavior/need... Valid for Scalping and Long Term operations. Please, set up a Bars Chart to be able to visualize the indicator properly...  ...And remind to give
The indicator displays the data of the Stochastic oscillator from a higher timeframe on the chart. The main and signal lines are displayed in a separate window. The stepped response is not smoothed. The indicator is useful for practicing "manual" forex trading strategies, which use the data from several screens with different timeframes of a single symbol. The indicator uses the settings that are identical to the standard ones, and a drop-down list for selecting the timeframe. Indicator Paramet
Forex Gump
Andrey Kozak
2.4 (5)
Forex Gump is a fully finished semi-automatic trading system. In the form of arrows, signals are displayed on the screen for opening and closing deals. All you need is to follow the instructions of the indicator. When the indicator shows a blue arrow, you need to open a buy order. When the indicator shows a red arrow, you need to open a sell order. Close orders when the indicator draws a yellow cross. In order to get the most effective result, we recommend using the timeframes H1, H4, D1. There
The Crossing
Anton Iudakov
5 (2)
+ 2 bonus strategies! Alerts! I recommend watching my advisor -   Night Zen EA The indicator combines the most popular moving average strategies: Simple moving average crossover. Moving average crossover relative to the position of the slower moving average. 2 bonus strategies : The crossing of the fast moving average with the calculation of the opening prices of the slow moving average with the calculation of the closing prices taking into account the slower moving average. (The settings for th
FREE
Forex 3d
Andrey Kozak
Forex 3D is a ready trading system for scalping on any currency pair. Recommended timeframe M5. The average number of transactions that we can open every day is from 5 to 15. This trading system is suitable for trading on all currency pairs, including gold and silver. Forex 3D is a very simple trading system suitable for forex beginners. It does not require additional market analysis using other trading instruments. We can focus exclusively on the technical analysis of this indicator and open o
Delta Fusion Pro
Francesco Secchi
5 (2)
Delta Fusion Pro – Análise Avançada de Order Flow para Trading Intradiário Delta Fusion Pro é um indicador profissional para MetaTrader 4 que revela o fluxo de ordens agressivas, mostrando a intensidade e a direção da pressão institucional em tempo real. Diferente dos indicadores volumétricos tradicionais, ele analisa a delta entre volumes Ask e Bid para antecipar reversões, confirmar tendências e identificar zonas de interesse profissional. Características Principais Sistema Inteligente de Au
Smart FVG Indicator MT4 – Detecção Avançada de Fair Value Gap para MetaTrader 4 O Smart FVG Indicator para MetaTrader 4 oferece detecção, monitorização e alertas profissionais de Fair Value Gap (FVG) diretamente nos seus gráficos. Ele combina filtragem baseada em ATR com lógica sensível à estrutura para remover ruído, adaptar‑se à liquidez e manter apenas os desequilíbrios mais relevantes para decisões precisas. Principais vantagens Deteção precisa de FVG: identifica ineficiências reais de pre
FREE
O indicador SMC Venom Model BPR é uma ferramenta profissional para os traders que trabalham com o conceito Smart Money (SMC). Identifica automaticamente dois padrões principais no gráfico de preços: FVG   (Fair Value Gap) é uma combinação de três velas, em que existe um gap entre a primeira e a terceira velas. Forma uma zona entre níveis onde não há suporte de volume, o que geralmente leva a uma correção de preço. BPR   (Balanced Price Range) é uma combinação de dois padrões FVG que formam uma “
Easy Bands Mt4
Nikolay Kositsin
В основе индикатора EasyBands лежит тот же принцип, что и при построении Bollinger Band. Однако, данная модификация индикатора использует вместо стандартного отклонения средний торговый диапазон (Average True Range). Соответственно, с данным индикатором абсолютно аналогично можно использовать все стратегии, которые применяются с Bollinger Band. В данной версии индикатора используется двенадцать уровней и средняя линия (белый цвет). Индикация тренда выполнена в виде окраски свечей в зависимости
User friendly indicator.  This indicator will help you catch the trend an fast as possible. Indicator developed based on moving averages. User can select which type of moving averages they want to use. Indicator draws an arrow when the moving average crosses. The moving average cross over arrow can be filtered with RSI, OsMA, and Parabolic Sar. There are options for selecting specific criteria for the filters.  Such as period of Rsi and Rsi levels. OsMA and Parabolic Sar criteria can also be sel
PipFinite EA Breakout EDGE
Karlo Wilson Vendiola
5 (5)
The Official Automated Version of the Reliable Indicator PipFinite Breakout EDGE EA Breakout EDGE takes the signal of PipFinite Breakout EDGE indicator and manages the trade for you. Because of numerous financial instruments to consider, many traders want the signals to be fully automated. The EA will make sure all your trades are executed from entry to exit. Saving you time and effort while maximizing your profits. The Edge of Automation Effortless price action trading is now possible acros
Power Renko is an indicator which plots Renko bricks underneath the chart using a histogram. You can select the brick size and the timeframe of the Renko bricks as well as whether or not to use the close price or the high/low price of the candles. Renko bricks are based on price alone, not time, therefor the Renko bricks will not be aligned with the chart's time. They are extremely useful for trend trading and many different strategies can be formed from them. Buffers are provided allowing you t
Quantum Heiken Ashi PRO MT4
Bogdan Ion Puscasu
4.33 (6)
Apresentando o       Gráficos   Quantum Heiken Ashi PRO Projetadas para fornecer informações claras sobre as tendências do mercado, as velas Heiken Ashi são conhecidas por sua capacidade de filtrar o ruído e eliminar sinais falsos. Diga adeus às confusas flutuações de preços e olá para uma representação gráfica mais suave e confiável. O que torna o Quantum Heiken Ashi PRO verdadeiramente único é sua fórmula inovadora, que transforma os dados tradicionais de velas em barras coloridas fáceis de le
Os compradores deste produto também adquirem
Gann Made Easy
Oleg Rodin
4.83 (151)
Gann Made Easy é um sistema de negociação Forex profissional e fácil de usar, baseado nos melhores princípios de negociação usando a teoria do sr. W. D. Gann. O indicador fornece sinais precisos de COMPRA e VENDA, incluindo níveis de Stop Loss e Take Profit. Você pode negociar mesmo em movimento usando notificações PUSH. ENTRE EM CONTATO COMIGO APÓS A COMPRA PARA RECEBER DICAS DE NEGOCIAÇÃO, BÔNUS E O ASSISTENTE EA "GANN MADE EASY" GRATUITAMENTE! Provavelmente você já ouviu muitas vezes sobre os
Smc Blast Signal
Mohit Dhariwal
5 (3)
NEW YEAR 2026 SALE OFFER PRICE AT JUST 99 DOLLARS FEW COPIES ONLY AT This price From 10th Jan -25th Jan MIDNIGHT Final offer GRAB YOUR COPY ON THIS New Year EVE Prices will be increased to 150 after the offer period ends Full Fledged EA and Alert plus for alerts will also be provided in this offer along with the purchase of Indicator. Limited copies only at this price and Ea too. Grab your copy soon Alert plus for indicator with set file is kept in comment section with the image  SMC Blast Signa
Scalper Inside PRO
Alexey Minkov
4.74 (69)
An exclusive indicator that utilizes an innovative algorithm to swiftly and accurately determine the market trend. The indicator automatically calculates opening, closing, and profit levels, providing detailed trading statistics. With these features, you can choose the most appropriate trading instrument for the current market conditions. Additionally, you can easily integrate your own arrow indicators into Scalper Inside Pro to quickly evaluate their statistics and profitability. Scalper Inside
M1 Sniper
Oleg Rodin
4.89 (18)
O M1 SNIPER é um sistema indicador de negociação fácil de usar. É um indicador de seta projetado para o período M1. O indicador pode ser usado como um sistema independente para scalping no período M1 e pode ser usado como parte do seu sistema de negociação existente. Embora este sistema de negociação tenha sido projetado especificamente para negociação no M1, ele também pode ser usado em outros períodos. Originalmente, desenvolvi este método para negociar XAUUSD e BTCUSD. Mas considero-o útil ta
Game Changer Indicator
Vasiliy Strukov
4.47 (15)
O Game Changer é um indicador de tendências revolucionário, concebido para ser utilizado em qualquer instrumento financeiro, transformando o seu metatrader num poderoso analisador de tendências. O indicador não se retraça nem apresenta atrasos. Funciona em qualquer período de tempo e auxilia na identificação de tendências, sinaliza potenciais reversões, atua como um mecanismo de trailing stop e fornece alertas em tempo real para respostas rápidas do mercado. Quer seja um profissional experiente
Actualmente 20% OFF ! A melhor solução para qualquer novato ou comerciante especializado! Este software de painel de instrumentos está a funcionar em 28 pares de moedas. É baseado em 2 dos nossos principais indicadores (Advanced Currency Strength 28 e Advanced Currency Impulse). Dá uma grande visão geral de todo o mercado Forex. Mostra valores avançados de força da moeda, velocidade de movimento da moeda e sinais para 28 pares de divisas em todos os (9) períodos de tempo. Imagine como a sua n
O Apollo SR Master é um indicador de Suporte/Resistência com recursos especiais que tornam a negociação com zonas de Suporte/Resistência mais fácil e confiável. O indicador calcula as zonas de Suporte/Resistência em tempo real, sem qualquer atraso, detectando topos e fundos de preço locais. Em seguida, para confirmar a área de Suporte/Resistência recém-formada, o indicador exibe um sinal especial que indica que a zona pode ser considerada e usada como um sinal de VENDA ou COMPRA. Nesse caso, a f
First 25 copies at $80, after that price becomes $149 (4 copies left) Gold Signal Pro is a powerful MT4 indicator designed to help traders spot strong price reactions in the market. It focuses on clear wick rejections , showing when price strongly rejects a level and often continues in the same direction. Gold Signal Pro is mainly built for scalping gold (XAUUSD) and works best on lower timeframes like M5 and M15 , where timing matters most. That said, it can also be used on any forex pair, a
GOLD Impulse with Alert
Bernhard Schweigert
4.64 (11)
Este indicador é uma super combinação dos nossos 2 produtos Advanced Currency IMPULSE with ALERT  +   Currency Strength Exotics . Funciona para todos os períodos de tempo e mostra graficamente impulso de força ou fraqueza para as 8 principais moedas mais um Símbolo! Este Indicador é especializado para mostrar a aceleração da força da moeda para quaisquer símbolos como Ouro, Pares Exóticos, Commodities, Índices ou Futuros. É o primeiro do seu género, qualquer símbolo pode ser adicionado à 9ª
Trend indicator AI
Ramil Minniakhmetov
4.9 (77)
O indicador Trend Ai é uma ótima ferramenta que irá melhorar a análise de mercado de um trader, combinando a identificação de tendências com pontos de entrada acionáveis e alertas de reversão. Este indicador permite que os usuários naveguem pelas complexidades do mercado forex com confiança e precisão Além dos sinais primários, o indicador Trend Ai identifica pontos de entrada secundários que surgem durante retrações ou retrações, permitindo que os comerciantes capitalizem as correções de preço
Dynamic Forex28 Navigator
Bernhard Schweigert
4.43 (7)
Dynamic Forex28 Navigator - A ferramenta de negociação Forex de última geração. ATUALMENTE 49% DE DESCONTO. Dynamic Forex28 Navigator é a evolução dos nossos indicadores populares de longa data, combinando o poder de três em um: Indicador Advanced Currency Strength28 (695 avaliações) + Advanced Currency IMPULSE com ALERTA (520 avaliações) + Sinais CS28 Combo (Bônus). Detalhes sobre o indicador https://www.mql5.com/en/blogs/post/758844 O que o Next-Generation Strength Indicator oferece?  Tudo
Volatility Trend System - um sistema de negociação que dá sinais para entradas. O sistema de volatilidade fornece sinais lineares e pontuais na direção da tendência, bem como sinais para sair dela, sem redesenho e atrasos. O indicador de tendência monitora a direção da tendência de médio prazo, mostra a direção e sua mudança. O indicador de sinal é baseado em mudanças na volatilidade e mostra entradas no mercado. O indicador está equipado com vários tipos de alertas. Pode ser aplicado a vários i
Indicador Miraculous – Ferramenta 100% Não Repintável para Forex e Opções Binárias Baseada no Quadrado de Nove de Gann Este vídeo apresenta o Indicador Miraculous , uma ferramenta de negociação altamente precisa e poderosa, desenvolvida especificamente para traders de Forex e Opções Binárias . O que torna este indicador único é a sua base no lendário Quadrado de Nove de Gann e na Lei da Vibração de Gann , tornando-o uma das ferramentas de previsão mais precisas disponíveis na negociação moderna.
Atomic Analyst
Issam Kassas
5 (3)
Primeiramente, vale ressaltar que este Indicador de Negociação não repinta, não redesenha e não apresenta atrasos, tornando-o ideal tanto para negociação manual quanto automatizada. Manual do utilizador: configurações, entradas e estratégia. O Analista Atômico é um Indicador de Ação de Preço PA que utiliza a força e o momentum do preço para encontrar uma vantagem melhor no mercado. Equipado com filtros avançados que ajudam a remover ruídos e sinais falsos, e aumentam o potencial de negociação.
Trend Screener
STE S.S.COMPANY
4.79 (95)
Indicador de tendência, solução única inovadora para negociação e filtragem de tendências com todos os recursos de tendências importantes construídos dentro de uma ferramenta! É um indicador multi-timeframe e multi-moedas 100% sem repintura que pode ser usado em todos os símbolos/instrumentos: forex, commodities, criptomoedas, índices e ações. OFERTA POR TEMPO LIMITADO: O indicador Support and Resistance Screener está disponível por apenas US$ 50e vitalício. (Preço original US$ 250) (oferta este
ZeusArrow Smart Liquidity Finder  Smart Liquidity Finder is Ai controlled indicator based on the Idea of Your SL is My Entry. It scan and draws the major Liquidity areas on chart partitioning them with Premium and Discount Zone and allows you find the best possible trading setups and help you decide the perfect entry price to avoid getting your Stop Loss hunted . Now no more confusion about when to enter and where to enter. Benefit from this one of it's kind trading tool powered by Ai an trade
Algo Pumping MT4
Ihor Otkydach
4.69 (16)
PUMPING STATION – Sua estratégia pessoal “tudo incluído” Apresentamos o PUMPING STATION — um indicador revolucionário para Forex que vai transformar sua maneira de operar em uma experiência empolgante e eficaz. Este não é apenas um assistente, mas sim um sistema de trading completo com algoritmos poderosos que vão te ajudar a operar de forma mais estável. Ao adquirir este produto, você recebe GRATUITAMENTE: Arquivos de configuração exclusivos: para uma configuração automática e desempenho máximo
Trend Lines PRO
Roman Podpora
5 (1)
LINHAS DE TENDÊNCIA PRO       Ajuda a entender onde o mercado está realmente mudando de direção. O indicador mostra inversões de tendência reais e pontos onde os principais participantes retornam ao mercado. Você vê     Linhas BOS     Análise de tendências e níveis-chave em prazos maiores — sem configurações complexas ou ruídos desnecessários. Os sinais não são repintados e permanecem no gráfico após o fechamento da barra. O que o indicador mostra: Mudanças reais  tendência (linhas BOS) Uma vez
Se você comprar este indicador, receberá meu Gerenciador de Operações Profissional   + EA  GRATUITAMENTE. Primeiramente, vale ressaltar que este Sistema de Trading é um Indicador Não Repintado, Não Redesenho e Não Atrasado, o que o torna ideal tanto para o trading manual quanto para o automatizado. Curso online, manual e download de predefinições. O "Sistema de Trading Inteligente MT5" é uma solução completa de trading projetada para traders novos e experientes. Ele combina mais de 10 indicador
PZ Day Trading
PZ TRADING SLU
3.67 (3)
Este indicador detecta reversões de preços em zigue-zague, usando apenas análise de ação de preços e um canal donchiano. Ele foi projetado especificamente para negociações de curto prazo, sem repintar ou retroceder. É uma ferramenta fantástica para traders astutos, com o objetivo de aumentar o tempo de suas operações. [ Guia de instalação | Guia de atualização | Solução de problemas | FAQ | Todos os produtos ] Surpreendentemente fácil de negociar Fornece valor em cada período de tempo Impleme
ACTUALMENTE 20% DE DESCONTO ! A melhor solução para qualquer novato ou comerciante especializado! Este Indicador é uma ferramenta de negociação acessível porque incorporámos uma série de características proprietárias juntamente com uma nova fórmula. O Indicador Avançado de Volume de Moeda Acumulado é especializado para os principais 28 pares de Forex e funciona em todos os períodos de tempo. É uma nova fórmula que num único gráfico extrai todo o volume de moeda (C-Volume) de AUD, CAD, CHF, E
Versão MT5 disponível aqui: https://www.mql5.com/en/market/product/50538 Canal e grupo no Telegram: https://t.me/bluedigitsfx Acesso ao grupo VIP: Envie o comprovante de pagamento para nossa caixa de mensagens Corretora recomendada: https://bit.ly/BlueDigitsFxStarTrader BlueDigitsFx OBV Divergence — Indicador poderoso para MT4 que identifica divergências OBV e ajuda a prever reversões de mercado O indicador BlueDigitsFx OBV Divergence analisa o preço e o On-Balance Volume (OBV) para identif
M1 Arrow
Oleg Rodin
5 (20)
Uma estratégia intradiária baseada em dois princípios fundamentais do mercado. O algoritmo é baseado na análise de volumes e ondas de preços usando filtros adicionais. O algoritmo inteligente do indicador dá um sinal apenas quando dois fatores de mercado se combinam em um. O indicador calcula ondas de um determinado intervalo no gráfico M1 usando os dados do período de tempo mais alto. E para confirmar a onda, o indicador utiliza a análise por volume. Este indicador é um sistema de negociação pr
Apresentamos o Indicador de Avião F-16, uma ferramenta de ponta para o MT4 projetada para revolucionar sua experiência de negociação. Inspirado na velocidade e precisão incomparáveis do caça F-16, este indicador combina algoritmos avançados e tecnologia de última geração para oferecer um desempenho sem igual nos mercados financeiros. Com o Indicador de Avião F-16, você vai decolar acima da concorrência, pois ele fornece análises em tempo real e gera sinais de negociação altamente precisos. Suas
FX Volume
Daniel Stein
4.63 (38)
FX Volume: Vivencie o Verdadeiro Sentimento de Mercado sob a Perspectiva de um Corretor Visão Geral Rápida Quer aprimorar sua abordagem de trading? FX Volume fornece insights em tempo real sobre como traders de varejo e corretores estão posicionados—bem antes de relatórios atrasados como o COT. Seja para buscar ganhos consistentes ou simplesmente ter uma vantagem mais clara no mercado, FX Volume ajuda você a detectar grandes desequilíbrios, confirmar rompimentos e aperfeiçoar sua gestão de ris
Versão MT5 disponível aqui: https://www.mql5.com/en/market/product/50048 Canal e grupo do Telegram: https://t.me/bluedigitsfx Acesso ao grupo V.I.P: Envie o comprovante de pagamento de qualquer um dos nossos produtos pagos para a nossa caixa de entrada Corretora recomendada: https://bit.ly/BlueDigitsFxStarTrader BlueDigitsFx Easy 123 System — Sistema poderoso para detecção de reversões e rompimentos no MT4 Sistema tudo-em-um e sem repintura para identificar mudanças na estrutura do mercado,
Horizont
Ivan Stefanov
Horizont é um sistema de trading que fornece uma configuração completa de negociação: ponto de entrada, alvo 1, alvo 2 e stop loss, tudo calculado automaticamente. O sistema identifica automaticamente os topos e fundos do mercado e os conecta para definir a tendência atual. Você seleciona qual tendência negociar e o Horizont gera os níveis correspondentes de entrada, alvos e stop. O sistema inclui gestão automática de risco. Ele verifica o saldo da sua conta, calcula o risco e sugere o tamanho d
Matrix Arrow Indicator MT4
Juvenille Emperor Limited
5 (3)
O Matrix Arrow Indicator MT4 é uma tendência única 10 em 1 seguindo um indicador multi-timeframe 100% sem repintura que pode ser usado em todos os símbolos/instrumentos: forex, commodities, criptomoedas, índices, ações. O Matrix Arrow Indicator MT4 determinará a tendência atual em seus estágios iniciais, reunindo informações e dados de até 10 indicadores padrão, que são: Índice de movimento direcional médio (ADX) Índice de canal de commodities (CCI) Velas clássicas de Heiken Ashi Média Móvel Di
SMC Easy Signal
Mohamed Hassan
4.73 (15)
SMC Easy Signal was built to remove the confusion around the smart money concept by turning structural shifts like BOS (Break of Structure) and CHoCH (Change of Character) into simple buy and sell trading signals. It simplifies market structure trading by automatically identifying breakouts and reversals as they happen, allowing traders to focus on execution rather than analysis. Whether the market is continuing its trend or preparing to reverse, the indicator translates complex price action in
System Trend Pro
Aleksandr Makarov
5 (2)
System Trend Pro - This is the best trend trading indicator!!! The indicator no repaint!!!  The indicator has   MTF   mode, which adds confidence to trading on the trend (   no repaint   ). How to trade? Everything is very simple, we wait for the first signal (big arrow), then wait for the second signal (small arrow) and enter the market in the direction of the arrow. (See screens 1 and 2.) Exit on the opposite signal or take 20-30 pips, close half of it, and keep the rest until the opposite
Mais do autor
Identify Trend
Aleksey Ivanov
4.09 (23)
O indicador « Identify Trend»   (“Identificar Tendência”), usando métodos de filtragem razoavelmente simples, mas robustos (baseado na mediana móvel - Algoritmo XM )  e algoritmos mais complexos desenvolvidos pelo autor (XC, XF, XS, quatro tipos de médias móveis sem demora   SMAWL, EMAWL,  SSMAWL, LWMAWL ) , permite com muita precisão e, o mais importante, um pequeno atraso para estabelecer (1) o início do verdadeiro movimento da tendência e (2) identificar o plano. Esse indicador
FREE
Scientific trade
Aleksey Ivanov
5 (1)
An extremely convenient indicator that truly makes the process of making money on the exchange easy. It is based on the scientifically rigorous theory of the market developed by the author, the beginning of which is presented here .                The full algorithm of this indicator operation is presented in the article .               The indicator calculates the most probable price movement trajectory and displays it on the chart. Based on the predicted price movement trajectory
TrueChannel
Aleksey Ivanov
5 (8)
The TrueChannel   indicator shows us the true price movement channels. This indicator resembles Donchian Channel   in its appearance, but is built on the basis of completely different principles and gives (in comparison with Donchian Channel , which is better just to use to assess volatility) more adequate trading signals.              As shown in the article , the price actually moves in channels parallel to the time axis and jumps abruptly from the previous channels to the subsequ
FREE
Absolute Bands
Aleksey Ivanov
4.67 (3)
Principles of construction of the indicator.               The Absolute Bands (AB) indicator is reminiscent of the Bollinger Bands indicator with its appearance and functions, but only more effective for trading due to the significantly smaller number of false signals issued to them. This effectiveness of the Absolute Bands indicator is due to its robust nature.               In the Bollinger Bands indicator, on both sides of the moving average - Ma, there are lines spaced from Ma by the standa
FREE
Firstly , the script estimates how many Mx bars of the chart (on which this script is applied) the future trend will most likely continue and what is its quality. Secondly (and most importantly), the script is an auxiliary tool for the extremely mathematically advanced and extremely effective ScientificTrade indicator in trading. The script calculates the optimal averaging period, which is also equal to Mx, of the ScientificTrade indicator, which gives the maximum profit according to the strate
Quality trend
Aleksey Ivanov
5 (1)
The Quality trend indicator expresses the ratio of the strength of a trend or the speed of its growth (fall) to the degree of its noisiness or a certain norm of amplitudes of chaotic fluctuations of a growing (falling) price. The position of the indicator line above zero shows an increasing trend, below zero - a falling trend, the fluctuation of the indicator line near zero shows a flat. If the indicator line begins to fluctuate rapidly around zero and approach it, then this indica
The indicator visualizes the result of the   CalculateScientificTradePeriod    script (which, of course, also needs to be downloaded), which, firstly , estimates how many Mx bars of the active chart the future trend will most likely continue and what is its quality, and, secondly , calculates the optimal the averaging period (which is also equal to Mx) of the ScientificTrade   indicator, which gives the maximum profit according to the extremely effective   ScientificTrade strategy. For the FindS
Alligator Analysis
Aleksey Ivanov
5 (1)
Indicator description.            The “ Alligator Analysis ” ( AA ) indicator allows you to build various (by averaging types and by scales) “ Alligators ” and their combinations, i.e. allows you to analyze the state of the market based on the correlation of this state with a whole range of different " Alligators ".  The classic " Alligator " by Bill Williams is based on moving averages and Fibonacci numbers, which makes it one of the best indicators now. The classic " Alligator "   is based on
FREE
Channel Builder
Aleksey Ivanov
4.75 (4)
The Channel Builder (CB) or Ivanov Bands indicator is a broad generalization of the Bollinger Bands indicator. First, in CB, the mean line <X> is calculated using various averaging algorithms. Secondly, the mean deviations calculated by Kolmogorov averaging are plotted on both sides of the middle line <X>.                The middle line <X>, besides the standard SMA, EMA, SMMA and LWMA averaging algorithms, can be Median = (Max + Min) / 2 sliding median (which is the default). In
FREE
PDP indicator is used for: defining price probability distributions. This allows for a detailed representation of the channel and its borders and forecast the probability of a price appearing at each segment of its fluctuations; defining the channel change moment. Operation principles and features PDP analyzes a quote history on lower timeframes and calculates a price probability distribution on higher ones. Forecast algorithms allow the indicator to calculate probability distributions and mov
Signal Bands is a sensitive and convenient indicator, which performs deep statistical processing of information. It allows to see on one chart (1) the price trend, (2) the clear price channel and (3) latent signs of trend change. The indicator can be used on charts of any periods, but it is especially useful for scalping due to its high sensitivity to the current market state. The functions of the indicator : First, the Signal Bands indicator draws channels into which all price fluctuations exa
Iterative Moving Average – IMA.   IMA is obtained by correcting the usual   MA.   The correction consists in addition   to MA averaged difference between the time series (X) and its MA, i.e.   IMA(X)=MA(X) + MA ( Х -MA(X)). Correction is done in several iterations (and, exactly, 2 iterations in this indicator) and with a change in the averaging period.               As a result, the time-series points begin to cluster around (on all sides) of the getting   IMA and with a smaller de
Sensitive Signal
Aleksey Ivanov
5 (2)
O indicador Sensitive Signal (SS), usando os métodos de filtragem desenvolvidos pelo autor, permite, com um alto grau de probabilidade, estabelecer o início do movimento de tendência true. Ao mesmo tempo, os preços aleatórios são filtrados, o que torna a negociação no câmbio muito eficiente. A filtragem desenvolvida pelo autor é realizada em várias iterações e revela a verdadeira trajetória do movimento regular de preços (mais precisamente, a curva mais provável de tal movimento) e
Profit MACD
Aleksey Ivanov
5 (2)
I present an indicator for professionals. ProfitMACD is very similar to classic MACD in appearance and its functions . However, ProfitMACD is based on completely new algorithms (for example, it has only one averaging period) and is more robust, especially on small timeframes, since it filters random price walks. The classic MACD indicator (Moving Average Convergence / Divergence) is a very good indicator following the trend, based on the ratio between two moving averages, namely the EM
The principle of the indicator.               A simple moving average (SMA) with an averaging period (2n + 1) of bars is always obtained lagging by n bars. If SMA or other types of moving averages are the basis for making trading decisions, then their strong delay does not allow   to open positions in time and close positions, which leads to losses.                            The Estimation moving average without lag ( EMAWL ) indicator calculates the non-lagging moving average, which is calcula
The principle of the indicator.               The Strong Trend Flat Signal (STFS) indicator is the intersection of two, developed by the author, non-lagging moving averages with averaging periods 21 and 63.               A simple moving average (SMA) with an averaging period (2n + 1) of bars is always obtained lagging by n bars. If SMA or other types of moving averages are the basis for making trading decisions, then their strong delay does not allow  to open positions in time and close positio
StatChannel
Aleksey Ivanov
5 (1)
The principle of the indicator.               The StatChannel ( SC ) indicator is a development of the Bollinger Bands indicator ( ВВ ).  BB is a moving average, on both sides of which two lines are drawn, separated from it by standard deviations std multiplied by the corresponding coefficient. At the same time, a moving average with an averaging period (2n + 1) bars is always obtained lagging behind n bars.  Sliding std is also lagging behind on n bars, also calculated by (2n + 1) points. Such
StatPredict
Aleksey Ivanov
Introdução.              O indicador prevê o preço de acordo com a tendência prevalecente e as suas próprias pequenas flutuações estatísticas de preço. No StatPredict, você precisa definir o horizonte de tempo dos eventos previstos, que é definido pelas configurações de parâmetros do indicador « Length of forecast in bars» e determinado pela escala de tempo característica da tendência atual, que é melhor medida pelo indicador ProfitMACD .                         O cálculo final das leituras do i
Asummetry
Aleksey Ivanov
The principle of the indicator.                             The Asummetry  indicator allows you to predict the beginning of a change in the direction of trends, long before their visual appearance on the price chart.               The author statistically revealed that before changing the direction of the trend, the probability distribution function of the price is made as asymmetric as possible. More precisely, the price movement in any direction always pulls sideways the function of its dist
Indicator is used for: defining price probability distributions. This allows for a detailed representation of the channel and its borders and forecast the probability of a price appearing at each segment of its fluctuations; defining the channel change moment.   Operation principles and features Indicator analyzes a quote history on lower timeframes and calculates a price probability distribution on higher ones. Forecast algorithms allow the indicator to calculate probability distributions and m
The Identify Market State   indicator allows you to set the beginning of a new trends and pullbacks on an existing trend. This indicator can be used both for trading on scalper strategies and for long-term trading strategies.               The indicator is based on the 14 periodic DeMarker   indicator and the 8 periodic simple moving average from this indicator. Statistical studies have shown that the sharp peaks of the DeMarker   indicator curve when they drop below its minimum li
The Signal Envelopes   indicator uses the robust filtering method based on: (1) the moving median Buff0 = <Median> = (Max {x} + Min {x}) / 2 and (2) the averaging algorithm developed by the author Buff1 = <(<Median> ) ^ (- 3)> * (<Median>) ^ 4  based on the moving median. The Signal Envelopes   indicator allows you to most accurately and with the minimum possible delay set the beginning of a new trend.  The Signal Envelopes indicator can be used both for trading according to scalpe
The principle of constructing indicator lines .               Profit Trade  indicator is very effective for trading. Profit Trade  is a deep development of the well-known Donchian channel  indicator. The upper (BlueViolet color) Dup and the lower (IndianRed) Ddn lines of the indicator are constructed in the same way as in the Donchian channel , based on the highest (high of High) and lowest (low of Low) prices for the previous n1 = 20 periods. The middle line (Gold) Dm is constructed in the sam
The principle of constructing indicator lines and their meaning .               The Signal Channel   indicator uses a robust filtering method based on two moving medians applicable to the High and Low prices, i.e. the lines <High> and <Low>, where <..> is the sign of linear averaging, which are shifted by certain values ​​in an uptrend and by opposite values ​​in a downtrend, which allows you to get a narrow channel, approximately outlining each bar. Sharp kinks of the lines of such a channel a
Robust Filter
Aleksey Ivanov
5 (1)
The Robust filter   indicator is based on the robust filtering algorithm developed by the author using the multi-period averaged moving median. The algorithm for this averaging is shown in the last screenshot.                The indicator calculates and shows: 1. The direction of the trend; 2. Entry and exit points of positions; 3. StopLoss   lines calculated from current price probability distributions and selected probability of closing an order by StopLoss before the trend revers
This   indicator is intended for professionals assessing fundamental market trends.  This indicator calculates the index of any instrument and analyzes it.              The index of the state currency shows the real purchasing power of this currency, and the dynamics of this index shows the dynamics of the economic state of the corresponding state. An analysis of the indices of both currencies included in a currency pair makes it much more reliable to identify the trend of this cur
The Multicurrency Trend Detector ( MTD ) indicator allows you to immediately and on one chart on a selected time interval (extending from a zero bar to a bar set in the settings by the value horizon) determine the presence, direction and strength of trends in all major currencies, as well as assess the reliability of these trends.               This is achieved by calculating indices (non-relative purchasing power) of eight major currencies, namely: AUD, CAD, CHF, EUR, GBP, JPY, NZ
StatZigZag
Aleksey Ivanov
The StatZigZag  indicator looks like a regular ZigZag , but is built on the basis of completely different algorithms. The StatZigZag  indicator is a broken line built from segments of regression lines of different lengths, the beginning of each of which comes from the end of the previous segment. Each regression segment is built until the variance or spread of price around it begins to exceed a certain critical value, after which the construction of this segment ends and the constr
The Velocity of price change   ( VP ) indicator shows the average rate of price change at those characteristic time intervals where this rate was approximately constant. The robust algorithm used in VP   to smooth out the price from its random jumps, ensures the reliability of the indicator reading, which does not react to simple price volatility and its insignificant movements.             The indicator allows you to track trends and the moments of their reversals , during which t
Casual Channel
Aleksey Ivanov
5 (1)
As tendências que você vê nos gráficos nem sempre são tendências ou, mais precisamente, tendências com as quais você pode ganhar dinheiro. A questão é que existem dois tipos de tendências:  1)    tendências verdadeiras que são causadas por razões econômicas fundamentais que são estáveis ​​e, portanto, podem fornecer um lucro confiável para o comerciante;  2)  e há seções de tendências falsas que apenas parecem uma tendência e surgem devido a cadeias de eventos aleatórios que desloc
Filtro:
Sem comentários
Responder ao comentário