Margin Out aud PLUS 100

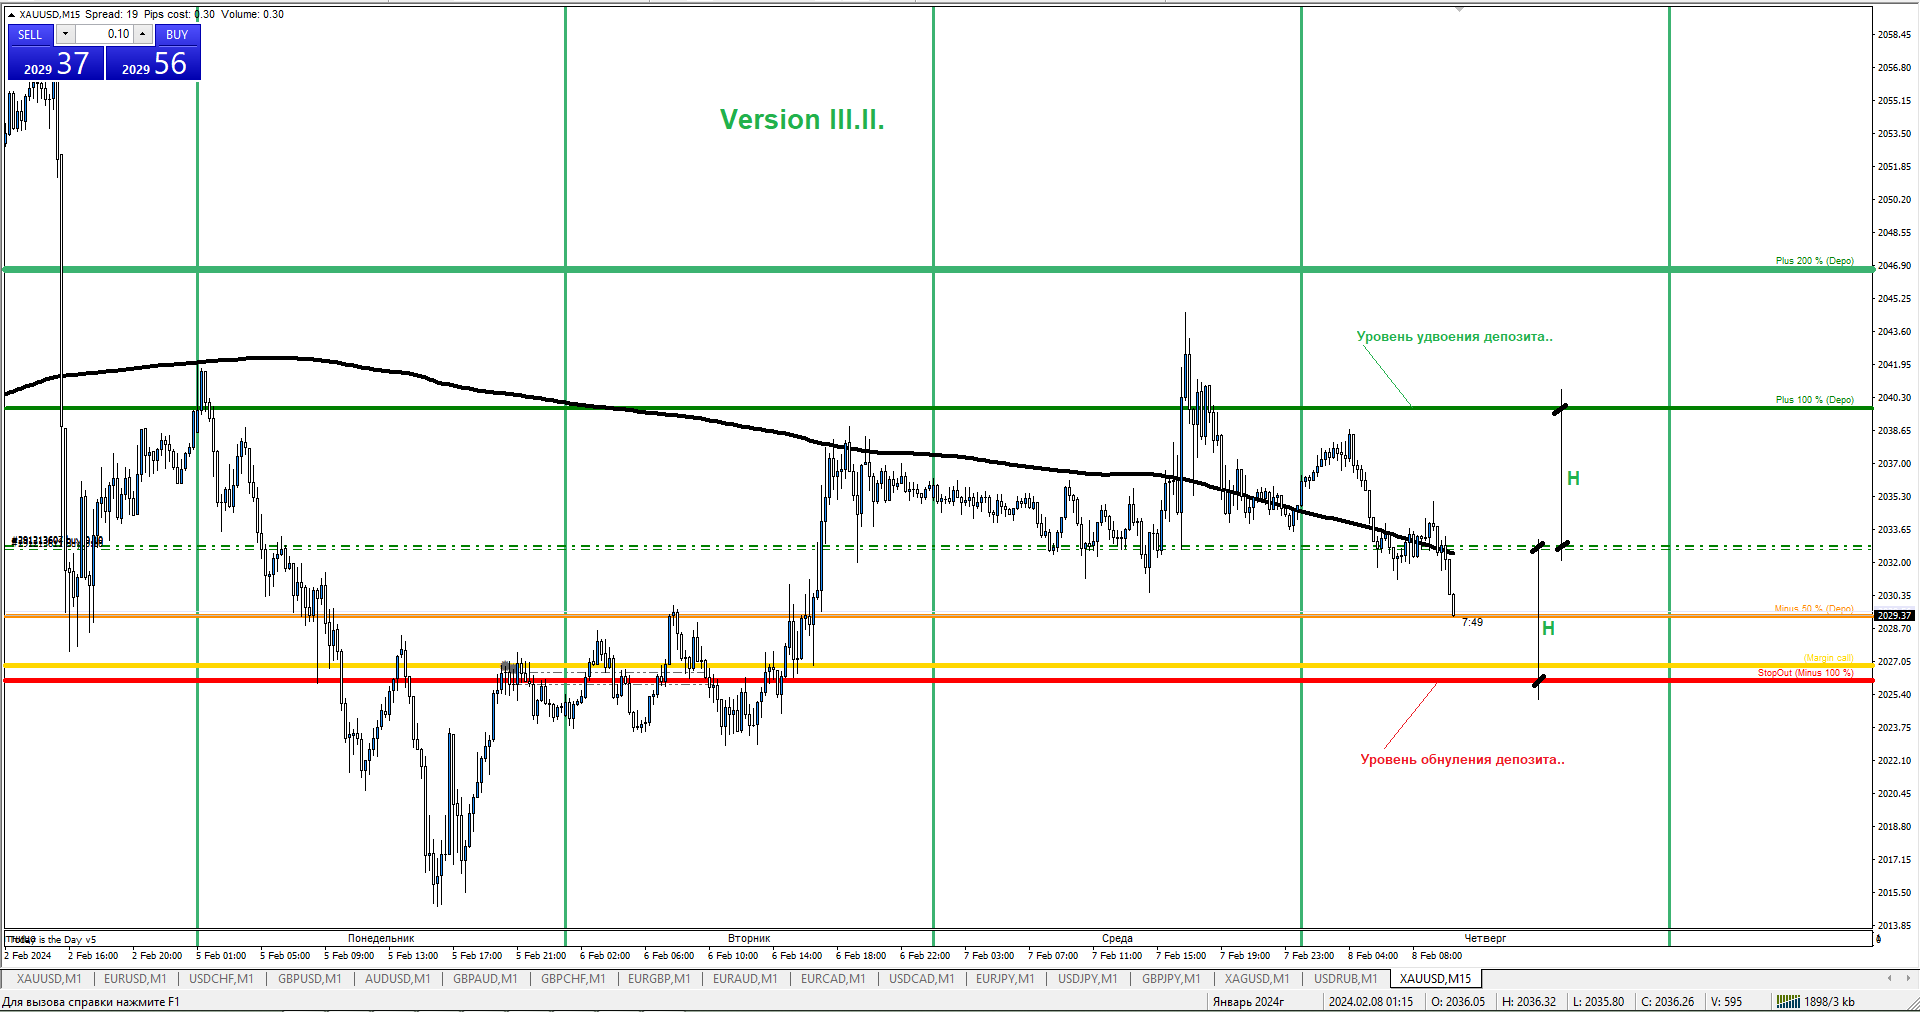
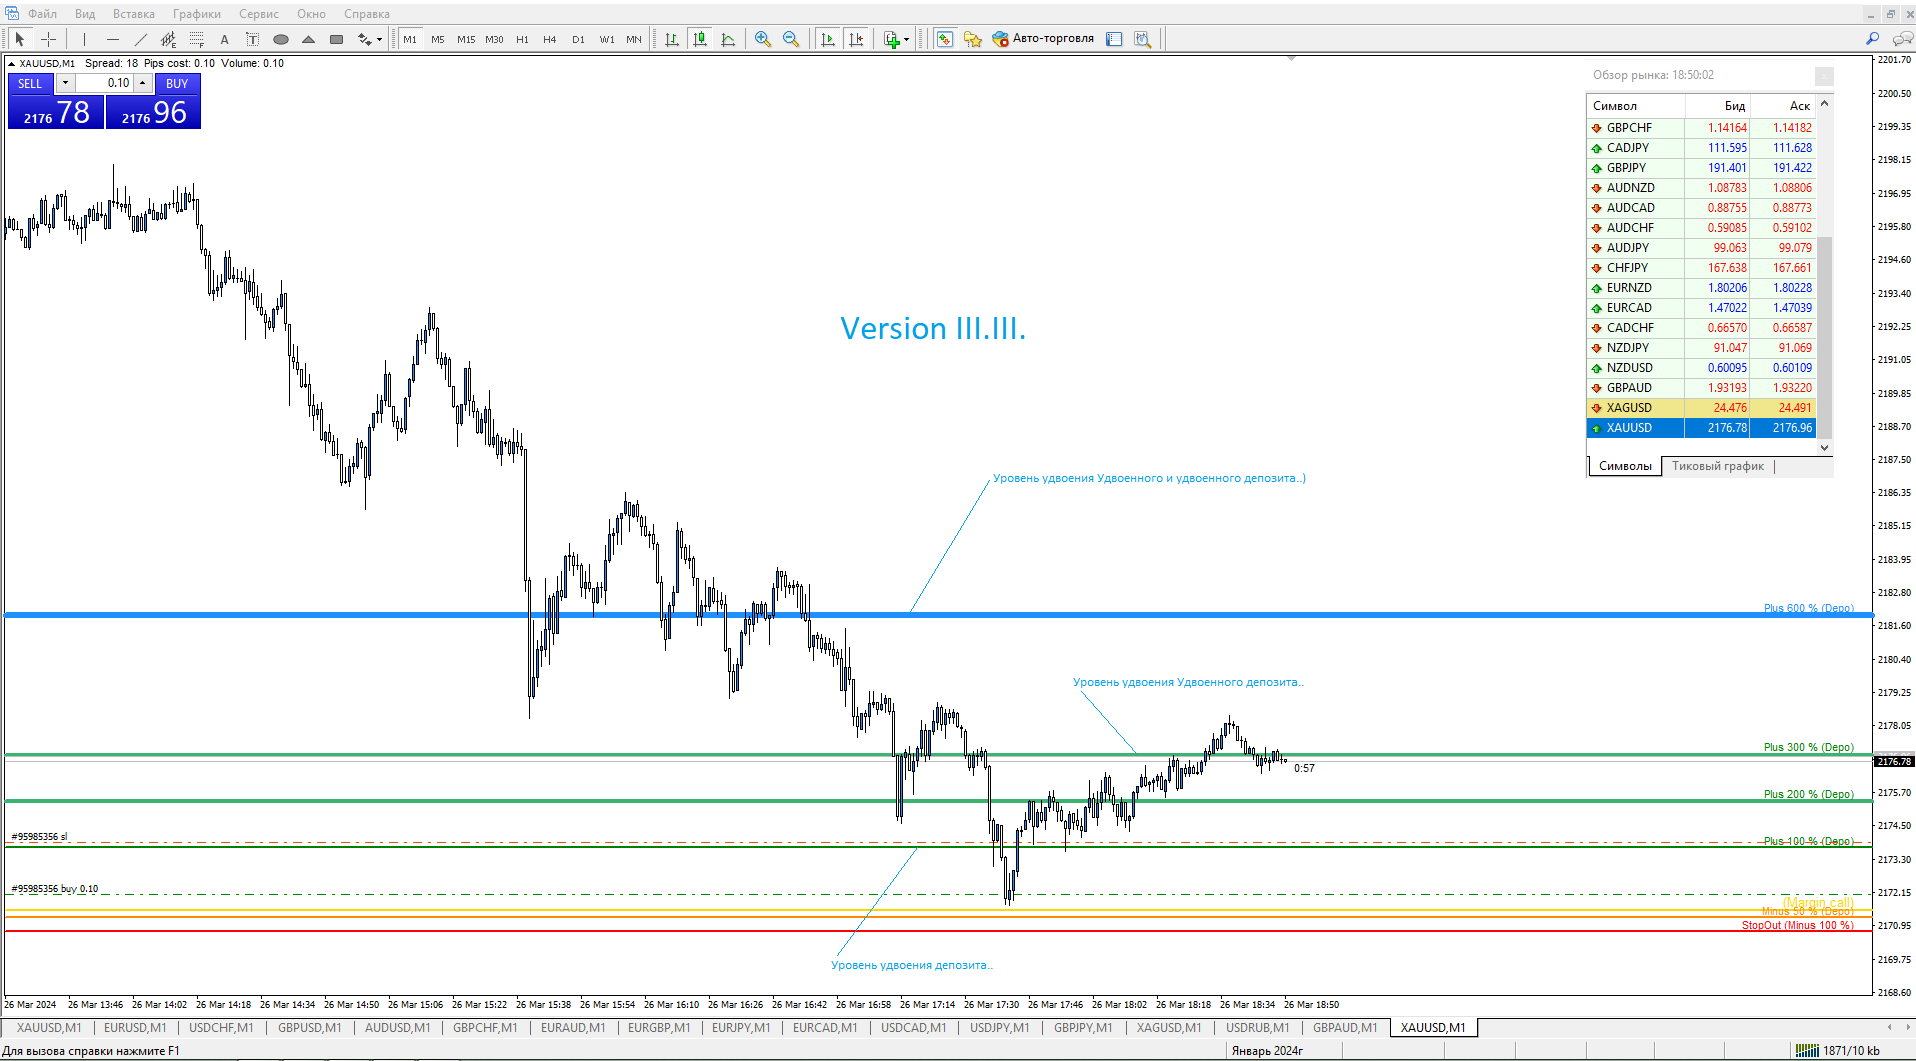
Indicator of the Margin Call, Stop Out and Plus 100 (one hundred percent of profit to the deposit) levels.

It has been designed to better visualize and maintain money management when trading financial instruments.

The levels drawn by the indicator have different colors. They visualize the price range, at which a broker generates a notification (Margin Call) and force closes the deals (Stop Out) due to the shortage of funds on the account, in case the price goes against the positions opened by a trader.

If the trader makes a correct prediction of the price movement, and the current price moves towards the take profit of the opened positions, the trader will be able to use the indicator to tell where to get a profit equal to one hundred per cent of the deposit.

The Plus 100% level.


Briefly about the leverage concepts

Margin call (margin requirement) is a notification from a broker to deposit additional funds to maintain all opened positions. If no additional funds are received on the account, while the drawdown continues to increase, then once a certain value is reached stop out will be activated, and the Forex broker will force close some or all the deals. In general, the concept of margin call came to Forex from the stock exchange, where before the advent of the Internet most of the deals were performed via the phone. The broker's representative called traders and warned them of the upcoming stop out.


Default inputs of the indicator

  • Color of the (-20%) Stop Out level: - Red;
  • Level thickness: - 2;
  • Level style: - Solid;
  • Color of the (-50%) Margin Call level: - Gold;
  • Level thickness: - 2;
  • Level style: - Solid;
  • Color of the (+100%) Deposit Doubling level: - Green;
  • Level thickness: - 2;
  • Level style: - Solid;


A few tips for traders

  1. Always stick to money management of your trading strategy.
  2. Do not open deals using the entire deposit.
  3. Make sure the Stop Out and Margin Call levels are hidden behind strong technical levels.
  4. If the price moves in your favor, do not be greedy while waiting for the deposit to double.
  5. Take care of the deposit.
Produtos recomendados
Trend PA
Mikhail Nazarenko
5 (3)
The Trend PA indicator uses   Price Action   and its own filtering algorithm to determine the trend. This approach helps to accurately determine entry points and the current trend on any timeframe. The indicator uses its own algorithm for analyzing price changes and Price Action. Which gives you the advantage of recognizing, without delay, a new nascent trend with fewer false positives. Trend filtering conditions can be selected in the settings individually for your trading style. The indicator
O indicador Crypto_Forex "Auto FIBO Pro" é uma ótima ferramenta auxiliar na negociação! - O indicador calcula e coloca automaticamente no gráfico os níveis de Fibonacci e as linhas de tendência locais (cor vermelha). - Os níveis de Fibonacci indicam áreas-chave onde o preço pode reverter. - Os níveis mais importantes são 23,6%, 38,2%, 50% e 61,8%. - Pode utilizá-lo para scalping de reversão ou para negociação de grelha de zona. - Existem muitas oportunidades para melhorar o seu sistema atual u
Price Magnet — Price Density and Attraction Levels Indicator Price Magnet is a professional analytical tool designed to identify key support and resistance levels based on statistical Price Density. The indicator analyzes a specified historical period and detects price levels where the market spent the most time. These zones act as “magnets,” attracting price action or forming a structural base for potential reversals. Unlike traditional Volume Profile tools, Price Magnet focuses on price-time d
Индикатор виртуального эквити, представляемый здесь, может работать по нескольким символам одновременно. Для каждого символа задается направление ( Buy/Sell ) и размер позиции. В настройках также указывается размер предполагаемого депозита, дата открытия и закрытия позиции.   На графике при этом устанавливаются вертикальные линии, обозначающие указываемые в настройках даты.  После установки индикатора на график, можно изменять время открытия и закрытия позиции, передвигая эти линии.   Дату закр
Rainbow Price Visualizer v1.21 See where the market really breathes. Turns your MT4 chart into an ultra-precise heatmap that highlights price zones favored by big players. Why it matters 300 price levels at 0.2‑pip resolution — microscopic detail. 8 visual themes (Rainbow, Fire, Ocean…) for instant readibility. Smart opacity: low noise fades, real zones pop. Lightweight rendering with automatic cleanup. Fully customizable: saturation, opacity, resolution, history depth. Bands project into the f
Basic Theme Builder
Mehran Sepah Mansoor
5 (1)
Basic Theme Builder: Simplifique a Personalização do Seu Gráfico Transforme sua experiência de negociação com o   Basic Theme Builder , um indicador versátil projetado para simplificar a personalização da aparência do seu gráfico no MetaTrader 4. Este indicador intuitivo oferece um painel fácil de usar que permite alternar rapidamente entre vários temas e esquemas de cores, melhorando tanto o apelo visual quanto a funcionalidade do seu ambiente de negociação.   Free MT5 version O   Basic Theme
FREE
Trend Ray
Andriy Sydoruk
The indicator shows the potential trend direction by cyclical-wave dependence. Thus, all the rays of the intersection will be optimal rays, in the direction of which the price is expected to move, taking into account the indicator period. Rays can be used as a direction for potential market movement. But we must not forget that the approach must be comprehensive, the indicator signals require additional information to enter the market.
This EA is an extension for the free trade indicator Trend Mate . https://www.mql5.com/en/market/product/50082 The main idea is to support your decision to  trade  according to the current trend. It is possible to configure alert and push notification to receive when entering to first candle for bull / bear trend. For this extension of the free indicator now it is possible to filter the current trend info with other timeframes. For example show trend for timeframe M5 considering also timeframe
This indicator is one of the useful tools for traders who trade on currency pairs and based on the strength of each currency they can make a correct decision or confirmation in the positions.  It has been calculated for all the minor currency pairs supported by the broker and displays the values of the major currencies. These currencies are displayed horizontally or vertically according to the trader's config when executing the indicator. One of the trading strategies that can be used is to cho
FREE
O indicador mostra o horário de funcionamento das bolsas mundiais. Ajuda você a ver quais mercados estão mais ativos no momento Confira meu  #1 Pro  Utility : 66+ recursos, incluindo esta ferramenta  |   Entre em contato  se tiver alguma dúvida Ajuda a selecionar os instrumentos mais voláteis no momento; Especialmente útil para traders intradia; 1) Ao usar em prazos 1H e inferiores: as linhas corresponderão à localização real das barras no gráfico, e ao mover o gráfico, as linhas das sessões de
Discover the power of precision and efficiency in your trading with the " Super Auto Fibonacci " MT4 indicator. This cutting-edge tool is meticulously designed to enhance your technical analysis, providing you with invaluable insights to make informed trading decisions. Key Features: Automated Fibonacci Analysis: Say goodbye to the hassle of manual Fibonacci retracement and extension drawing. "Super Auto Fibonacci" instantly identifies and plots Fibonacci levels on your MT4 chart, saving you tim
FREE
The indicator detects and displays М. Gartley's Butterfly pattern. The pattern is plotted by the extreme values of the ZigZag indicator (included in the resources, no need to install). After detecting the pattern, the indicator notifies of that by the pop-up window, a mobile notification and an email. The pattern and wave parameters are displayed on the screenshots. The default parameters are used for demonstration purposes only in order to increase the amount of detected patterns. Parameters z
VR Cub
Vladimir Pastushak
VR Cub é um indicador para obter pontos de entrada de alta qualidade. O indicador foi desenvolvido para facilitar cálculos matemáticos e simplificar a busca por pontos de entrada em uma posição. A estratégia de negociação para a qual o indicador foi escrito tem provado a sua eficácia há muitos anos. A simplicidade da estratégia de negociação é a sua grande vantagem, o que permite que até mesmo os comerciantes novatos negociem com sucesso com ela. VR Cub calcula os pontos de abertura de posição e
Order Blocks Breaker
Suvashish Halder
5 (2)
Introducing Order Blocks Breaker , a brand-new way to identify and leverage order blocks in your trading strategy. After developing multiple order block tools with unique concepts, I’m proud to present this tool that takes things to the next level. Unlike previous tools, Order Blocks Breaker not only identifies order blocks but also highlights Breaker Order Blocks —key areas where the price is likely to retest after a breakout. MT5 -  https://www.mql5.com/en/market/product/124102/ This tool inco
Koala Supply Demand
Ashkan Hazegh Nikrou
5 (3)
Apresentando o Indicador de Oferta e Demanda Koala para MetaTrader 4 (Incentivamos você a compartilhar sua avaliação ou feedback — seja positivo ou negativo — para que outros traders possam se beneficiar de sua experiência.) : Bem-vindo ao Indicador de Oferta e Demanda Koala. Este indicador é projetado para identificar zonas contínuas de oferta e demanda. Ele pode ajudar o trader a visualizar o mercado como áreas de zona; você pode ver como o preço respeita algumas zonas poderosas. Este indicad
FREE
Email Drawdown Alert
Roman Starostin
5 (12)
Free informative Indicator-helper. It'll be usefull for traders who trade many symbols or using grid systems (Averaging or Martingale). Indicator counts drawdown as percent and currency separate. It has a number of settings: Count deposite drawdown according equity value and send e-mail or notifications to user if DD more than set; Sending e-mail when max open orders reached; Shows price and remaining pips amount before MarginCall on current chart and Account generally; Display summary trade lot
FREE
Magic Balance
Daniil Evstratenko
The indicator shows which trading pairs, strategies, robots and signals that you use are profitable and which are not. The statistic of trades and balance graph are displayed in the account currency and pips - to switch simply click on the graph. button "$"(top left) - minimize/expand and move the indicator panel button ">"(bottom right) - stretching and resetting to the original size Statistic of trades 1 line - account balance, current profit and lot of open trades; 2 line - the number of all
Candle Pattern Finder Candle Pattern Finder is a powerful MT4 indicator designed to help traders easily detect key candlestick patterns in real-time. Whether you're trading trends, reversals, or consolidations, this tool highlights important price action signals directly on the chart — helping you make faster and more confident trading decisions. Detects popular candlestick patterns: Bullish/Bearish Engulfing Hammer & Inverted Hammer Shooting Star & Hanging Man Three White Soldiers Three Black
FREE
Trend Scanner
Vladimir Kalendzhyan
4.33 (6)
By purchasing this indicator, you have the right to receive a free copy of one of   my other indicator's or advisor’s!  (All future updates are included. No limits) . To get it , please contact me by  mql5 message ! The Trend Scanner trend line indicator displays the trend direction and its changes. The indicator works on all currency pairs and  timeframes. The indicator simultaneously displays multiple readings on the price chart: the support and resistance lines of the currency pair, the exist
Diamond Trend
Segundo Calvo Munoz
Indicator which identifies Trend and also buy/sell opportunities. Use for entries aligned to the Trend.  Although Diamond Trend is very accurate identifying entry points, it is always recommended to use a support indicator in order to reconfirm the operation. Remind to look for those Assets and Timeframes which best fit to your trader behavior/need... Valid for Scalping and Long Term operations. Please, set up a Bars Chart to be able to visualize the indicator properly...  ...And remind to give
VSA Histogram
Richard Bystricky
VSA - P (Volume Spread Analysis) Period-Based Histogram is a tool that visually represents market volume dynamics using Volume Spread Analysis principles, with a focus on highlighting key volume changes over specific time periods. The histogram captures changes in volume and price spread relationships in real-time, enabling traders to detect early signals of accumulation, distribution, and shifts in buying or selling pressure. Indicator is non repainting and working with real-time on tick data.
The indicator detects and displays 3 Drives harmonic pattern (see the screenshot). The pattern is plotted by the extreme values of the ZigZag indicator (included in the resources, no need to install). After detecting the pattern, the indicator notifies of that by a pop-up window, a mobile notification and an email. The indicator highlights the process of the pattern formation and not just the complete pattern. In the former case, it is displayed in the contour triangles. After the pattern is com
Double HMA lines MTF
Pavel Zamoshnikov
5 (1)
This is a multi-timeframe version of the popular Hull Moving Average (HMA). The Double HMA MTF Light indicator combines two timeframes on a single chart. The HMA of the higher timeframe defines the trend, and the HMA of the current timeframe defines short-term price movements. The indicator is freely distributed and hasn't audio signals or messages. Its main function is the visualization of price movements. If you need advanced functionality of the HMA multi-timeframe indicator (information ab
FREE
Owl smart levels
Sergey Ermolov
4.26 (38)
Versão MT5  |  FAQ O   Indicador Owl Smart Levels   é um sistema de negociação completo dentro de um indicador que inclui ferramentas populares de análise de mercado, como   fractais avançados de Bill Williams , Valable ZigZag que constrói a   estrutura de onda correta   do mercado e   níveis de Fibonacci que marcam os níveis exatos de entrada no mercado e lugares para obter lucros. Descrição detalhada da estratégia Instruções para trabalhar com o indicador Consultor de negociação Owl Helper Ch
Traditional MACD MT4
Daniel Lewis
4.58 (55)
Indicador MACD em MetaTrader 4/5 parece diferente do que o MACD faz na maioria dos outros softwares gráficos. Isso é porque a versão MetaTrader 4/5 de MACD mostra a linha MACD como um histograma quando é tradicionalmente apresentado como uma linha. Além disso, a versão MetaTrader 4/5 calcula a linha de sinal usando uma SMA, no entanto de acordo com a definição, o indicador MACD supostamente é calculado com uma EMA. A versão MetaTrader 4/5 também não computa um verdadeiro Histograma MACD (a difer
FREE
Italo Levels Indicator
Italo Santana Gomes
5 (9)
BUY INDICATOR AND GET EA FOR FREE AS A BONUS + SOME OTHER GIFTS! ITALO LEVELS INDICATOR  is the best levels indicator ever created, and why is that? Using high volume zones on the market and Fibonacci the Indicator works on all time-frames and assets, indicator built after 7 years of experience on forex and many other markets. You know many levels indicators around the internet are not complete, does not help, and it's difficult to trade, but the   Italo Levels Indicator is different , the Ital
Trendiness Index
Libertas LLC
5 (3)
"The trend is your friend" is one of the best known sayings in investing, because capturing large trendy price movements can be extremely profitable. However, trading with the trend is often easier said than done, because many indicators are based on price reversals not trends. These aren't very effective at identifying trendy periods, or predicting whether trends will continue. We developed the Trendiness Index to help address this problem by indicating the strength and direction of price trend
Rainbow MT4
Jamal El Alama
Rainbow MT4 is a technical indicator based on Moving average with period 34 and very easy to use. When price crosses above MA and MA changes color to green, it’s a signal to buy. When price crosses below MA and MA changes color to red, it’s a signal to sell. The Expert advisor ( Rainbow EA MT4) based on Rainbow MT4 indicator, as you can see in the short video below is now available here .
FREE
Vanexio
Sayan Vandenhout
VANEXIO USES THE TREND WAVE INDICATOR AND IT CAN IDENTIFY THE BEGINNING AND THE END OF A NEW WAVE TREND MOVEMENT. AS AN OSCILLATOR, THE INDICATOR IDENTIFIES THE OVERBOUGHT AND OVERSOLD ZONES. IT WORKS GREAT TO CATCH THE SHORT TERM PRICE REVERSALS AND USES A MARTINGALE STRATEGY TO CLOSE ALL TRADES IN PROFIT. USE DEFAULT SETTINGS ON H1 OR HIGHER TIME FRAME ON ANY PAIR FOR MORE ACCURATE TRADES WHY THIS EA : Smart entries calculated by 5 great strategies The EA can be run on even a $20000 acco
FREE
Follow The Line
Oliver Gideon Amofa Appiah
3.94 (16)
FOLLOW THE LINE GET THE FULL VERSION HERE: https://www.mql5.com/en/market/product/36024 This indicator obeys the popular maxim that: "THE TREND IS YOUR FRIEND" It paints a GREEN line for BUY and also paints a RED line for SELL.  It gives alarms and alerts of all kinds. IT DOES NOT REPAINT and can be used for all currency pairs and timeframes. Yes, as easy and simple as that. Even a newbie can use it to make great and reliable trades. NB: For best results, get my other premium indicators for more
FREE
Os compradores deste produto também adquirem
Gann Made Easy
Oleg Rodin
4.83 (156)
Gann Made Easy é um sistema de negociação Forex profissional e fácil de usar, baseado nos melhores princípios de negociação usando a teoria do sr. W. D. Gann. O indicador fornece sinais precisos de COMPRA e VENDA, incluindo níveis de Stop Loss e Take Profit. Você pode negociar mesmo em movimento usando notificações PUSH. ENTRE EM CONTATO COMIGO APÓS A COMPRA PARA RECEBER DICAS DE NEGOCIAÇÃO, BÔNUS E O ASSISTENTE EA "GANN MADE EASY" GRATUITAMENTE! Provavelmente você já ouviu muitas vezes sobre os
Scalper Inside PRO
Alexey Minkov
4.74 (69)
An exclusive indicator that utilizes an innovative algorithm to swiftly and accurately determine the market trend. The indicator automatically calculates opening, closing, and profit levels, providing detailed trading statistics. With these features, you can choose the most appropriate trading instrument for the current market conditions. Additionally, you can easily integrate your own arrow indicators into Scalper Inside Pro to quickly evaluate their statistics and profitability. Scalper Inside
Indicador Miraculous – Ferramenta 100% Não Repintável para Forex e Opções Binárias Baseada no Quadrado de Nove de Gann Este vídeo apresenta o Indicador Miraculous , uma ferramenta de negociação altamente precisa e poderosa, desenvolvida especificamente para traders de Forex e Opções Binárias . O que torna este indicador único é a sua base no lendário Quadrado de Nove de Gann e na Lei da Vibração de Gann , tornando-o uma das ferramentas de previsão mais precisas disponíveis na negociação moderna.
RFI levels PRO
Roman Podpora
5 (1)
O indicador mostra com precisão os pontos de reversão e as zonas de retorno de preço onde o   Principais players . Você identifica onde novas tendências estão se formando e toma decisões com máxima precisão, mantendo o controle sobre cada negociação. VERSION MT5     -     Revela seu potencial máximo quando combinado com o indicador   TREND LINES PRO. O que o indicador mostra: Estruturas de reversão e níveis de reversão com ativação no início de uma nova tendência. Exibição dos níveis de   TAKE
Dynamic Forex28 Navigator
Bernhard Schweigert
4.43 (7)
Dynamic Forex28 Navigator - A ferramenta de negociação Forex de última geração. ATUALMENTE 49% DE DESCONTO. Dynamic Forex28 Navigator é a evolução dos nossos indicadores populares de longa data, combinando o poder de três em um: Indicador Advanced Currency Strength28 (695 avaliações) + Advanced Currency IMPULSE com ALERTA (520 avaliações) + Sinais CS28 Combo (Bônus). Detalhes sobre o indicador https://www.mql5.com/en/blogs/post/758844 O que o Next-Generation Strength Indicator oferece?  Tudo
Precautions for subscribing to indicator This indicator only supports the computer version of MT4 Does not support MT5, mobile phones, tablets The indicator only shows the day's entry arrow The previous history arrow will not be displayed (Live broadcast is for demonstration) The indicator is a trading aid Is not a EA automatic trading No copy trading function The indicator only indicates the entry position No exit (target profit)  The entry stop loss point is set at 30-50 PIPS Or the front hi
Currency Strength Wizard é um indicador muito poderoso que fornece uma solução completa para uma negociação bem-sucedida. O indicador calcula o poder deste ou daquele par forex usando os dados de todas as moedas em vários intervalos de tempo. Esses dados são representados em uma forma de índice de moeda fácil de usar e linhas de energia de moeda que você pode usar para ver o poder desta ou daquela moeda. Tudo o que você precisa é anexar o indicador ao gráfico que deseja negociar e o indicador mo
GOLD Impulse with Alert
Bernhard Schweigert
4.64 (11)
Este indicador é uma super combinação dos nossos 2 produtos Advanced Currency IMPULSE with ALERT  +   Currency Strength Exotics . Funciona para todos os períodos de tempo e mostra graficamente impulso de força ou fraqueza para as 8 principais moedas mais um Símbolo! Este Indicador é especializado para mostrar a aceleração da força da moeda para quaisquer símbolos como Ouro, Pares Exóticos, Commodities, Índices ou Futuros. É o primeiro do seu género, qualquer símbolo pode ser adicionado à 9ª
Trend Lines PRO
Roman Podpora
5 (1)
LINHAS DE TENDÊNCIA PRO       Ajuda a entender onde o mercado está realmente mudando de direção. O indicador mostra inversões de tendência reais e pontos onde os principais participantes retornam ao mercado. Você vê     Linhas BOS     Análise de tendências e níveis-chave em prazos maiores — sem configurações complexas ou ruídos desnecessários. Os sinais não são repintados e permanecem no gráfico após o fechamento da barra. VERSÃO MT 5      -      Revela seu potencial máximo quando emparelhada co
Volatility Trend System - um sistema de negociação que dá sinais para entradas. O sistema de volatilidade fornece sinais lineares e pontuais na direção da tendência, bem como sinais para sair dela, sem redesenho e atrasos. O indicador de tendência monitora a direção da tendência de médio prazo, mostra a direção e sua mudança. O indicador de sinal é baseado em mudanças na volatilidade e mostra entradas no mercado. O indicador está equipado com vários tipos de alertas. Pode ser aplicado a vários i
Advanced Supply Demand
Bernhard Schweigert
4.91 (299)
Atualmente com 40% de desconto! A melhor solução para qualquer Trader Novato ou especialista! Este indicador é uma ferramenta de negociação exclusiva, de alta qualidade e acessível porque incorporamos uma série de recursos proprietários e uma nova fórmula. Com esta atualização, você poderá mostrar fusos horários duplos. Você não só será capaz de mostrar um TF mais alto, mas também mostrar ambos, o TF do gráfico, MAIS o TF mais alto: MOSTRANDO ZONAS ANINHADAS. Todos os traders de Oferta e Demanda
Currency Strength Exotics
Bernhard Schweigert
4.88 (33)
ACTUALMENTE 20% DE DESCONTO ! A melhor solução para qualquer novato ou comerciante especializado! Este Indicador é especializado para mostrar a força da moeda para quaisquer símbolos como Pares Exóticos de Commodities, Índices ou Futuros. É o primeiro do seu género, qualquer símbolo pode ser adicionado à 9ª linha para mostrar a verdadeira força da moeda de Ouro, Prata, Petróleo, DAX, US30, MXN, TRY, CNH etc. Esta é uma ferramenta de negociação única, de alta qualidade e acessível, porque inco
Looking for a powerful yet lightweight swing detector that accurately identifies market structure turning points? Want clear, reliable buy and sell signals that work across any timeframe and any instrument? Buy Sell Arrow MT Swing is built exactly for that — precision swing detection made simple and effective. This indicator identifies Higher Highs (HH) , Higher Lows (HL) , Lower Highs (LH) , and Lower Lows (LL) with remarkable clarity. It is designed to help traders easily visualize market stru
Actualmente 40% OFF ! A melhor solução para qualquer novato ou comerciante especializado! Este software de painel de instrumentos está a funcionar em 28 pares de moedas. É baseado em 2 dos nossos principais indicadores (Advanced Currency Strength 28 e Advanced Currency Impulse). Dá uma grande visão geral de todo o mercado Forex. Mostra valores avançados de força da moeda, velocidade de movimento da moeda e sinais para 28 pares de divisas em todos os (9) períodos de tempo. Imagine como a sua n
FX Volume
Daniel Stein
4.63 (38)
FX Volume: Vivencie o Verdadeiro Sentimento de Mercado sob a Perspectiva de um Corretor Visão Geral Rápida Quer aprimorar sua abordagem de trading? FX Volume fornece insights em tempo real sobre como traders de varejo e corretores estão posicionados—bem antes de relatórios atrasados como o COT. Seja para buscar ganhos consistentes ou simplesmente ter uma vantagem mais clara no mercado, FX Volume ajuda você a detectar grandes desequilíbrios, confirmar rompimentos e aperfeiçoar sua gestão de ris
Presenting one-of-a-kind Gann Indicator for XAUUSD IQ Gold Gann Levels is a non-repainting, precision tool designed exclusively for XAUUSD/Gold intraday trading. It uses W.D. Gann’s square root method to plot real-time support and resistance levels, helping traders spot high-probability entries with confidence and clarity. William Delbert Gann (W.D. Gann) was an exceptional market analyst whose trading technique was based on a complex blend of mathematics, geometry, astrology, and ancient calcul
Smart Sweep Sniper MT4
Vincent Georges David Ferrier
# Smart Sweep Sniper MT4 Version MT4 Midnight Pro Edition , specialized for scalping and day trading in Prop Firm, Available here PROTOCOL - Institutional Liquidity Grab & SMC available here ## The Institutional Edge — Detect Where Smart Money Acts, Enter When It Matters If you like it, leave a positive review to support its development. If you encounter a bug, let us know before posting a review. When you complete your challenge, share your certificate in the comments. Happy trading! Smart Sw
O sistema PRO Renko é um sistema de negociação altamente preciso especialmente concebido para a negociação de gráficos RENKO. Trata-se de um sistema universal que pode ser aplicado a vários instrumentos de negociação. O sistema neutraliza eficazmente o chamado ruído de mercado, dando-lhe acesso a sinais de inversão precisos. O indicador é muito fácil de usar e tem apenas um parâmetro responsável pela geração de sinal. Você pode facilmente adaptar a ferramenta a qualquer instrumento de negocia
Atomic Analyst
Issam Kassas
5 (3)
Primeiramente, vale ressaltar que este Indicador de Negociação não repinta, não redesenha e não apresenta atrasos, tornando-o ideal tanto para negociação manual quanto automatizada. Manual do utilizador: configurações, entradas e estratégia. O Analista Atômico é um Indicador de Ação de Preço PA que utiliza a força e o momentum do preço para encontrar uma vantagem melhor no mercado. Equipado com filtros avançados que ajudam a remover ruídos e sinais falsos, e aumentam o potencial de negociação.
El indicador "MR BEAST ALERTAS DE LIQUIDEZ" es una herramienta avanzada diseñada para proporcionar señales y alertas sobre la liquidez del mercado basándose en una serie de indicadores técnicos y análisis de tendencias. Ideal para traders que buscan oportunidades de trading en función de la dinámica de precios y los niveles de volatilidad, este indicador ofrece una visualización clara y detallada en la ventana del gráfico de MetaTrader. Características Principales: Canal ATR Adaptativo: Calcula
IQ FX Gann Levels a precision trading indicator based on W.D. Gann’s square root methods . It plots real-time, non-repainting support and resistance levels to help traders confidently spot intraday and scalping opportunities with high accuracy. William Delbert Gann (W.D. Gann) was an exceptional market analyst, whose trading technique was based on a complex blend of mathematics, geometry, astrology, and ancient mathematics which proved to be extremely accurate. Setup & Guide:  Download  MT5 Ver
FX Power MT4 NG
Daniel Stein
4.95 (21)
FX Power: Analise a Força das Moedas para Decisões de Negociação Mais Inteligentes Visão Geral FX Power é a sua ferramenta essencial para compreender a força real das principais moedas e do ouro em quaisquer condições de mercado. Identificando moedas fortes para comprar e fracas para vender, FX Power simplifica as decisões de negociação e revela oportunidades de alta probabilidade. Quer você prefira seguir tendências ou antecipar reversões usando valores extremos de Delta, esta ferramenta adap
Step into the world of Forex trading with confidence, clarity, and precision using   Gold Indicator   a next-generation tool engineered to take your trading performance to the next level. Whether you’re a seasoned professional or just beginning your journey in the currency markets, Gold Indicator equips you with powerful insights and help you trade smarter, not harder. Built on the proven synergy of three advanced indicators, Gold Indicator focuses exclusively on medium and long-term trends eli
Introduction Harmonic Patterns are best used to predict potential turning point. Traditionally, Harmonic Pattern was identified manually connecting peaks and troughs points in the chart. Manual harmonic pattern detection is painfully tedious and not suitable for everyone. You are often exposed under subjective pattern identification with manual pattern detection. To avoid these limitations, Harmonic Pattern Plus was designed to automate your harmonic pattern detection process. The functionality
Pips Stalker
Abdulkarim Karazon
5 (2)
O Pips Stalker é um indicador de seta longa e curta, o indicador ajuda traders de todos os níveis a tomarem melhores decisões ao negociar no mercado, nunca repinta e usa o RSI como lógica principal do sinal; uma vez que uma seta é aplicada, ela nunca repinta ou repinta e as setas não são atrasadas. RECURSOS DA SETA PIPS STALKER : PAINEL DE ESTATÍSTICAS Um painel de informações único que mostra a % geral de taxa de vitória e estatísticas úteis como o máximo de vitórias e derrotas em trocas seg
CRT Multi-Timeframe Market Structure & Liquidity Sweep Indicator Non-Repainting | Multi-Asset | MT5 Version Available MT5 Version:   https://www.mql5.com/en/market/product/162075 Full User Guide — explains what each feature does and why:   https://www.mql5.com/en/blogs/post/767525 Quick Start User Guide  — explains how to configure and in what order:  https://www.mql5.com/en/blogs/post/767540 Indicator Overview CRT Ghost Candle HTF Fractal is a complete institutional-grade market structure too
Meravith
Ivan Stefanov
5 (3)
Ferramenta dos market makers. O Meravith irá: Analisar todos os timeframes e exibir a tendência atual em vigor. Destacar zonas de liquidez (equilíbrio de volume) onde o volume comprador e vendedor é igual. Mostrar todos os níveis de liquidez de diferentes timeframes diretamente no seu gráfico. Gerar e apresentar análise de mercado em formato de texto para sua referência. Calcular alvos, níveis de suporte e pontos de stop-loss com base na tendência atual. Calcular a relação risco/retorno das sua
Trend indicator AI
Ramil Minniakhmetov
4.53 (83)
O indicador Trend Ai é uma ótima ferramenta que irá melhorar a análise de mercado de um trader, combinando a identificação de tendências com pontos de entrada acionáveis e alertas de reversão. Este indicador permite que os usuários naveguem pelas complexidades do mercado forex com confiança e precisão Além dos sinais primários, o indicador Trend Ai identifica pontos de entrada secundários que surgem durante retrações ou retrações, permitindo que os comerciantes capitalizem as correções de preço
System Trend Pro
Aleksandr Makarov
5 (2)
System Trend Pro - This is the best trend trading indicator!!! The indicator no repaint!!!  The indicator has   MTF   mode, which adds confidence to trading on the trend (   no repaint   ). How to trade? Everything is very simple, we wait for the first signal (big arrow), then wait for the second signal (small arrow) and enter the market in the direction of the arrow. (See screens 1 and 2.) Exit on the opposite signal or take 20-30 pips, close half of it, and keep the rest until the opposite
No Repaint Bext is a ready-made trading system. Shows when to open and when to close trades, as well as in which direction. Every time a green arrow appears, you need to open a buy trade. Close all buy trades when a red arrow appears. The same goes for the opposite direction, every time a red arrow appears, open sell trades and close them all when a green arrow appears. We use the M5 timeframe for trading. You can trade on any cozy pair. This indicator does not repaint and practically does not
Mais do autor
Indicator of vertical lines on the timeframes М5 and М1. It draws the lines for the period of the current day and the previous day. This indicator visualizes visually shows the trader the beginning and end of the chart hour, as well as the past hourly periods, 30-minute and 5-minute chart intervals. The advantage provided by this indicator is that the trader using this indicator on a chart of a currency pair with the smaller timeframe will always be aware of when the new hour begins. On the con
FREE
Opening Candle Time
Alexander Shienkov
5 (1)
A simple information indicator showing the time left before the opening of the next candlestick or bar. About the concept of a timeframe A timeframe is the time interval considered in the technical analysis of free financial markets (the same applies to the global currency market), during which the price and other market data change. The smallest timeframe is the so-called tick. A timeframe is the time interval used to group quotes when drawing elements of a price chart (bars, Japanese candlest
FREE
EMA Above Below Bid price Технический индикатор в помощь трейдеру. Данный индикатор, показывает расположение пяти ЕМА,  пяти средних скользящих, относительно цены формирующей японские свечи или бары (цена Bid ). О понятии ЕМА. Скользящая средняя (moving average, MA)  — это дополнительная линия на графике цены актива.  Внешне она повторяет график цены, но с небольшим запозданием и более гладко, без колебаний. Основные характеристики: 1.     Показывает тренды. Если скользящая устремлена ввер
FREE
Spread and Cost pips
Alexander Shienkov
5 (2)
It is another simple information indicator. This indicator shows the current spread of a financial instrument and the value of one point with a volume of 0.10 lot. About the Spread Spread is the difference between the Ask and the Bid price of an asset in the stock or currency exchange. Let's refer to Central Banks and currency exchange in these banks, in order to understand why Spread is so important in currency trading. In Central Banks, we always see the difference between the buying and the
FREE
Today is the Day
Alexander Shienkov
5 (3)
This simple information indicator shows the name of the current day and past working days, months and years. On the concept of time and timeframe It is common knowledge that a timeframe is a time interval considered in technical analysis of free financial markets, during which the price and other market data changes occur when the price charts are plotted. In the MetaTrader 4 trading terminal, these periods are separated by vertical dashed line, which can be enabled or disabled by simply pressi
FREE
High and Low Levels EMA Технический индикатор в помощь трейдеру. Однажды пришла идея при изучении индикатора Moving A verage ( MA ). Так как мувинги эти сглаженное, среднее значения цены за выбранный период, то как и у обычной цены и у мувинга должны быть «хаи и лои». Данный индикатор, показывает уровни High и Low . Динамических уровней поддержки и сопротивления. О понятии High и Low . Хай  — от английского  high  — обозначает наиболее высокую цену («рынок на  хаях » — капитализация актив
FREE
ATR info panel
Alexander Shienkov
5 (1)
Индикатор таблица, постоянно меняющихся значений, пройденных ценой пунктов от начало дня (D1) , от начала недели (W1) и от начала текущего месяца (MN) . Индикатор также показывает средний дневной АТР за выбранный период. Параметры всей таблицы регулируются. Перемещение по осям монитора, для расположения в удобном месте, цвета текстов и заполнений ячеек, размеры столбцов, строк, цифр и текстов. Пользоваться можно на белом и тёмном фоне. По индикатору трейдер может легко определить настроение на р
An indicator of round levels. A range of important price levels with sound and text alerts, which are generated when the current Bid price of a currency pair is equal to a round number. This indicator visually shows the trader true support and resistance levels, which are used by most of traders and trading robots. The advantage provided by this indicator is that the trader using this indicator on a chart does not need to draw any additional levels. Round price levels represent a certain barrier
Doji Marker Point
Alexander Shienkov
This indicator shows the levels and signal dots of the Doji pattern. The indicator allows traders to easily determine possible location of a price rebound. Doji is a candlestick with Open and Close price equal, or almost equal. It should also have shadows of approximately the same size on both sides. Doji denotes the balance between buyers and sellers, or the absence of major players, or level testing. This pattern can mean both a reversal and a continuation of the trend. Indicator Parameters I
This indicator visualizes the intersection of two moving averages. (SМА, EMA, SMMA, LWMA). It has been created for visibility of signals and notification about intersections of Moving Average. Moving Average is simply the averaged value of the price for the selected timeframe (TF). Therefore, the moving averages are used on a wide variety of timeframes, from 1 minute to a year and even decades. Possible types of moving averages in the indicator SMA (Simple Moving Average); EMA (Exponential Movi
This indicator visualizes the intersection of two moving averages in the MACD oscillator. It uses the histogram color to signal about the moving averages crossing the zero level of the indicator. The MACD (Moving Average Convergence/Divergence) indicator is a popular oscillator actively used by traders when working in the currency and stock markets to determine trends and to search for trading signals. This linear indicator allows obtaining a variety of trading signals: crossing the zero line; d
Folding meter 4 Trend Lines
Alexander Shienkov
4.5 (2)
Folding rule of 4 trend lines The indicator has been created based on the "Folding rule" trading strategy. It shows four pairs of inclined resistance and support lines. These lines are plotted based on the nearest High and Low of the ZigZag technical indicator with four given input parameters. The indicator draws dots above and below the price extremums that have been used for plotting the trend lines. The indicator of trend lines facilitates the plotting of trend lines, channels and technical p
Kiss III EMA
Alexander Shienkov
Индикатор динамического уровня сопротивления и поддержки Moving Average. Визуально показывает момент прикосновение цены Bid , одной или трёх скользящих средних с   заданными во входных параметрах свойствами. Создан для наглядности сигналов и оповещения состоявшегося пересечения (прикосновения) цены Bid и Moving Average. Скользящая средняя — это просто усредненное значение цены за выбранный период времени, он же таймфрейм (ТФ). Именно поэтому скользящие используются на самых разнообразных ТФ,
Open High Low Close Внешняя Свеча Индикатор внешних свечей наложенных на график с выбранными вами тайм фреймом. Наглядно отображаете уровни OHLC и пройденное значение ATR текущей свечи и свечей в истории. OHLC — аббревиатура, дословно расшифровывается как: O — open (цена открытия интервала (бара или японской свечи)). H — high (максимум цены интервала). L — low (минимум цены интервала). C — close (цена закрытия интервала). Данный индикатор наглядно покажет трейдеру, уровень открытия, закрыт
ATR Sessions Pips
Alexander Shienkov
Ещё один простой информационный индикатор, показывающий самые важные торговые сессии валютного рынка. О понятии торговых сессий. Всем известно, что торговая сессия – это промежуток времени, в течение которого банки и другие участники рынка ведут активную торговлю, при этом активизируются   в определённые часы рабочего дня. Валютный рынок, рынки акций и сырьевые рынки   работают круглосуточно с понедельника по пятницу, кроме праздничных дней. Когда в одной стране ещё спят, в другой рабочий ден
Risk Manager VT
Alexander Shienkov
Risk Manager VT Робот - помощник, от команды VT. О рискменеджменте в торговле: Грамотный риск менеджмент в трейдинге – это залог успеха при решении основных Ваших задач, при активной ручной торговле, на биржевом рынке: дисциплина и контроль эмоций! Данный помощник поможет вам с лёгкостью ограничивать риски на каждую сделку, и правильно выставить уровни прибылей. Те кто долго торгуют, на валютном рынке, уже знают, что правильное соотношение риск/прибыль, является эффективным инструментом в
Open Day and ATR
Alexander Shienkov
Информационный индикатор, показывающий самые важные торговые уровни для внутридневной торговли, и не только. О понятии уровней «Поддержка» и «Сопротивление». Всем известно, что исторический ценовой диапазон цен состоит из уровней от которых в прошлом, были значимые движения. И уровни работающие в прошлом, наверняка будут работать и сейчас. К примеру, уровень, находящийся снизу текущей цены является уровнем «Поддержки», если от него ранее было значительное движение. К примеру, уровень, нах
History VT
Alexander Shienkov
History VT Информационный индикатор. Показывает на графике, сразу после открытия сделки, стрелку именно на той японской свече, где позиция открыта. То есть там, где появилась штрихпунктирная линия открытой сделки, в терминале. Далее, после открытия сделки, как обычно, трейдер ставит SL и TP  и ждёт итога своего выбора направления движения. После того как сделка закрылась, по « sl » или « tp » или «вручную», индикатор отображает на графике уровни и текстовые сноски параметров сделки. Сноски
Auto Multi Channels VT Ещё один технический индикатор в помощь трейдеру. Данный индикатор, автоматически показывает, наклонные каналы в восходящем, нисходящем и боковом движении цены, т.е. тренды. (Внутри дня. Среднесрочные и долгосрочные, а также Восходящие, нисходящие и боковые). О понятии Тренд. На бирже, трендом называется  направленное движение ценового графика в одну из сторон (вверх или вниз) . То есть, тренд в трейдинге — это ситуация, когда цена определенное время возрастает или сниж
Old Time Frame EMA   Индикатор двух динамических уровней сопротивления и поддержки Moving Average. Данный индикатор рисует на открытом графике младшего тайм фрейма, ЕМА со старшего тайм фрейма.   Создан для наглядности сигналов, для входа в рынок, для тех трейдеров, у кого Средние Скользящие Цены (ЕМА или МА), являются основным сигналом для открытия или закрытия сделок. А также ориентиром, направлением тренда в движении текущих цен, внутри дня и в среднесрочной торговле. Возможные типы сред
Filtro:
Sem comentários
Responder ao comentário