Smart Adaptive Trend Flow MT4

Smart Adaptive Trend Flow MT4

Professional adaptive trend, market structure, price levels and flow analysis indicator for MetaTrader 4.

Would you like to test it before purchasing? Request a fully functional trial version by sending us a private message through MQL5.com and evaluate the indicator directly on your own charts.

A Complete Market View

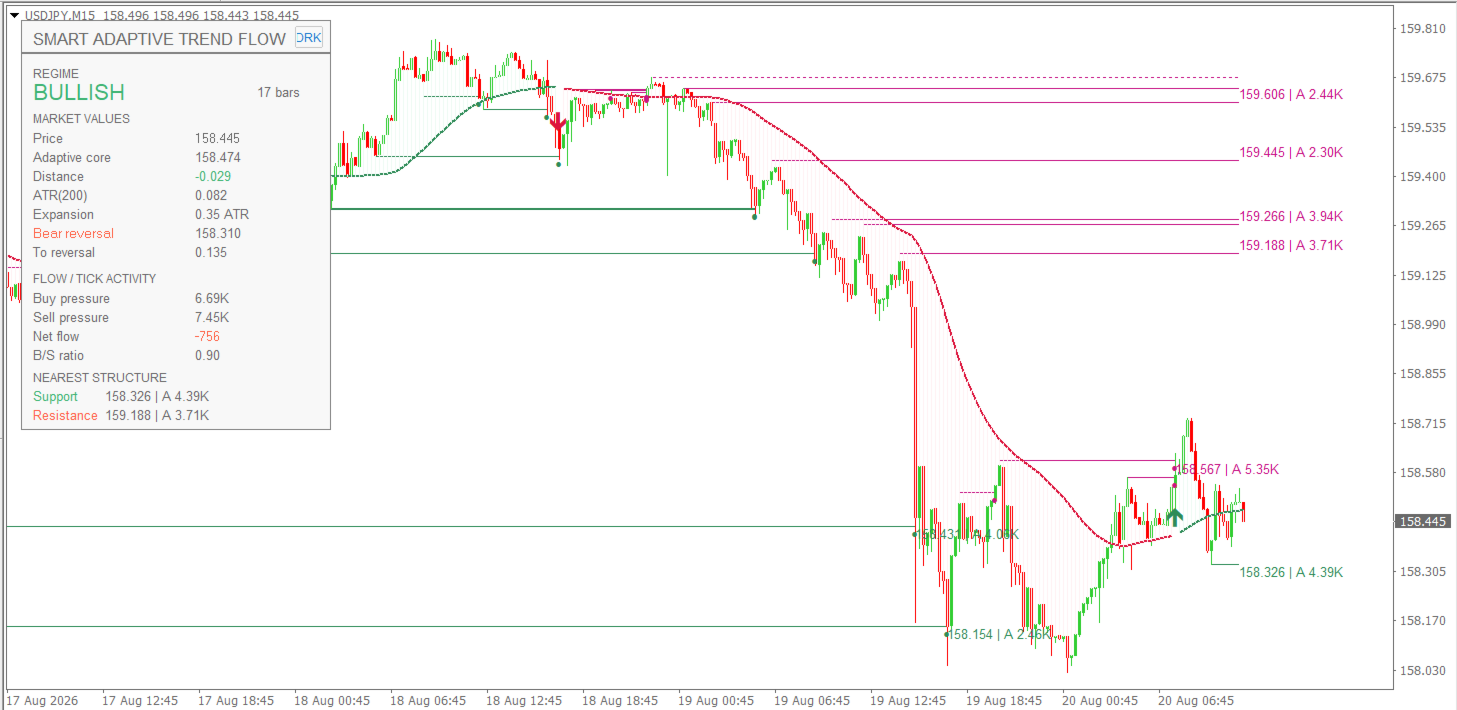
Smart Adaptive Trend Flow MT4 combines several analytical components in a single indicator:

  • Adaptive trend analysis.
  • BULLISH and BEARISH market regimes.
  • Trend-change arrows.
  • Automatic market structure.
  • Dynamic support and resistance.
  • Activity associated with structural levels.
  • Buy/Sell Pressure and Net Flow.
  • Volatility and price expansion.
  • Potential reversal levels.
  • Integrated analysis dashboard.

The objective is to display trend, structure, volatility and market activity within the same visual context, reducing the need to combine multiple separate indicators.

Adaptive Trend Engine

The indicator uses an adaptive trend engine that adjusts its response according to market conditions and price behavior.

Unlike a conventional moving average with a fixed response, the adaptive core evolves with the market. A volatility filter also helps prevent small fluctuations around the central line from being automatically interpreted as trend changes.

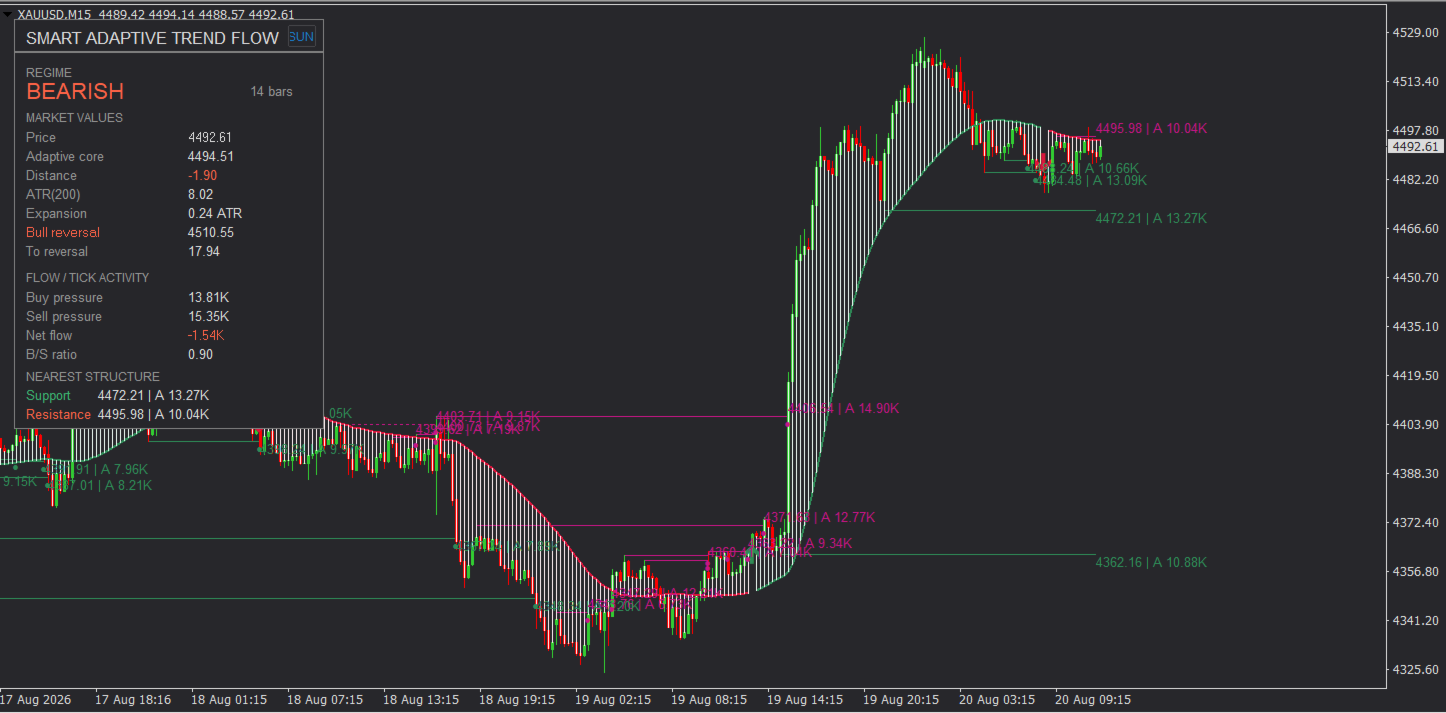
The chart clearly distinguishes:

Green: Bullish regime.
Red: Bearish regime.

The adaptive line and trend area provide an immediate visual representation of the prevailing market regime.

Trend-Change Arrows

When a transition between bullish and bearish regimes is confirmed, the indicator plots an arrow directly on the chart.

A bullish arrow identifies the confirmation of a new bullish regime, while a bearish arrow identifies the confirmation of a new bearish regime.

Regime changes are confirmed using closed candles. Once confirmed, historical transitions remain stable.

The arrows represent changes detected by the trend engine and should not be interpreted by themselves as automatic Buy or Sell orders.

Automatic Market Structure

Smart Adaptive Trend Flow also analyzes price structure and automatically identifies relevant confirmed pivots.

From these structures, the indicator generates horizontal levels that can highlight:

  • Structural support.
  • Structural resistance.
  • Relevant highs and lows.
  • Unresolved structures.
  • Levels subsequently reached or swept by price.

There is no need to draw these areas manually. The indicator creates and manages structural levels automatically as the market evolves.

The user can also choose whether previously swept historical levels remain visible.

Price and Activity Values

Each structural level can display its exact price and the activity recorded around its formation.

For example:

158.420 | A 24.70K

The first value represents the structural price and A represents Activity.

Values are automatically displayed as:

K = thousands
M = millions

Activity is calculated using tick activity supplied by the broker around the formation of the structure.

Therefore, it does not represent pending orders or actual resting liquidity at that price.

Flow Analysis

The indicator includes a directional activity analysis module.

During each market regime, it analyzes tick activity together with price behavior to estimate:

Buy Pressure — activity associated with buying pressure.
Sell Pressure — activity associated with selling pressure.
Net Flow — difference between both values.
B/S Ratio — relationship between Buy Pressure and Sell Pressure.

For example, a B/S Ratio above 1 means that the activity estimated as buying pressure is greater than the estimated selling activity during the analyzed period.

Smart Adaptive Trend Flow displays these calculated values directly without converting them into artificial probability or confidence percentages.

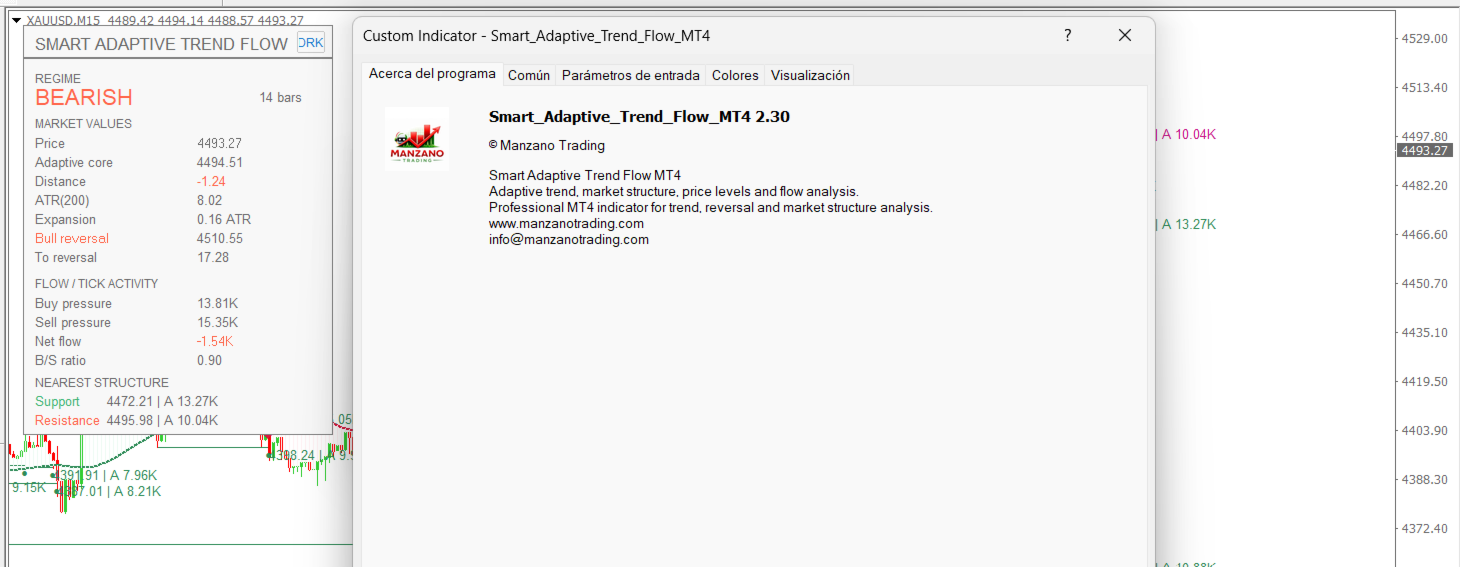
Analysis Dashboard

The integrated dashboard concentrates the main information calculated by the indicator.

REGIME

Displays:

BULLISH / BEARISH

together with the number of bars for which the current regime has remained active.

This makes it easy to distinguish between a recent transition and a trend that has already been developing for a longer period.

MARKET VALUES

Price
Current market price.

Adaptive Core
Dynamic reference generated by the adaptive engine.

Distance
Actual distance between price and the Adaptive Core.

ATR
Current volatility value used by the system.

Expansion
Distance between price and the adaptive core expressed in ATR units.

For example:

Expansion: 1.35 ATR

means that price is approximately 1.35 ATR away from its adaptive reference. It is a measurement of distance and volatility, not a probability.

Reversal Level

The dashboard also displays:

Bear Reversal or Bull Reversal

depending on the active regime.

This provides a specific price level associated with a potential transition from the current market regime.

To Reversal displays the distance between the current market price and that level.

This allows the trader to see the current direction, the potential transition level and the distance remaining to reach it.

Nearest Structure

The dashboard automatically identifies the nearest unresolved structures:

Support
Resistance

together with their exact price and Activity.

Example:

Support: 158.420 | A 24.70K

This provides immediate access to nearby structural levels without having to manually locate them among all the horizontal lines on the chart.

Main Features

  • Adaptive Trend Engine.
  • Automatic BULLISH/BEARISH regimes.
  • Trend-change arrows.
  • Closed-candle confirmation.
  • Dynamic trend line and visual trend area.
  • Automatic market structure detection.
  • Structural support and resistance.
  • Unresolved and swept levels.
  • Price + Activity for structural levels.
  • Buy Pressure and Sell Pressure.
  • Net Flow and B/S Ratio.
  • ATR and Expansion.
  • Bull/Bear Reversal Level.
  • Distance to Reversal.
  • Nearest Support/Resistance.
  • Integrated dashboard.
  • Light and dark themes.
  • Customizable colors and visualization.
  • Designed for MetaTrader 4.

Markets and Timeframes

Smart Adaptive Trend Flow MT4 can be used with different instruments available in MetaTrader 4, including:

Forex, Gold and other metals, indices, CFDs and other instruments supported by your broker.

It can be used on different timeframes according to the trader's preferred type of analysis.

Volatility and especially tick activity can vary between instruments and brokers. For this reason, Flow and Activity values should always be interpreted within the context of the symbol and data provider being used.

How to Use It

The indicator does not impose a specific trading strategy. Its different components can be combined, for example, as:

Trend → Expansion → Flow → Structure → Reversal

A trader can first identify the prevailing regime, analyze expansion relative to the Adaptive Core, evaluate directional activity and then locate relevant structural and reversal levels.

It can also be used as a trend filter, market structure tool, support/resistance reference or additional confirmation tool within an existing strategy.

Customization

The user can configure different aspects of the indicator, including:

  • Trend sensitivity.
  • Structure history.
  • Maximum number of levels.
  • Swept-level visualization.
  • Price and Activity labels.
  • Buy/Sell Ratio.
  • Dashboard position.
  • Trend and structure colors.
  • Visual trend fill.
  • Light/dark theme.
  • Candle colors.

Fully Functional Trial

Would you like to test it on your own charts before purchasing?

Request a fully functional trial version of Smart Adaptive Trend Flow MT4 by sending us a private message through MQL5.com.

You can evaluate its behavior and analysis tools before making a purchase decision.

Important Information

Smart Adaptive Trend Flow MT4 is a technical analysis tool. It is not an Expert Advisor and does not automatically open, modify or close trades.

Trend-change arrows, market regimes, structural levels, reversal levels, Activity, Buy/Sell Pressure, Net Flow and other information displayed by the indicator do not constitute financial advice and do not guarantee future price movements.

Activity and Flow values use tick data supplied by the broker and do not represent centralized volume, institutional orders, actual resting liquidity or order-book information.

The indicator does not promise or guarantee profits, profitability, win rate or future results. Historical behavior does not guarantee future performance.

Trading involves risk, and all trading and risk-management decisions remain the sole responsibility of the user.

Produtos recomendados
ComplexPulse - pulse indicator or signal. Sensitive and responsive to price movements. The indicator shows the interdependence of various currency pairs, namely: USD, EUR, GBP, CHF, JPY. Currencies are measured in relative units, so in each unit of time the sum of all currencies will be equal to zero. Hence, one of the main elements of cluster indicators is the zero line, or the balance line (zero line). If a currency is below the balance line, then it is said that the currency is oversold rela
Scalping Strategy Having a strategy in the market is one of the main conditions for trading. The presence of various and complicated indicators and tools sometimes makes trading difficult, and the user gets confused after trying various methods and gets stuck in a loss cycle, the result of which is usually clear. This indicator is a simple strategy based on the detection of pivots and short-term trends, which helps you to easily trade in trends. Sometimes a simple but efficient strategy has a be
MyZtrade Margin Zones (NKZ) The indicator shows on the chart the zones where major players — market makers and central banks — concentrate their activity, as well as key price levels derived from extremes. **Zones:** - market maker / central bank percentage zones - **5%, 10%, 15%, 20%, 25%** and fine 0.5%…5%; - NKZ zones from highs and lows - 1/4, 1/2, 3/4, 100%, 200%; - ATR zones of higher timeframes (H4, D1, W1, MN). **Features:** - automatic zone building from the latest price extremes; -
Kill Zones MT4
Diego Arribas Lopez
MT5 Version Kill Zones Kill Zones allows you to insert up to 3 time zones in the chart. The visual representation of the Kill Zones in the chart together with an alert and notification system helps you to ignore fake trading setups occurring outside the Kill Zones or specific trading sessions. Using Kill Zones in your trading will help you filter higher probability trading setups. You should select time ranges where the market usually reacts with high volatility. Based on EST time zone, followin
Currency Strength Meter for MetaTrader 4 combina os 28 pares das 8 principais moedas (USD, EUR, JPY, GBP, AUD, NZD, CAD, CHF) em uma linha de força por moeda, com uma tabela de ranking para o timeframe do gráfico, M15, H1, H4 e D1. A fórmula completa está publicada abaixo. É indicado para traders de MT4 que comparam moedas antes de escolher qual par observar e que querem saber exatamente como os números são gerados. É um auxílio de análise: não diz quando comprar ou vender e não mostra o movime
With Fixed Range Volume Profile,The traces left by the big players will not go unnoticed by you. Professional   Volume Profile   Indicator reveals Institutional order flow. This advanced market indicator will teach you to spot the buying and selling. Dont want to say more because its well known by most professionals  trader. This Indicator : -  Quickly Identify the Strongest Institutional S/R Zones. - W orks with all Trading Instruments (Forex, Futures, Indexes, Commodities, Stocks, Cryptocur
AZ AI Trend Core Pro
Shahrull Hissham Bin Saad
AZ AI Core Pro Indicator Overview AZ AI Core Pro Indicator is a smart trading analysis tool designed to help traders identify potential market opportunities through trend analysis, multi-timeframe confirmation, support and resistance zones, AI-based filtering, and early signal detection. The indicator combines multiple analytical layers into a single visual system, allowing traders to identify BUY and SELL opportunities with greater confidence while reducing unnecessary market noise. Suitable fo
Strong Pairs
Angelico Jurado
5 (1)
This indicator calculates the strength of the major currencies (EUR, USD, CAD, GBP, CHF, NZD, USD, JPY) and shows the top 4 strongest currency pairs that are currently in a high probability trend for the day or for the week. Usage The indicator displays 8 currency pairs with a trend direction (e.g. "EURUSD-DOWN") and ranked according to strength, with 1 being ths strongest. There will be 4 pairs for intraday and 4 pairs for intraweek If a currency pair is present in the top 4 intraday, it is in
TrendForge+ | EURJPY H4 Swing Trading Expert Advisor A rules-based Forex swing trading system for MetaTrader 4. Built around disciplined entries, fixed position sizing and transparent historical testing. Most Expert Advisors ask you to trust them. TrendForge+ asks you to check the evidence. Rather than relying on marketing promises, TrendForge+ provides three complete MetaTrader Strategy Tester reports, covering 26 years of historical market data and more recent trading conditions. You can exami
Undefeated Triangle MT4
Nauris Zukas
4.56 (9)
Descrição Este produto foi criado como parte do projeto "PULSE OF MARKET" . O EA "Undefeated Triangle" trabalha com a interação de preços entre as moedas AUD, CAD e NZD. Com base em observações, esses pares frequentemente apresentam movimentos correlacionados, onde o preço pode retornar após movimentos fortes. Isso permite o uso de uma abordagem de grid para gerenciar posições. O EA utiliza 3 pares: AUDCAD, AUDNZD e NZDCAD. Versão MT5 Vantagens Preço mais baixo em comparação com produtos similar
DoIt EA Monitor - Multi EA Performance Dashboard for MT5 Your account can be profitable while one EA quietly drags down the portfolio. MetaTrader history shows the combined result, but it does not clearly show which strategy deserves more capital and which one needs attention. DoIt EA Monitor runs on one chart and separates live and historical performance by magic number, EA and symbol. It is completely read-only. It never opens, closes or modifies a trade. KNOW WHICH EA IS EARNING ITS PLACE Aut
FREE
QQE Mod MT4
Filip Valkovic
The   Quantitative Qualitative Estimation   (QQE) indicator is derived from Wilder’s famous Relative Strength Index (RSI). In essence, the QQE is a heavily smoothed RSI. Modification of this version: (   converted from tradingview   script by Mihkell00, original from Glaz, 100% identical output) So there are Two QQEs. One that is shown on the chart as columns, and the other "hidden" in the background which also has a 50 MA   bollinger band   acting as a zero line. When both of them agree - y
Trend New
Vitalii Zakharuk
Trend New Trend Indicator, shows the signals for entry. Displays both entry points and the trend itself. Shows statistically calculated moments for entering the market with arrows. When using the indicator, it is possible to optimally distribute the risk factor. Settings: Uses all one parameter for settings. Selecting a parameter, it is necessary to visually resemble it so that the appropriate graph has a projection of extremes. Options: Length - the number of bars for calculating the indica
Full Forex Market View Dashboard
Opengates Success International
5 (2)
Indicador de painel de visão de mercado FOREX COMPLETO Este é um indicador personalizado criado para dar aos Traders uma visão completa do que está acontecendo no mercado. Ele usa dados em tempo real para acessar o mercado e exibir todas as informações necessárias para fazer uma negociação bem-sucedida. INSTALAÇÃO: Antes de anexar este indicador ao seu gráfico de janela, vá para o painel Market Watch do seu MT4 e OCULTE todos os pares de moedas que você não precisa ou negocie e deixe o resto
Quantum Dynamic Volatility Indicator
QUANTUM TRADING SOFTWARE LIMITED
Have you ever wondered why so many Forex traders get trapped in weak positions on the wrong side of the market? One of the easiest ways the market makers do this, is by using volatility. A currency pair moves suddenly, often on a news release or economic data. Traders jump in, expecting some quick and easy profits, but the move suddenly moves in the opposite direction. This happens in all timeframes, and in all currency pairs. The candle or bar closes, with a wide spread, but then reverses sharp
New version 1.22. Partagas    The AG algorithm is an element of a comprehensive trading system for trading a basket of currencies across 8 major currencies across all 28 currency pairs. The algorithm serves as a signal block for determining entry/exit from a position. To collect initial values, AG uses data from the CSS Currency Slope Strength cluster indicator. This indicator was not chosen by chance - it performed very well during testing of the algorithm. A. AG determines the width of the e
FREE
UniTradeXpert
Tsz Fung Wong
Introducing UniTradeXpert: Your Ultimate Forex Program! Uncover the extraordinary potential of UniTradeXpert, a cutting-edge expert advisor meticulously crafted to enhance your forex trading experience. With nearly 7 years of comprehensive data analysis support , this EA provides a decisive edge in the fiercely competitive market with an astounding accuracy rate of 99.9% . UniTradeXpert excels in oscillation trading within the one-hour timeframe of the AUDCAD currency pair. This professional app
The Trend Professor is a moving average based indicator designed for the purpose of helping the community of traders to analyse the price trend. The indicator will be displayed in the main chart as it is indicated on the screenshot section. How it works The indicator has lines of moving averages and colored histograms to depict the direction of the trend. There will be a fast signal line colored blue/yellow/red at some points. The red/yellow colored lines stands for bearish trend/signal while th
The 4 headed dragon is an indicator that has two functions. 1) Set the background trend. 2) Mark the predominant trend. By combining these two indicator signals, we will be able to trade for or against the trend, adapting the signals to your reading of the market. You can download the demo and test it yourself. 1) Set the background trend.   Define four possibilities of trend that are the four heads of the dragon, marked by colors on the indicator, marking a) Powerful buying trend. b) Weak
The Pairs Cross indicator is a unique tool for negatively correlated trading instruments, such as EURUSD and USDCHF currency pairs. It is based on a concept called pairs trading (or spread trading). Our indicator compares the strength of two currency pairs that are inversely correlated and quickly tells you when it’s time to buy the first pair and short a second pair, and vice versa. This is a straightforward approach to trading currency pairs that works very well. How to you use the Pairs Cro
Super volumes
Yerzhan Satov
4 (1)
O indicador de seta para Forex e Opções Binárias é criado com base nos volumes de ticks. Ao contrário de muitos indicadores, o indicador "Super volumes" calcula volumes de alta e baixa e emite sinais sobre a predominância de qualquer um deles. Se digamos que, no momento, nesse intervalo, havia uma vantagem de volumes de alta, então o sinal estará em Buy. Ou se a predominância foi de volumes de baixa, então, respectivamente, o sinal será Sell. Nas configurações do indicador, na variável "volume
A technical indicator that displays information about the trading volume in the form of a histogram of distribution by price levels. It is used as an independent indicator that helps to evaluate the current objective situation of the instrument, as well as in the format of integration with other methods of analysis, to confirm or filter when making trading decisions. Key Features: Interactive profile update, real-time work Five modes of histogram calculation The possibility of separating the vol
Beat the market
Levi Kevin Midiwo
Do you want to beat the market? This indicator uses advanced mathematical formulae That include regression analysis to predict market trends. So what happens is  That when the price is above the indicator line as depicted in the screenshot The trend is rising and when the price is below the indicator line the Trend is falling. This opportunities appear multiple times each day enabling You to profit. This indicator makes the trend your friend.
Nasdaq Expansion M15
Marek Kupka
3.5 (2)
This EA has been developed, tested and traded live on NASDAQ M15 TF. Everything is ready for immediate use on real account. Very SIMPLE STRATEGY with only FEW PARAMETERS. Strategy is based on EXPANSION ON THE DAILY CHART. It enters if volatility raise after some time of consolidation. It uses STOP pending orders with ATR STOP LOSS. To catch the profits is a TRAILING PROFIT function in the strategy.  EA has been backtested on more than 10-year long tick data with 99% quality of modeling and verif
This is a fully automatic Expert Advisor. It can trade any market, any timeframe and any currency pair. The EA uses simple indicators like SMA, RSI and CCI, and a smart martingale system, that does not open systematical new positions, but waits for a new signal for each new order, wich is limiting drawdown compared to other martingale systems. It uses a combination of seven strategies you can select in the parameters to fit your needs. The strategy tester in MetaTrader 4 can give you the setup y
GridProfit
Hafis Mohamed Yacine
Grid Profit  Grid Profit EA Working with all pairs. TimeFrame - 5-15-30-1H Minimum Deposit Recommended : $1000 USD lot 0.01  Grid Profit EA  V 1.00  would probably come about in the event the volatility to your commodity begins to diminish. In the case some sort of examine benefits are generally in the beginning to travel sideways, that ATR profit would probably figure out how to drop off of. This can trigger that trailing terminate to travel in excess since examine benefits began to be way
Forex Matrix MT4
Thomas Bradley Butler
MT5 Version: https://www.mql5.com/en/market/product/124107 A Day in the Life of a Trader: Discovering the Forex Matrix Dashboard In the fast-paced world of forex trading, keeping track of multiple currency pairs can feel overwhelming. That’s where the   Forex Matrix Dashboard   comes in, making the life of a trader much easier. Imagine opening the dashboard and instantly seeing all your favorite currency pairs, like EUR/USD, GBP/USD, and USD/JPY, displayed clearly with their latest prices. No mo
Mr Pip Scalping Indicator is a momentum indicator that measures the magnitude of recent price changes to evaluate overbought or oversold conditions in the price of a stock or other asset with few major tweaks. This is NOT RSI. Features V2: Added Supply/Demand Filter You can select which zone to see on the chart ( Important Resistance/Support; Verified Resistance/Support; etc ).  You get alerts when prices is entering on a specific supply/demand zone. How to use? When the signal comes, you will
PipFinite Cluster Helix
Karlo Wilson Vendiola
5 (2)
A combination of trend, pullback, range breakouts and statistics in one indicator Mainly functions as an Entry indicator. Works in any pair and timeframe. Suggested Combination Cluster Helix with Strength Meter Strategy: Confirm signals with ideal strength levels Watch Video: (Click Here) Features Detects range breakouts on pullback zones in the direction of the trend Analyzes statistics of maximum profits and calculates possible targets for the next signal Flexible tool, can be used in many w
The indicator is the main part of Michael Huddleston's ICT (Inner Circle Trader) trading strategy. His legendary trading strategy is based on the concept of "Smart Money". To analyze the medium -term trend , the  ICT offers an analysis based on  twenty -day levels . The indicator builds levels , while showing the turning points with arrows . An important feature of the indicator is the automatic display of levels for different periods . You do not have to change the indicator settings when chang
Os compradores deste produto também adquirem
Currency Strength Wizard é um indicador muito poderoso que fornece uma solução completa para uma negociação bem-sucedida. O indicador calcula o poder deste ou daquele par forex usando os dados de todas as moedas em vários intervalos de tempo. Esses dados são representados em uma forma de índice de moeda fácil de usar e linhas de energia de moeda que você pode usar para ver o poder desta ou daquela moeda. Tudo o que você precisa é anexar o indicador ao gráfico que deseja negociar e o indicador mo
Trend SniperX MT4
Sarvarbek Abduvoxobov
5 (6)
Trend Sniper X é um indicador de tendência multitemporal para MetaTrader 5 que ajuda os traders a identificar a direção da tendência e potenciais pontos de reversão com clareza e precisão. Para MT5: https://www.mql5.com/en/market/product/181101 Informação de preço: O preço atual é promocional e está sujeito a alterações à medida que novas atualizações e recursos forem lançados. Canal Code2Profit Domine o Mercado com Análise Multitemporal! Como Maximizar sua Taxa de Acerto com o Trend Sniper X: R
Scalper Vault
Oleg Rodin
4.9 (41)
O Scalper Vault é um sistema de negociação poderoso e completo, projetado para traders que buscam consistência em operações intraday. Este indicador de alta precisão funciona como um sistema de negociação autônomo, oferecendo análises de nível institucional tanto para o mercado Forex quanto para Opções Binárias. ENTRE EM CONTATO COMIGO APÓS A COMPRA PARA RECEBER DICAS DE NEGOCIAÇÃO E UM BÔNUS EXCLUSIVO! Ao eliminar suposições e análises manuais complexas, o Scalper Vault permite que você foque
SIO Oscillator: oscilador auto-otimizável de desequilíbrio de semivariância Compre o indicador e receba GRÁTIS o Expert Advisor (EA) baseado nele. A maioria dos osciladores trata todo movimento de preço da mesma forma. O SIO separa a pressão de alta da pressão de baixa e mede o desequilíbrio entre elas, mostrando qual lado realmente controla o mercado: compradores ou vendedores. Quando o desequilíbrio atinge um extremo, o SIO gera um sinal claro com níveis de entrada, Stop Loss e Take Profit. O
Advanced Supply Demand
Bernhard Schweigert
4.91 (302)
Atualmente com 30% de desconto! A melhor solução para qualquer Trader Novato ou especialista! Este indicador é uma ferramenta de negociação exclusiva, de alta qualidade e acessível porque incorporamos uma série de recursos proprietários e uma nova fórmula. Com esta atualização, você poderá mostrar fusos horários duplos. Você não só será capaz de mostrar um TF mais alto, mas também mostrar ambos, o TF do gráfico, MAIS o TF mais alto: MOSTRANDO ZONAS ANINHADAS. Todos os traders de Oferta e Demanda
M1 Sniper
Oleg Rodin
4.97 (30)
O M1 SNIPER é um sistema indicador de negociação fácil de usar. É um indicador de seta projetado para o período M1. O indicador pode ser usado como um sistema independente para scalping no período M1 e pode ser usado como parte do seu sistema de negociação existente. Embora este sistema de negociação tenha sido projetado especificamente para negociação no M1, ele também pode ser usado em outros períodos. Originalmente, desenvolvi este método para negociar XAUUSD e BTCUSD. Mas considero-o útil ta
Non repaint MT4
Yan Zhen Du
5 (2)
This is a professional chart indicator designed for traders focused on stability and clear price action. It helps filter market noise and provides clear visual entry and exit zones for your trading decisions. Core Features: Strictly Non-Repainting: The system is built with strict non-repaint logic. What you see on the chart is the true historical performance. Confirmed Signals: Signals are triggered and confirmed only after the candle closes . Once a trading arrow appears on a closed candle, it
Gann Made Easy
Oleg Rodin
4.84 (174)
Gann Made Easy é um sistema de negociação Forex profissional e fácil de usar, baseado nos melhores princípios de negociação usando a teoria do sr. W. D. Gann. O indicador fornece sinais precisos de COMPRA e VENDA, incluindo níveis de Stop Loss e Take Profit. Você pode negociar mesmo em movimento usando notificações PUSH. Entre em contato comigo após a compra para receber instruções de negociação e ótimos indicadores extras gratuitamente! Provavelmente você já ouviu muitas vezes sobre os métodos
Actualmente 30% OFF ! A melhor solução para qualquer novato ou comerciante especializado! Este software de painel de instrumentos está a funcionar em 28 pares de moedas. É baseado em 2 dos nossos principais indicadores (Advanced Currency Strength 28 e Advanced Currency Impulse). Dá uma grande visão geral de todo o mercado Forex. Mostra valores avançados de força da moeda, velocidade de movimento da moeda e sinais para 28 pares de divisas em todos os (9) períodos de tempo. Imagine como a sua n
Apresentamos o ON Trade Waves Patterns Harmonic Elliot Wolfe, um indicador avançado projetado para detectar diversos tipos de padrões no mercado, usando métodos manuais e automáticos. Aqui está como ele funciona: Padrões Harmônicos: Este indicador pode identificar padrões harmônicos que aparecem em seu gráfico. Esses padrões são essenciais para traders que praticam a teoria de negociação harmônica, conforme popularizada no livro de Scott Carney "Harmonic Trading vol 1 e 2". Seja desenhando-os m
RFI levels PRO
Roman Podpora
5 (2)
O indicador mostra com precisão os pontos de reversão e as zonas de retorno de preço onde o   Principais players . Você identifica onde novas tendências estão se formando e toma decisões com máxima precisão, mantendo o controle sobre cada negociação. VERSION MT5     -     Revela seu potencial máximo quando combinado com o indicador   TREND LINES PRO. O que o indicador mostra: Estruturas de reversão e níveis de reversão com ativação no início de uma nova tendência. Exibição dos níveis de   TAKE
ShapeRadar - indicador de padrões gráficos clássicos O ShapeRadar encontra automaticamente no gráfico os padrões clássicos da análise técnica: topos e fundos duplos e triplos, Ombro-Cabeça-Ombro e sua versão invertida, cunhas ascendentes e descendentes, retângulos, triângulos, bandeiras e flâmulas. Quando o preço fecha além do limite de uma figura, o indicador desenha o padrão, o ponto de entrada, o nível de stop loss e o alvo, e um painel informativo resume todos os padrões detectados. Versão p
O sistema PRO Renko é um sistema de negociação altamente preciso especialmente concebido para a negociação de gráficos RENKO. Trata-se de um sistema universal que pode ser aplicado a vários instrumentos de negociação. O sistema neutraliza eficazmente o chamado ruído de mercado, dando-lhe acesso a sinais de inversão precisos. O indicador é muito fácil de usar e tem apenas um parâmetro responsável pela geração de sinal. Você pode facilmente adaptar a ferramenta a qualquer instrumento de negocia
SR Liquidity
Oleg Rodin
5 (2)
O SR Liquidity é um indicador de trading projetado para revelar as zonas ocultas onde a liquidez do mercado se concentra e o preço reage com maior intensidade. Essas áreas específicas de liquidez funcionam como níveis poderosos de suporte e resistência, oferecendo um mapa claro de onde é mais provável que o mercado reverta. Em vez de traçar linhas comuns de Suporte e Resistência, o SR Liquidity analisa o comportamento real dos preços para detectar as zonas onde se acumulam pressões de compra e v
Auto Optimized SpeedAngle é um sistema de vetorização de momentum de nível institucional que elimina o sobreajuste ( curve-fitting ) por meio da otimização contínua de avanço ( Walk-Forward Optimization , WFO). Em vez de depender de entradas estáticas que se degradam quando os regimes de mercado mudam, o indicador recalibra dinamicamente seus parâmetros utilizando validação fora de amostra ( Out-of-Sample , OOS), garantindo que os sinais exibidos representem vantagens estatísticas genuínas e não
Route Lines Prices
Vitalyi Belyh
3 (1)
O indicador Route Lines Prices - foi concebido para identificar a direção dos preços. A sua interface simples contém múltiplos algoritmos para calcular o comportamento dos preços e a direção futura. Estes algoritmos incluem cálculos de volatilidade e suavização de preços com base nos períodos de tempo utilizados. O indicador possui um único parâmetro para alterar o valor de " Calculating price values ". O valor padrão de 1 fornece um cálculo automático equilibrado, que pode ser utilizado sem ne
All in One package includes the  Oscillator Predictor ,  MACD Predictor ,  Thrust Scanner  and  Advanced Fibonacci  indicators which are mandatory for applying  Dinapoli  trade plans.  Please visit below links for detailed explanations of indicators. Advanced Fibonacci Indicator =>  https://www.mql5.com/en/market/product/52834 Thrust Scanner Indicator => https://www.mql5.com/en/market/product/52830 Overbought /Oversold Predictor indicator => https://www.mql5.com/en/market/product/52621 Macd P
AW Prime Oscillator
AW Trading Software Limited
5 (1)
Uma combinação de dois osciladores. O primeiro exibe os pontos de entrada, o segundo mostra a tendência atual. O indicador pode exibir sinais do oscilador por meio de setas em dois modos, todos os sinais do oscilador rápido ou sinais apenas na direção da tendência atual. Possui painel multi-timeframe e três tipos de notificações de sinal. Benefícios: Adequado para negociação diurna e de scalping Filtragem de tendências Configuração simples e sensível Painel multiperíodo Adequado para integração
Dark Support Resistance  is an Indicator for intraday trading. This Indicator is programmed to identify  Support and Resistance Lines , providing a high level of accuracy and reliability. Key benefits Easily visible lines Only the most important levels will be displayed Automated adjustment for each timeframe and instrument Easy to use even for beginners Never repaints, never backpaints, Not Lag 100% compatible with Expert Advisor development All types of alerts available: Pop-up, Email, Push
Super Signal – Skyblade Edition Sistema profissional de sinais de tendência sem repintar / sem atraso com taxa de acerto excepcional | Para MT4 / MT5 Funciona melhor em timeframes mais curtos, como 1 minuto, 5 minutos e 15 minutos. Principais características: Super Signal – Skyblade Edition é um sistema inteligente de sinais desenvolvido especificamente para operações com tendência. Utiliza uma lógica de filtragem em múltiplas camadas para detectar apenas movimentos direcionais fortes sustenta
Liked the logic of this tool? Explore the full ecosystem of professional indicators and utilities created by a trader for traders: All products by the author on MQL5 Market: https://www.mql5.com/en/users/musa1994/seller Details and trading philosophy: https://developer-mql4-mql5.netlify.app/ Professional Delta Volume MTF  is a professional indicator for MetaTrader 4 that shows the difference between buy and sell volume (Delta Volume) and Cumulative Delta. Version 2.0 introduces full
Este indicador examina a estrutura de preços de fractais de diferentes períodos para determinar possíveis pontos de reversão no mercado, proporcionando tempo aos traders posicionais que já possuem um modelo de avaliação fundamental ou técnico. Diferentemente de seu irmão mais novo, Reversal Fractals , esse indicador não perde reversões por causa do período selecionado e encontra fractais de reversão em zigue-zague, ignorando as reversões que não possuem impulso suficiente para iniciar um movime
PipFinite Exit EDGE
Karlo Wilson Vendiola
4.79 (116)
Did You Have A Profitable Trade But Suddenly Reversed? In a solid strategy, exiting a trade is equally important as entering. Exit EDGE helps maximize your current trade profit and avoid turning winning trades to losers. Never Miss An Exit Signal Again Monitor all pairs and timeframes in just 1 chart www.mql5.com/en/blogs/post/726558 How To Trade You can close your open trades as soon as you receive a signal Close your Buy orders if you receive an Exit Buy Signal. Close your Sell orders if
Quant Direction
Georgios Kalomoiropoulos
Quant Direction é uma ferramenta de análise de mercado tridimensional. Ela oferece uma análise de mercado totalmente objetiva, baseada em algoritmos, que calcula simultaneamente desvios percentuais precisos em diversos parâmetros. Desenvolvido com ferramentas avançadas de modelagem com inteligência artificial e rigorosamente testado, o algoritmo foi projetado para interpretar o mercado com precisão sem precedentes. Você pode analisar qualquer par de moedas ou instrumento financeiro em sua plataf
Neuro Poseidon MT4
Daria Rezueva
4.73 (45)
Neuro Poseidon is a new indicator by Daria Rezueva. It combines precise trading signals with adaptive TP/SL levels - creating best possible trades as a result! Message me and get  Neuro Poseidon Assistant  as a gift to automize your trading process! What makes it stand out? 1. Proven profitability on all assets and timeframes 2. Only confirmed BUY and SELL signals present on the chart 3. Adaptive TP & SL levels generated by the software for each trade 4. Easy to understand - suitable for all
CRT Multi-Timeframe Market Structure & Liquidity Sweep Indicator Non-Repainting | Multi-Asset | MT5 Version Available MT5 Version:   https://www.mql5.com/en/market/product/162075 Full User Guide — explains what each feature does and why:   https://www.mql5.com/en/blogs/post/767525 Quick Start User Guide  — explains how to configure and in what order:  https://www.mql5.com/en/blogs/post/767540 Indicator Overview CRT Ghost Candle HTF Fractal is a complete institutional-grade market structure too
Trend Lines PRO
Roman Podpora
5 (2)
LINHAS DE TENDÊNCIA PRO       Ajuda a entender onde o mercado está realmente mudando de direção. O indicador mostra inversões de tendência reais e pontos onde os principais participantes retornam ao mercado. Você vê     Linhas BOS     Análise de tendências e níveis-chave em prazos maiores — sem configurações complexas ou ruídos desnecessários. Os sinais não são repintados e permanecem no gráfico após o fechamento da barra. VERSÃO MT 5      -      Revela seu potencial máximo quando emparelhada co
DayTrader PRO MT4
Davit Beridze
4.6 (10)
DayTrader PRO MT5:  https://www.mql5.com/en/market/product/186222 O DayTrader PRO é um indicador de trading avançado que combina o Filtro de Laguerre de John Ehlers com um potente motor de otimização automática. Em vez de utilizar parâmetros fixos, o indicador procura automaticamente as melhores definições com base nas condições recentes do mercado, ajudando-o a adaptar-se à volatilidade variável sem necessidade de ajustes manuais constantes. O indicador gera sinais claros de COMPRA (BUY) e VEND
Enigma Wyckoff
Yonny Pascal Ekwa Mezui
Enigma Wyckoff Enigma Wyckoff is a technical analysis indicator based on the Wyckoff methodology, designed to assist traders in analysing market structure, price behaviour, and potential accumulation and distribution phases. The indicator analyses price movement and market conditions to help identify potential Wyckoff-based setups and possible changes in market direction. It provides visual signals and analytical information directly on the chart, helping traders interpret the relationship betwe
PZ Harmonacci Patterns
PZ TRADING SLU
3.17 (6)
Este é sem dúvida o indicador de reconhecimento automático de formação de preço harmônico mais completo que você pode encontrar para a MetaTrader Platform. Ele detecta 19 padrões diferentes, leva as projeções de Fibonacci tão a sério quanto você, exibe a Zona de Reversão Potencial (PRZ) e encontra níveis adequados de stop loss e take-profit. [ Guia de instalação | Guia de atualização | Solução de problemas | FAQ | Todos os produtos ] Detecta 19 formações harmônicas de preços diferentes Traça
Mais do autor
Manzano Footprint Order Flow
Patricia Manzano Gomez
5 (1)
MANZANO FOOTPRINT ORDER FLOW Footprint, Order Flow and Volume Analysis for MetaTrader 5 Manzano Footprint Order Flow is an analytical indicator for MetaTrader 5 that brings together Footprint charts, Bid x Ask, Delta, Cumulative Delta (CVD), Imbalances, Volume Profile, VWAP, Market Depth and Time & Sales in an interactive environment. It allows traders to examine activity within individual candles, identify volume concentrations, compare buying and selling pressure, and analyse how market partic
Harmonic Pattern Suite Pro Introduction Harmonic Pattern Suite Pro is an indicator designed to identify and display harmonic structures on the chart based on X-A-B-C-D sequences. Its purpose is to present pattern formations that meet geometric and proportional criteria, providing a clear visual representation directly on the chart. The indicator automates the detection process, removing the need for manual measurement of ratios and allowing the user to review the structural configuration withou
FREE
Manzano Risk Box
Patricia Manzano Gomez
Manzano Risk Reward Box You can download the Pro version, featuring a comprehensive control panel, order management, trailing stop, break-even functionality, and funded account protection features, here: https://www.mql5.com/es/market/product/202156 Manzano Risk Reward Box is a visual trade planning and risk management tool for MetaTrader 5, designed to help traders prepare their positions directly on the chart before execution. It allows users to create visual BUY and SELL scenarios, define the
FREE
Manzano SMC Institutional Pro Smart Money Concepts, ICT, historical statistics, market structure and liquidity analysis for MetaTrader 5. Any SMC indicator can draw zones. Manzano SMC Institutional Pro measures how those zones have behaved in your market and compares their results with randomly chosen levels. See the structure. Check the historical evidence. Understand the market context. Manzano SMC Institutional Pro brings Smart Money Concepts (SMC), ICT methodology, Market Structure, Order B
Smart Adaptive Trend Flow MT5 Professional adaptive trend, market structure, price levels and flow analysis indicator for MetaTrader 5. Would you like to test it before purchasing? You can request a fully functional trial version by sending us a private message through the MQL5 messaging system . This allows you to evaluate the indicator and all its features before making a purchase decision. A Complete Market View in a Single Chart Smart Adaptive Trend Flow MT5 has been developed to provide a
Plan, execute and protect every trade in MetaTrader 5: exact risk-based lot size, automatic management, baskets and Prop Firm rules in a single panel. Manzano Trade Manager Pro is a professional trade manager for MetaTrader 5, designed especially for traders who trade funded accounts (Prop Firms) and need advanced control over risk, execution and position management. It brings together in one tool visual trade planning, automatic lot size calculation, individual, collective and basket managemen
Manzano Index Intelligence Analysis of the underlying constituents of the Nasdaq 100, S&P 500 and Dow Jones 30 for MetaTrader 5 It is not just about knowing where an index is moving, but understanding what is driving that move. BEFORE BUYING OR TRYING: CHECK YOUR BROKER The indicator requires your broker to provide both the index CFD and CFDs for its constituent stocks within the same MT5 account. Having a Nasdaq 100, S&P 500 or Dow Jones 30 CFD does not necessarily mean the broker also offers i
Filtro:
Sem comentários
Responder ao comentário