Fibonacci Apex

Apex Fibonacci

Precision in Every Level

Automatic or manual Fibonacci ranges. Multi-timeframe price levels. Custom retracement zones and optional alerts for MetaTrader 5.

Apex Fibonacci is an interactive Fibonacci analysis indicator designed to make price retracements and extensions easier to examine on the chart. It combines a rolling automatic range, manual A/B anchors, selectable Fibonacci levels, multi-timeframe overlays, colored retracement bands, and price-interaction notifications within one floating workspace.

The indicator does not select trade entries for you. Instead, it provides configurable reference levels and a consistent visual framework for analyzing a price movement.

1. Choose Your Fibonacci Range

Apex Fibonacci offers two range selection methods. Switch between them from the Setup tab without opening a separate drawing tool.

Mode How the range is defined Typical use
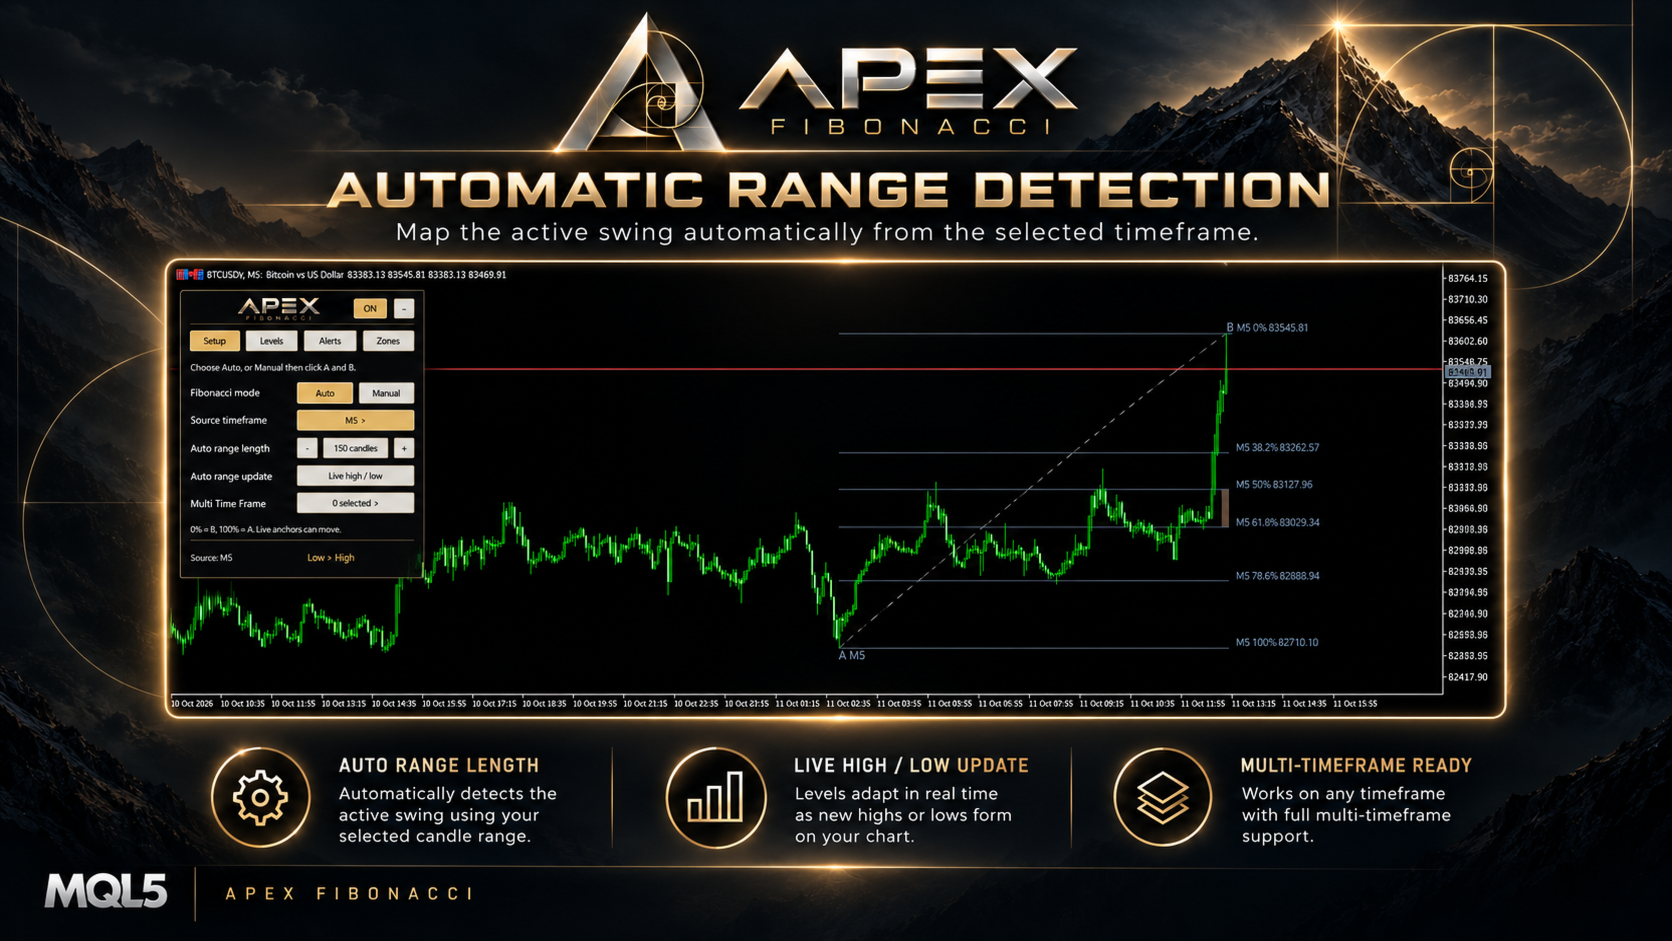
Auto Highest high and lowest low within a selected lookback window Following a developing price range
Manual Two chart points chosen by the trader: A and B Measuring a particular swing or price movement

In both modes, the Fibonacci scale is measured backward from the end of the selected movement: 0% is point B and 100% is point A. The price direction determines whether levels are measured down from a bullish high or up from a bearish low.

2. Auto Mode: A Rolling Price Range

In Auto mode, the indicator scans the selected source timeframe for its highest and lowest prices. Their chronological order defines the direction of the A-to-B movement: low-to-high for a bullish movement, or high-to-low for a bearish movement.

Adjustable lookback: Choose from 25 to 500 source candles. Use the controls in Setup to change the number of candles included in the calculation.

Live high / low: The initial mode includes the developing source candle. The range can update as a new high or low appears, so its anchor points and projected levels may move.

Closed candles: This alternative calculates the range from completed source candles only. It excludes the still-forming source candle from the range scan and updates as new candles close.

Source timeframe: Follow the current chart period, or select a fixed timeframe from the source-timeframe menu. The chosen source timeframe determines which candles are scanned; it is separate from the optional multi-timeframe overlays.

If enough history is not available, or the highest and lowest points do not define a valid movement, the indicator waits rather than displaying an unsupported range.

3. Manual Mode: Place A and B Directly on the Chart

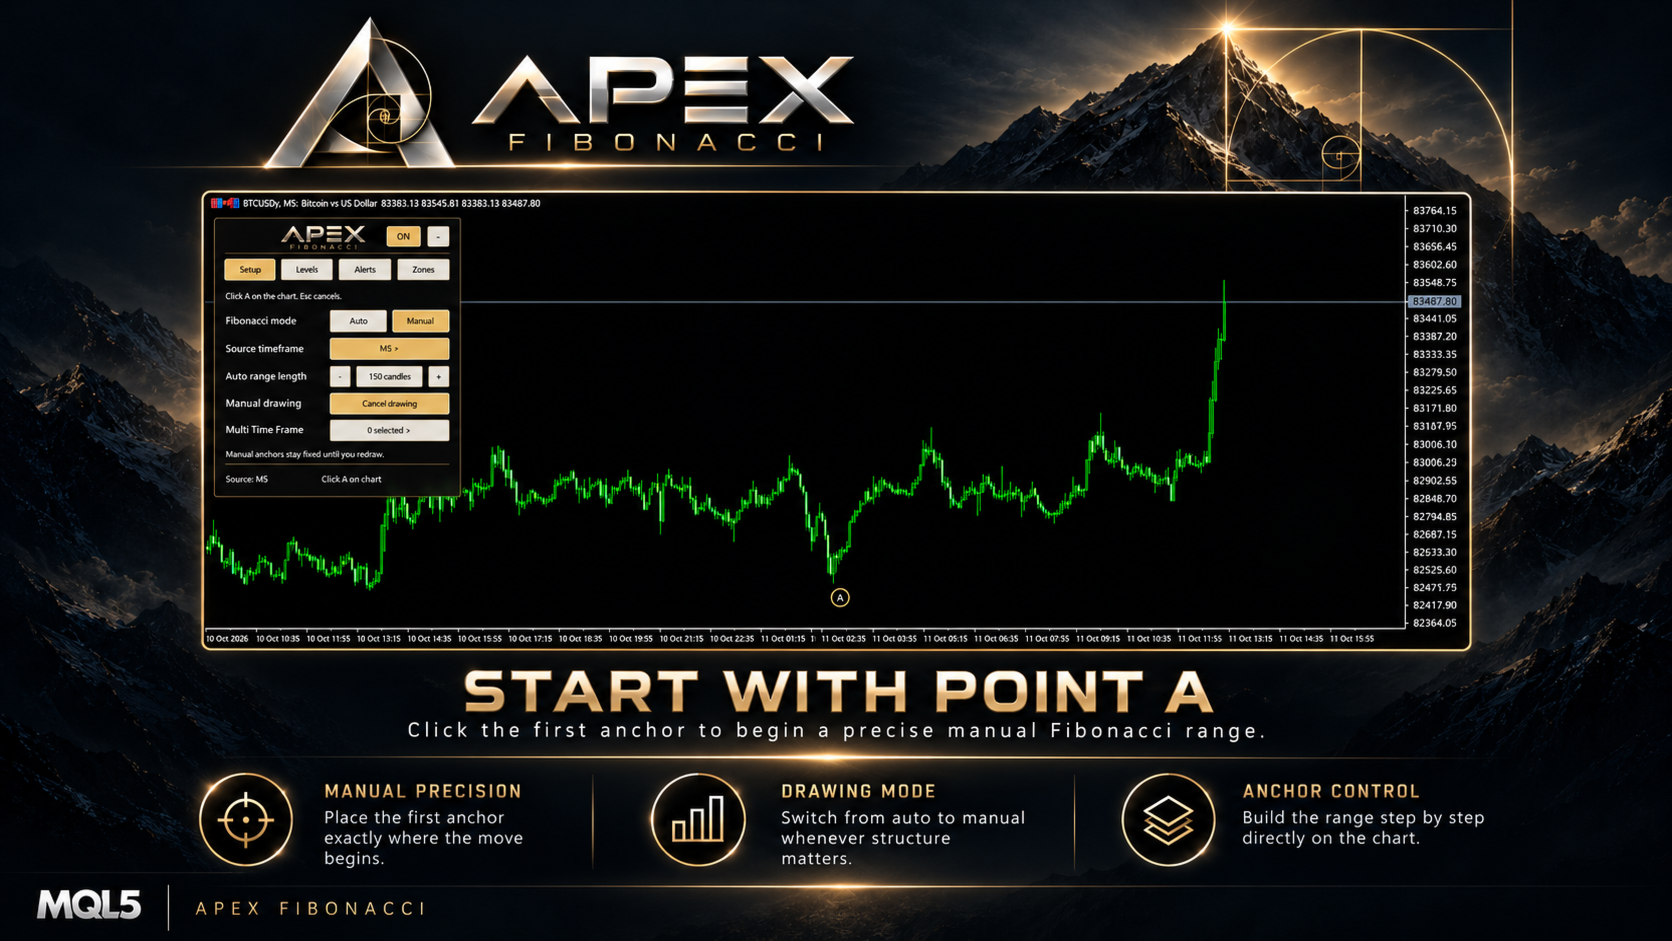
Manual mode is useful for examining a move that you want to define yourself, rather than using the rolling highest/lowest window.

  1. Open the Setup tab and choose Manual.
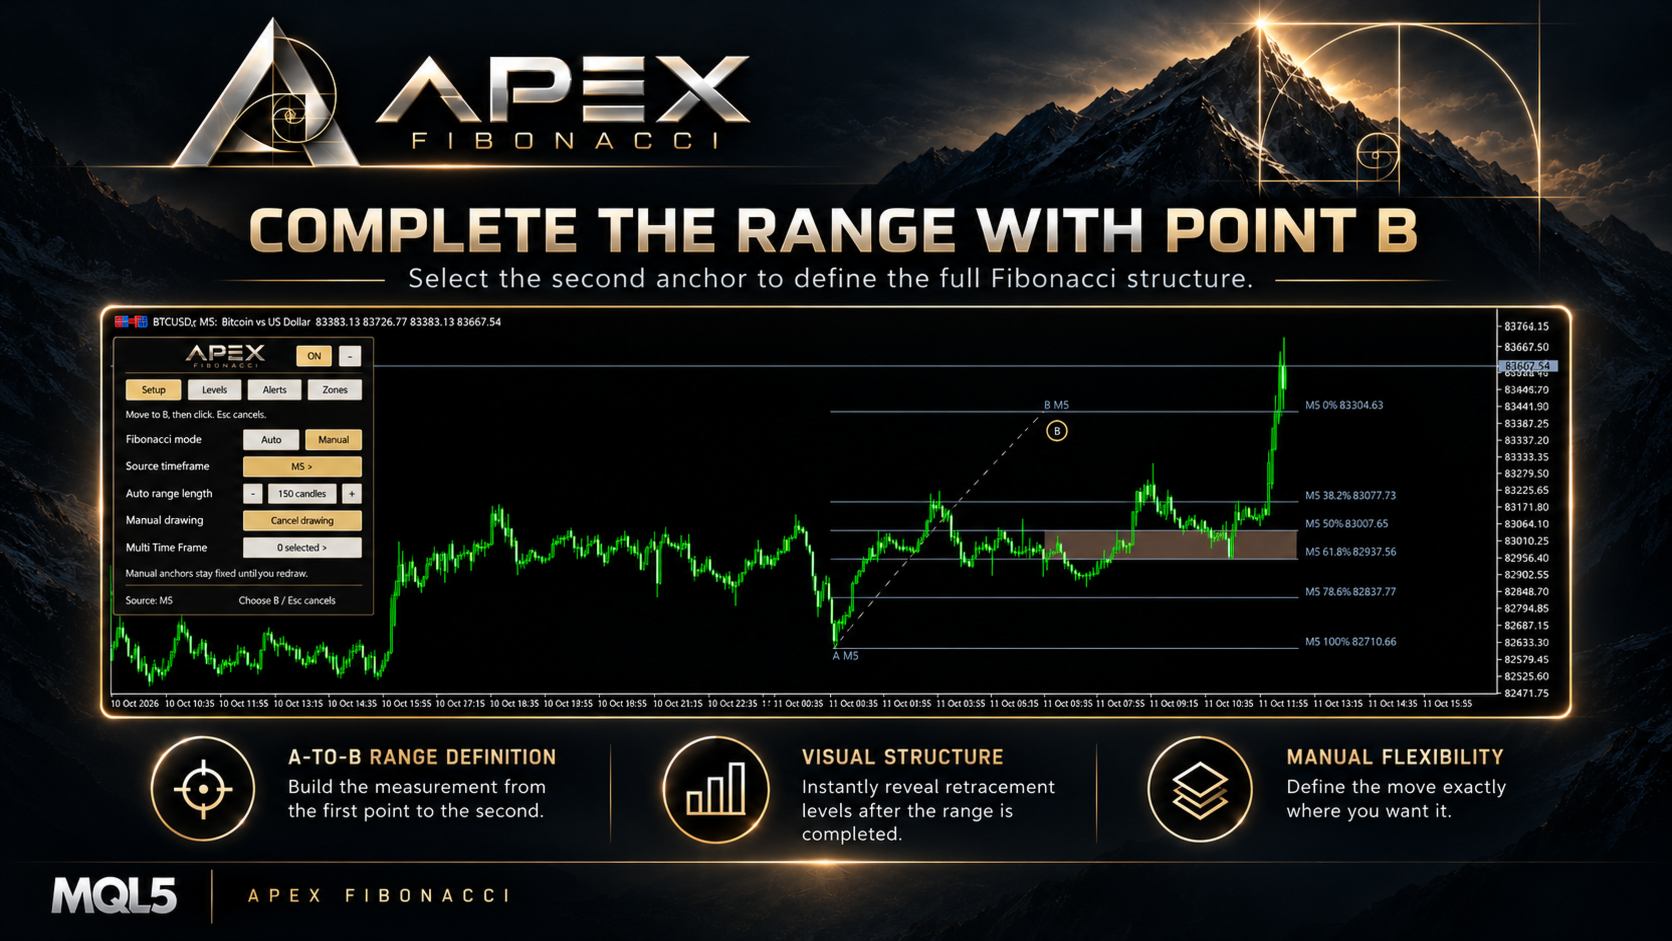
  2. Click on the chart to place A, the beginning of your chosen price movement.
  3. Move the pointer to preview the second anchor, then click to place B.
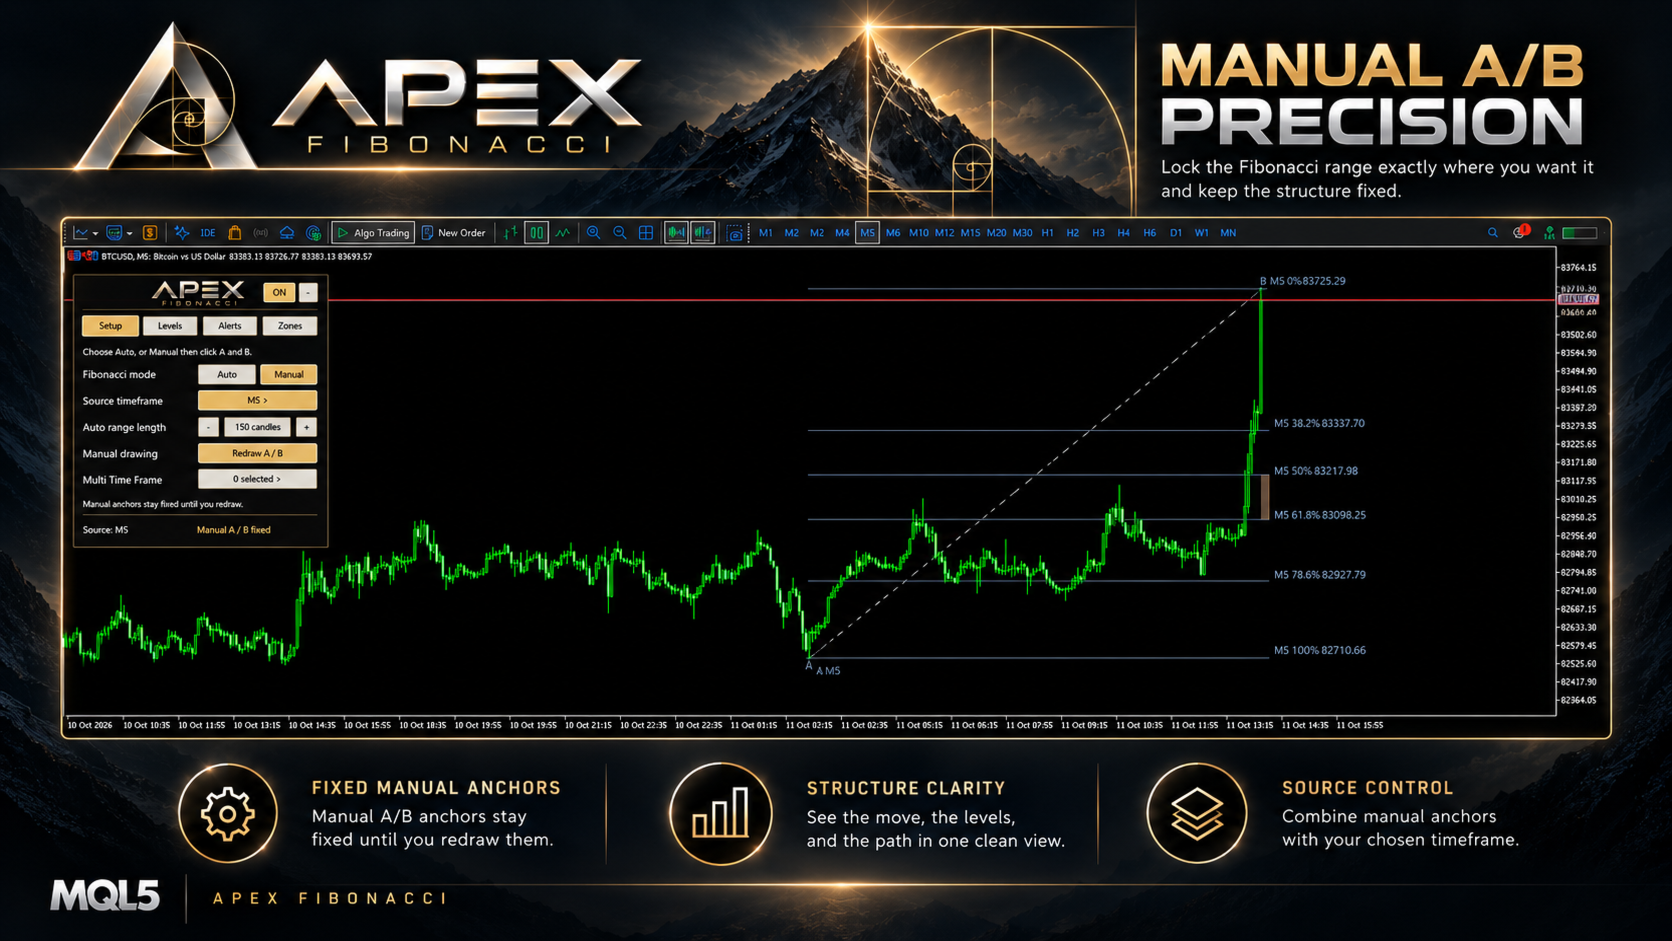
  4. Review the Fibonacci lines drawn from your selected prices. Use Redraw A / B when you want to define another movement.

Flexible drawing: The two points are read from chart time and price coordinates. A higher B price creates a bullish range; a lower B price creates a bearish range. The points do not have to be clicked from left to right, but they must have different prices.

Cancel safely: Press Esc during selection to cancel the unfinished drawing. A small chart-side A/B guide follows the selection process.

Fixed anchors: Once the manual drawing is complete, its A and B price coordinates remain fixed until you redraw or change the mode. The manual source timeframe is retained for that selection.

4. Multi-Timeframe Fibonacci on One Chart

Open Multi Time Frame in Setup to select additional Fibonacci overlays. The selector supports the 21 native MetaTrader 5 timeframes, from M1 through MN1, and includes Select All and Cancel All controls.

Independent timeframe selection: Add or remove timeframe overlays with one click. The visible selection remains associated with the selected timeframes even when you change the chart period.

One symbol, several perspectives: Each selected timeframe uses the current chart symbol and its own available candle history to calculate its automatic range. Selected levels appear on the same chart for comparison with the main Fibonacci range.

Clearer overlays: The main range uses its selected line color, while additional timeframe lines are drawn with a muted, dashed appearance. Labels identify their timeframes when there is enough chart space.

Only the timeframes you select are displayed. Additional overlays start disabled on a fresh installation, and duplicate automatic overlays are avoided when they match the main automatic source timeframe.

5. Retracement Levels and Extensions

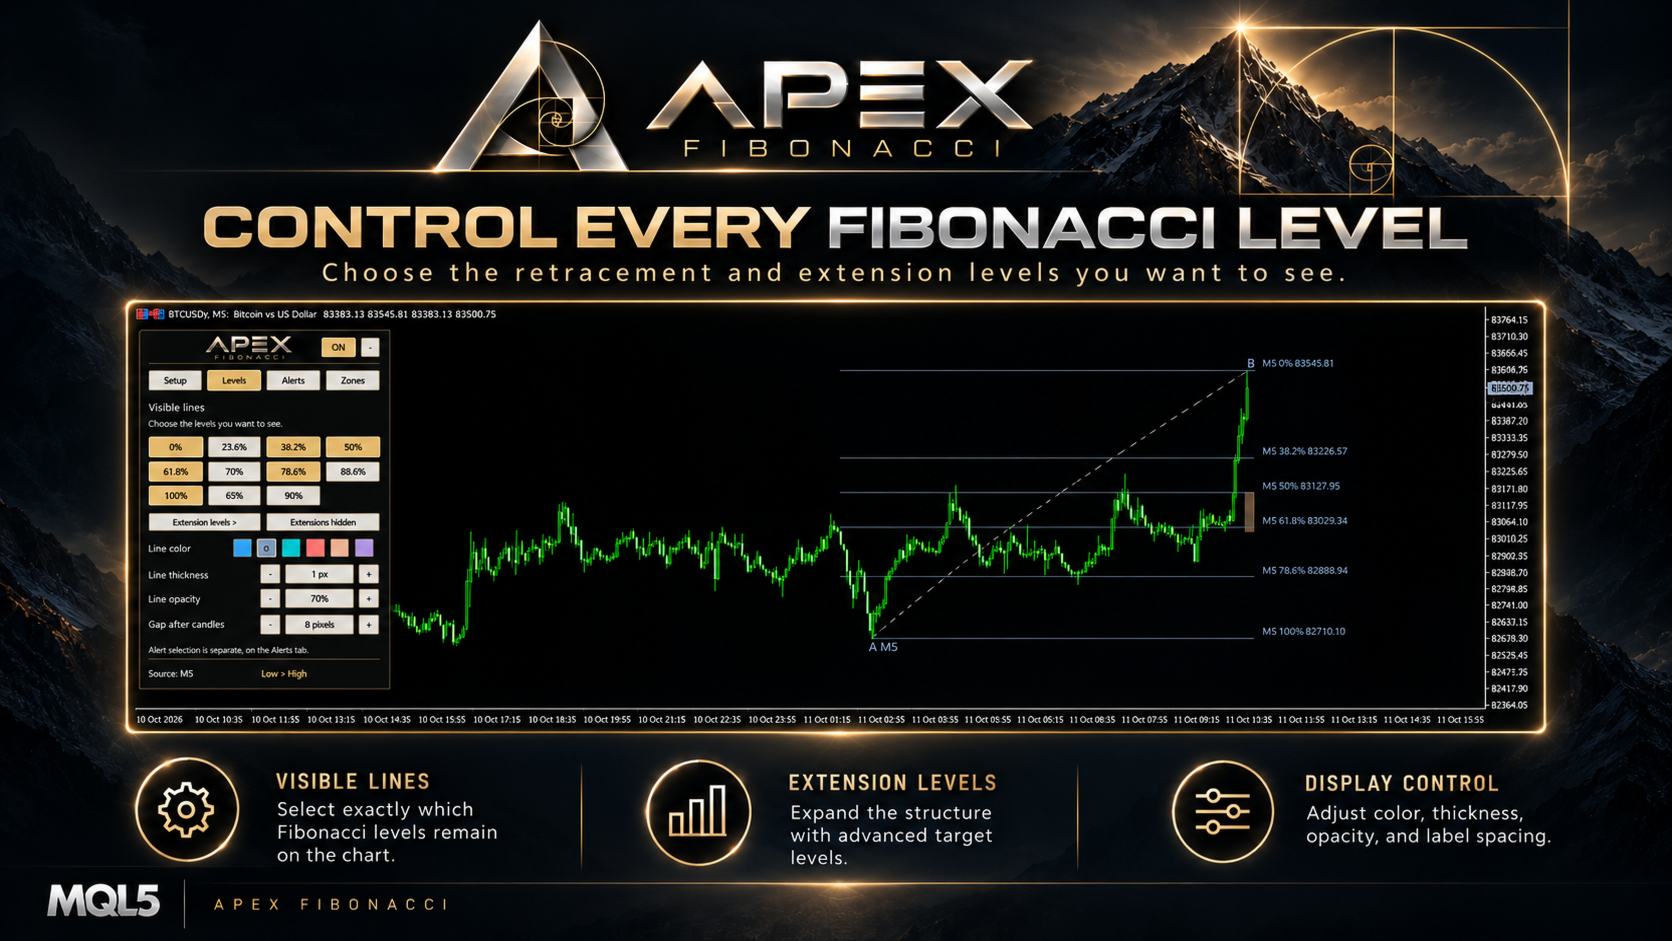
The Levels tab controls which Fibonacci lines appear on the chart. It provides 20 available level positions, with separate controls for the main retracement page and the extension page.

Retracement levels: 0%, 23.6%, 38.2%, 50%, 61.8%, 70%, 78.6%, 88.6%, and 100%, plus two customizable percentages.

Custom retracements: Configure two additional values between 0% and 100% through the indicator Inputs. Their initial values are 65% and 90%. Enable or disable them from the Levels tab.

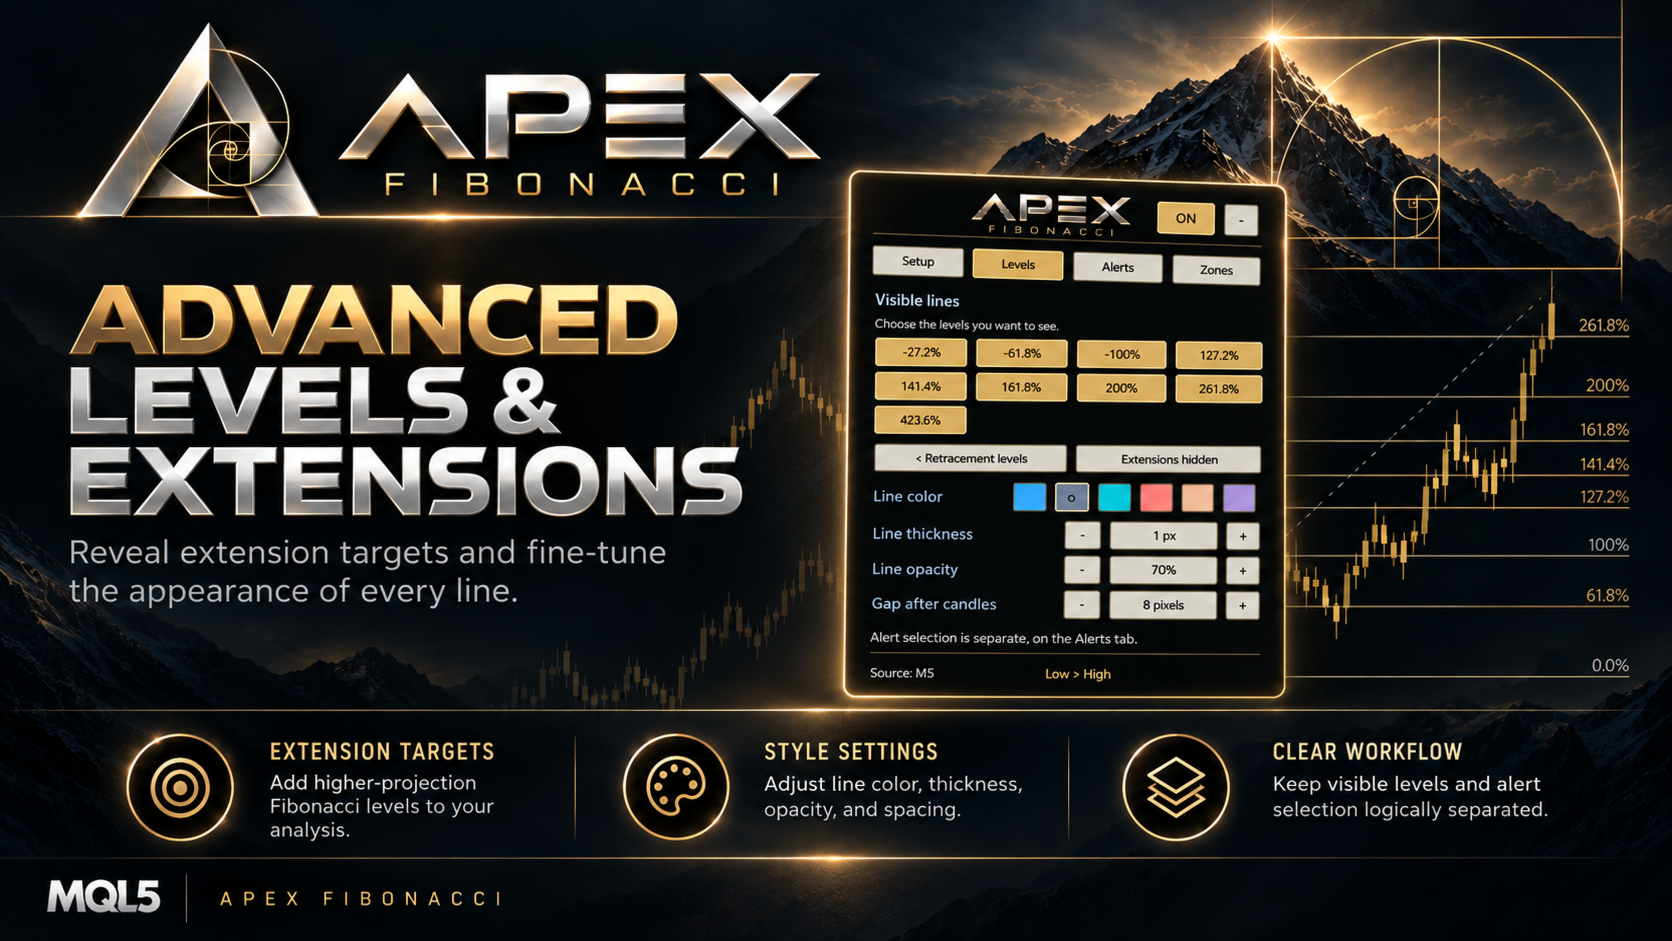
Optional extensions: Turn on extension drawing to use -27.2%, -61.8%, -100%, 127.2%, 141.4%, 161.8%, 200%, 261.8%, and 423.6%. Extension visibility is disabled initially.

No duplicate lines: If a custom percentage matches another enabled level, the same price level is not drawn twice.

Choose visible lines according to the structure you are analyzing. The lines displayed in Levels and the percentages selected for alerts are controlled independently.

6. Four Customizable Retracement Zones

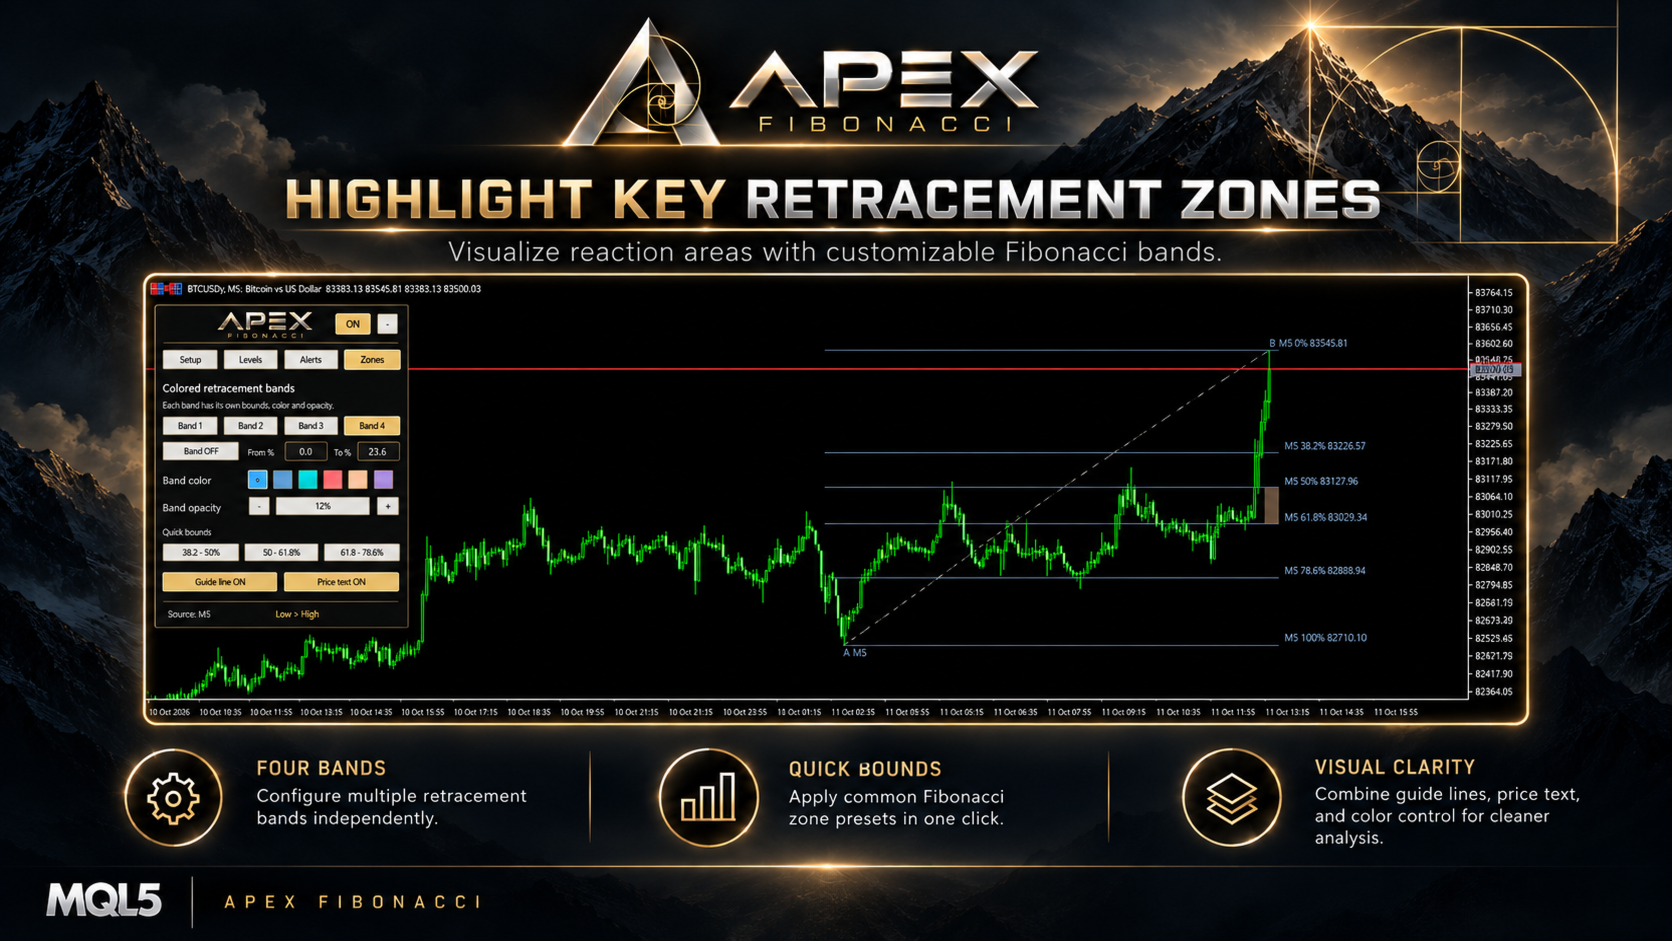
The Zones tab provides up to four independent colored retracement bands around the main Fibonacci range. They help distinguish selected intervals visually without changing the underlying level calculations.

Initial band: Band 1 starts enabled at 61.8% to 78.6%. Bands 2, 3, and 4 start disabled and can be turned on as required.

Editable boundaries: Set the From and To percentages for each band. Zone boundaries accept values from 0% to 100%, and the two limits must be different.

Quick presets: Apply 38.2%-50%, 50%-61.8%, or 61.8%-78.6% to the selected band with one button.

Independent appearance: Select each band's color, opacity, and visibility separately. The filled bands are drawn for the main Fibonacci range; they are not separate filled zones for every additional timeframe.

Use the same tab to show or hide the A-to-B guide line and the price values beside Fibonacci percentage labels.

7. Price Alerts with Separate Level Selection

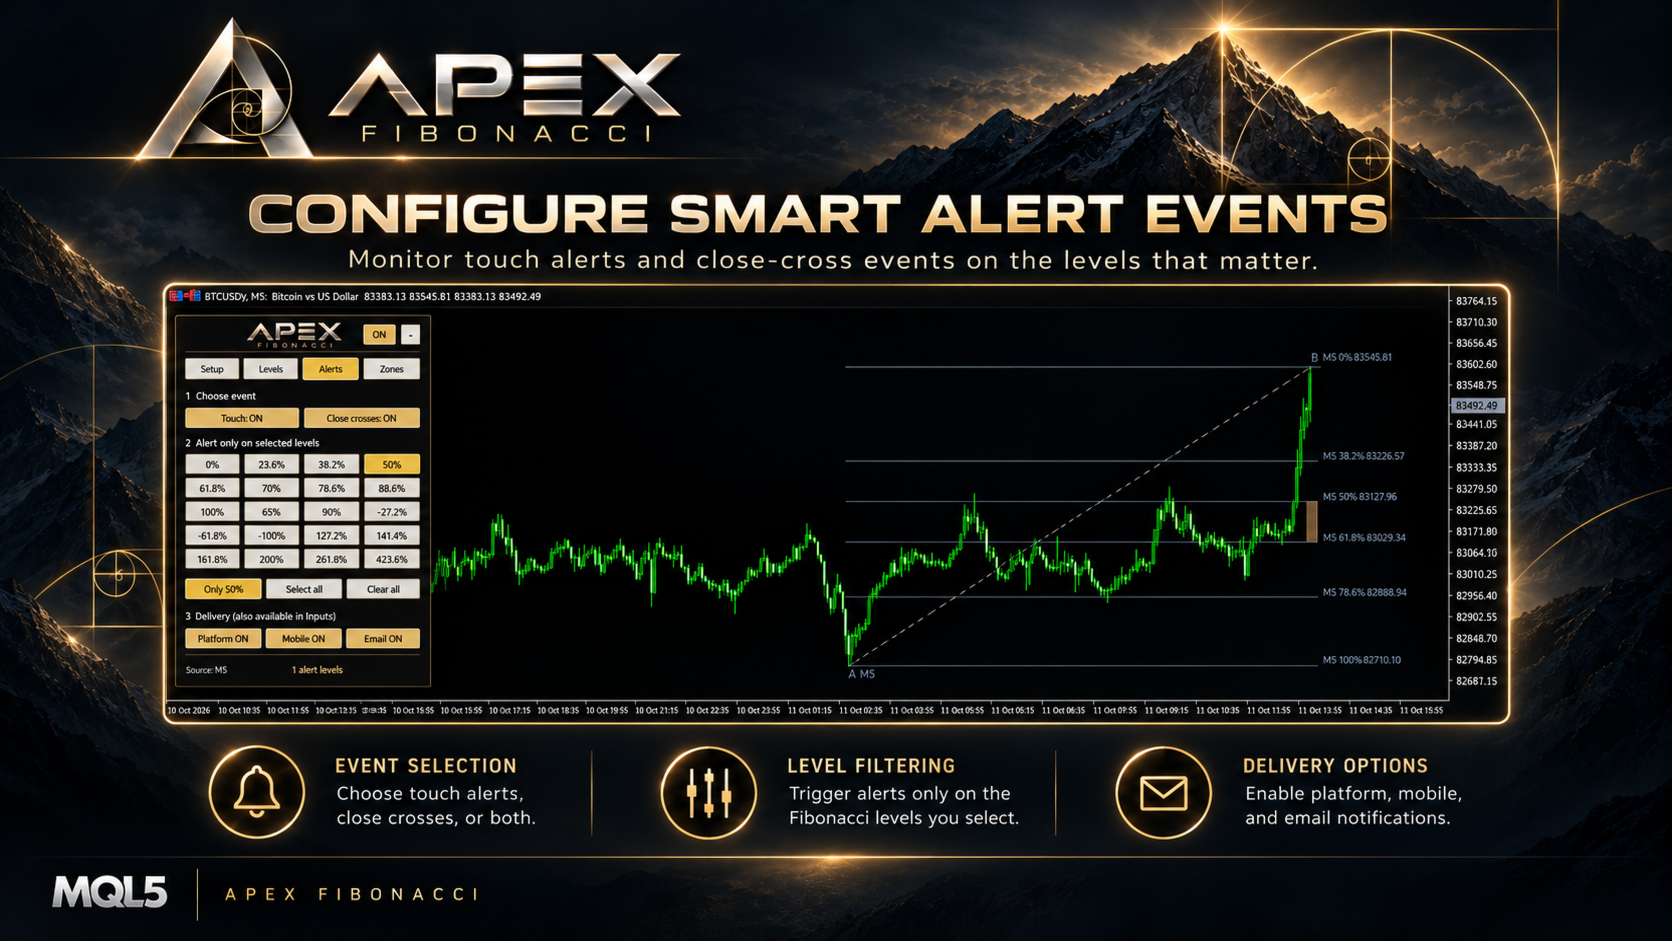
The Alerts tab lets you select which Fibonacci percentages should be monitored for price interaction, regardless of whether those particular lines are currently visible.

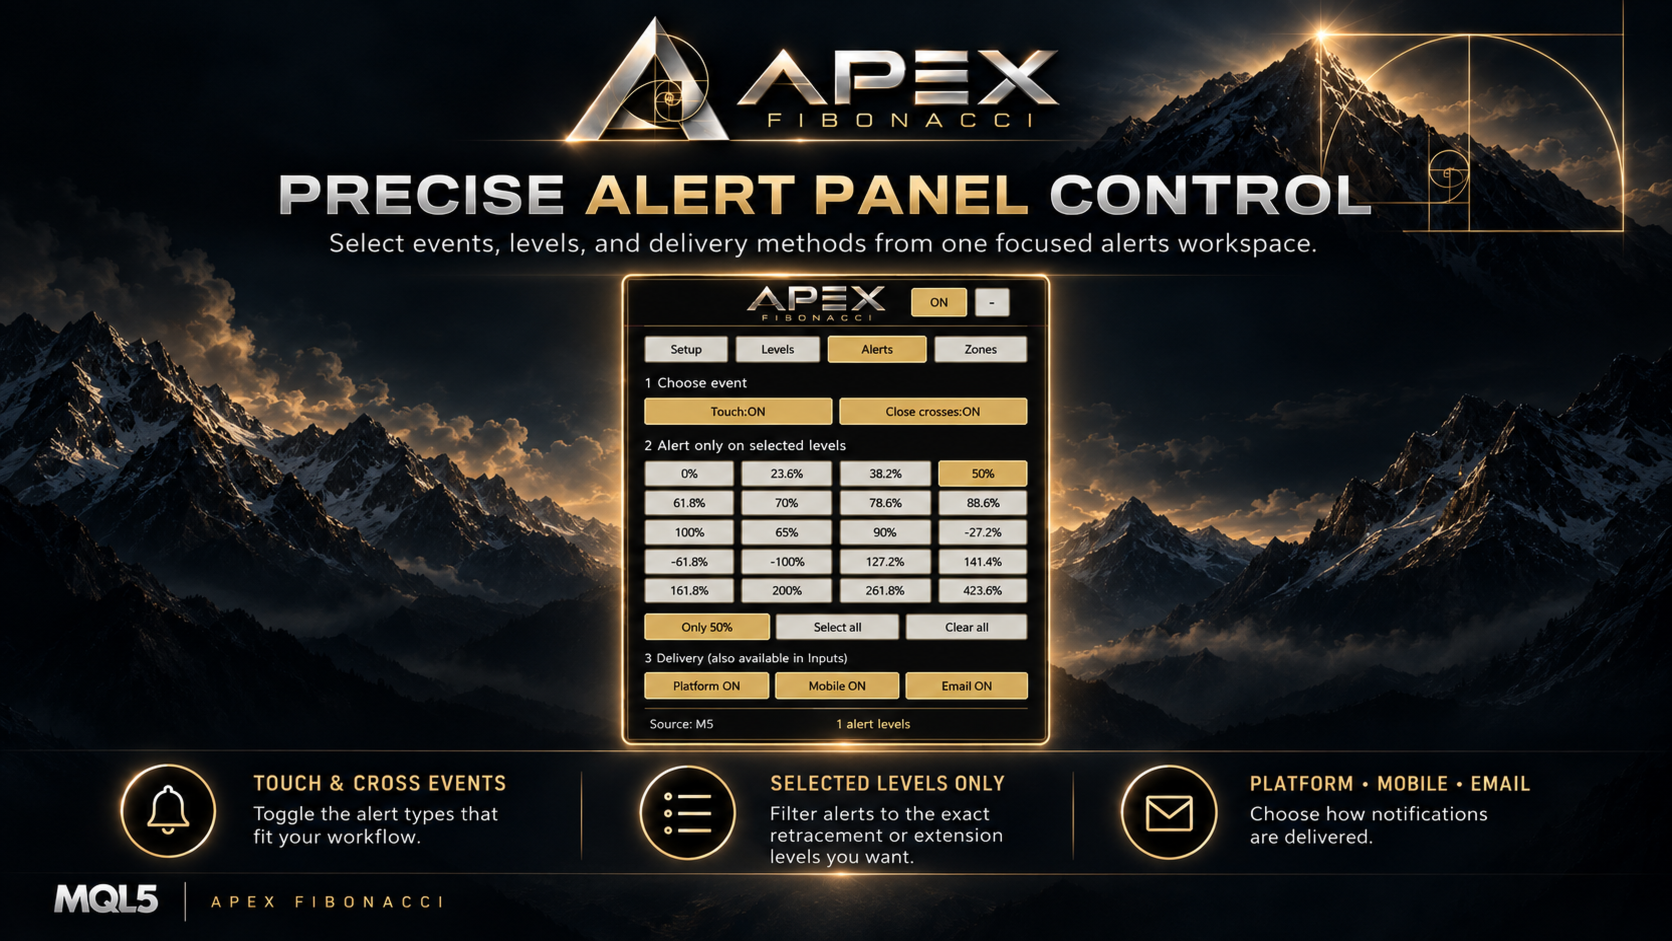
Touch alerts: Receive a notification when price first reaches a monitored level under the indicator's current range-state logic.

Closed-candle cross alerts: Monitor upward or downward crossings confirmed by the closing prices of consecutive source candles. A moving Fibonacci line by itself does not count as a completed candle cross.

Level selection: Select individual percentages or use Only 50%, Select all, and Clear all. Active source and selected multi-timeframe calculations can be monitored.

Delivery options: Choose platform popup alerts, mobile push notifications, and email from the panel. An optional sound file is available in the indicator Inputs. Mobile and email delivery require prior configuration in MetaTrader 5.

Initial state: Touch and cross alerts are disabled by default. The initial 50% alert-level selection does not send notifications unless an event type is enabled. Historical events are not replayed as new alerts when the indicator is attached.

8. A Floating Panel Organized into Four Tabs

Setup: Switch Auto/Manual mode, select the source timeframe, change the auto lookback, choose Live or Closed Candles, and open the multi-timeframe selector.

Levels: Control retracement and extension visibility, line color, thickness, opacity, and the gap after the most recent visible candle.

Alerts: Enable touch or closed-candle cross events, choose monitored levels, and select notification delivery methods.

Zones: Enable and edit four retracement bands, use quick range presets, and switch the guide line or price labels on and off.

The expanded panel can be repositioned by dragging its header. It can also be collapsed into a compact logo and reopened by clicking it. Panel sizing adapts to the chart area and the terminal display scale.

Chart labels are positioned near the most recent visible candles. When there is insufficient space, overlapping or out-of-view labels may be omitted rather than moved to an incorrect price position; the corresponding line tooltip retains the level and price information.

9. Personalize the Chart Display

Line styling: Set thickness from 1 to 5 pixels, line opacity from 0% to 100%, and choose a color from the available palette. Additional timeframe overlays use their own muted presentation.

Zone appearance: Change each band's opacity, color, and range independently. The main A/B guide and price display can be toggled.

10. Practical Ways to Use Apex Fibonacci

Follow a developing movement: Choose Auto mode and a source timeframe, set the lookback period, and compare how the range behaves in Live mode and Closed Candles mode.

Measure a specific swing: Select Manual mode, place A and B around the movement you want to study, and highlight the retracement interval that matters to your analysis.

Compare timeframes: Keep the main Fibonacci range visible, then add selected higher or lower timeframe overlays to observe where levels are near each other.

Monitor a reference level: Enable a selected alert percentage, choose touch or closed-candle cross events, and activate the preferred notification method.

11. Quick Start

  1. Attach Apex Fibonacci to a MetaTrader 5 chart.
  2. In Setup, choose Auto or Manual and select the timeframe or A/B anchors.
  3. Open Levels to select the percentages and optional extensions to display.
  4. Use Zones to highlight one or more retracement intervals.
  5. Open Multi Time Frame when you want to compare additional periods.
  6. Configure Alerts only if you want notifications for chosen price interactions.

12. Important Information

Apex Fibonacci is a visual price-analysis indicator. Its automatic anchors are based on a rolling window of broker price candles and can change when new price extremes occur. Closed Candles mode excludes the current forming source candle, while a finished manual A/B selection remains fixed until it is redrawn.

Fibonacci lines are analytical reference levels, not confirmed support or resistance and not trade signals. The indicator does not open, manage, or close trades. Price alerts report interactions with the configured levels and should not be interpreted as buy or sell instructions.

Calculations and visibility depend on the available broker price history, selected timeframes, chart space, and terminal notification configuration.

Produtos recomendados
Free automatic Fibonacci is an indicator that automatically plots a Fibonacci retracement based on the number of bars you select on the BarsToScan setting in the indicator. The Fibonacci is automatically updated in real time as new highest and lowest values appears amongst the selected bars. You can select which level values to be displayed in the indicator settings. You can also select the color of the levels thus enabling the trader to be able to attach the indicator several times with differe
FREE
Desenvolvimento da versão anterior do indicador ZigZag WaveSize MT4 ZigZag WaveSize - indicador padrão ZigZag modificado com informações adicionais sobre o comprimento da onda em pontos, níveis e diferentes lógicas de alerta Melhorias gerais: Adaptação do código para MetaTrader 5 Otimizada a operação com objetos gráficos Novidades: Níveis horizontais nos extremos Seleção do tipo de níveis: horizontal/raios/segmentos Filtro de níveis líquidos (não quebrados pelo preço) Buffer para rupturas: aju
FREE
TrendVision AI
Murtadha Majid Jeyad Al-Khuzaie
TrendVision AI – Smart Trend Channels & Price Forecasting for MetaTrader 5 Discover market structure and explore potential future price direction with TrendVision AI, an advanced technical indicator for MetaTrader 5 that combines automatic trendline analysis with a machine-learning-based price forecasting model. How Does TrendVision AI Work? TrendVision AI analyzes historical candlestick data within a configurable lookback window. It automatically draws two trendlines directly on the chart:
FREE
PZ Penta O MT5
PZ TRADING SLU
3.8 (5)
The Penta-O is a 6-point retracement harmonacci pattern which usually precedes big market movements. Penta-O patterns can expand and repaint quite a bit. To make things easier this indicator implements a twist: it waits for a donchian breakout in the right direction before signaling the trade. The end result is an otherwise repainting indicator with a very reliable trading signal. The donchian breakout period is entered as an input. [ Installation Guide | Update Guide | Troubleshooting | FAQ | A
FREE
Donchian Breakout And Rsi
Mattia Impicciatore
4.5 (2)
Descrição geral Este indicador é uma versão aprimorada do Canal Donchian clássico, enriquecida com funções práticas para o trading real. Além das três linhas padrão (máxima, mínima e linha do meio), o sistema detecta breakouts e os mostra visualmente com setas no gráfico, exibindo apenas a linha oposta à direção da tendência atual para uma leitura mais limpa. O indicador inclui: Sinais visuais : setas coloridas nos breakouts Notificações automáticas : alerta pop-up, push e e-mail Filtro RSI : pa
FREE
The indicator highlights the points that a professional trader sees in ordinary indicators. VisualVol visually displays different volatility indicators on a single scale and a common align. Highlights the excess of volume indicators in color. At the same time, Tick and Real Volume, Actual range, ATR, candle size and return (open-close difference) can be displayed. Thanks to VisualVol, you will see the market periods and the right time for different trading operations. This version is intended f
FREE
MACD Enhanced
Nikita Berdnikov
4 (4)
Introducing the MACD  Enhanced – an advanced MACD (Moving Average Convergence Divergence) indicator that provides traders with extended capabilities for trend and momentum analysis in financial markets. The indicator uses the difference between the fast and slow exponential moving averages to determine momentum, direction, and strength of the trend, creating clear visual signals for potential entry and exit points. Attention! To achieve the best results, it is recommended to adapt the indicator
FREE
Auto Fibonacci displays the 38.2, 61.8, and 78.6 Fib levels directly on the chart, helping traders who use these key retracement zones consistently for trade planning or confluence. Drawing Fibonacci levels manually over and over again can take time, especially when done with wick-to-wick precision. Auto Fibonacci removes that friction by detecting the latest trend leg and placing the main Fibonacci levels automatically. Key Benefits Shows only the major Fibonacci levels to keep the chart clean
FREE
O indicador de intervalo de tempo Wormhole para o MetaTrader 5 (MT5) não é apenas mais uma ferramenta de negociação — é a sua vantagem competitiva nos mercados financeiros. Projetado tanto para traders iniciantes quanto profissionais, o Wormhole transforma a maneira como você analisa dados e toma decisões, garantindo que você esteja sempre à frente. Por que você precisa do indicador Wormhole (gratuito) Supere a concorrência: A capacidade de visualizar dois intervalos de tempo no mesmo gráfico si
FREE
Automatic fibonacci with alerts is an indicator that automatically plots a fibonacci retracement based on the number of bars you select on the BarsToScan setting in the indicator. The fibonacci is automatically updated in real time as new highest and lowest values appear amongst the selected bars. You can select which level values to be displayed in the indicator settings. You can also select the color of the levels thus enabling the trader to be able to attach the indicator several times with d
FREE
Indicator Description 4 Hull MA Color + Envelopes is a powerful trend-following indicator for MetaTrader 5 that combines four Hull Moving Averages (HMA) with Moving Average Envelopes to clearly identify market direction, trend strength, and potential reversal or pullback zones. This indicator is designed to reduce noise, react quickly to price movement, and provide a clean visual structure for professional trading.   Key Features   4 Hull Moving Averages (20, 50, 100, 200) Automatic color change
FREE
Are you tired of drawing trendlines every time you're analyzing charts? Or perhaps you would like more consistency in your technical analysis. Then this is for you. This indicator will draw trend lines automatically when dropped on a chart. How it works Works similar to standard deviation channel found on mt4 and mt5. It has 2 parameters: 1. Starting Bar 2. Number of bars for calculation The   starting bar   is the bar which drawing of the trend lines will begin, while the   number of bars for c
FREE
TV MACD Pro + SNR Support/Resistance is a professional trading tool that combines TradingView-style MACD with adaptive Support & Resistance detection. This indicator includes two core modules that can be turned on or off independently. MACD Module: Features authentic TradingView MACD color scheme, teal/red histogram with volume and shrinkage differentiation. Adjustable parameters include Fast EMA (default 12), Slow EMA (default 26), Signal SMA (default 9), and histogram scale. SNR Module: Au

FREE
Intraday Spark Chart Overview Intraday Spark Chart is an MT5 indicator for intraday analysis. It converts the current price change of a symbol into a percentage of the daily opening price and plots the result in a separate subwindow. Every trading day starts again from the zero line, so each day is drawn as a separate segment and the intraday move of the current day can be observed directly. The indicator is a data visualization tool. It does not generate trading signals and does not provide inv
FREE
Donchian Pro
Paulo Henrique Faquineli Garcia
5 (3)
O Canal Donchian Os canais são uma das ferramentas de análise técnica mais populares porque transmitem intuitivamente aos analistas as restrições que tendem a ocorrer na maioria das mudanças de preço. Os usuários do canal sabem que informações valiosas podem ser obtidas a qualquer momento, independentemente de o preço estar no centro de uma faixa ou próximo a uma das fronteiras. Uma das técnicas mais famosas para explorar esses conceitos são as bandas de Bollinger. No entanto, John Bollinger não
FREE
Haven Key Levels PDH PDL
Maksim Tarutin
4.92 (12)
O indicador   "Haven Key Levels PDH PDL"   ajuda os traders a visualizar os níveis-chave no gráfico. Ele marca automaticamente os seguintes níveis: DO (Daily Open)   — o nível de abertura diária. NYM (New York Midnight)   — o nível da meia-noite de Nova Iorque. PDH (Previous Day High)   — o máximo do dia anterior. PDL (Previous Day Low)   — o mínimo do dia anterior. WO (Weekly Open)   — o nível de abertura semanal. MO (Monthly Open)   — o nível de abertura mensal. PWH (Previous Week High)   — o
FREE
PROMETHEUS TECHNICAN VERSION Free | By THE SONS A gift from The Sons — no strings, no trial, no expiry. Every trader deserves access to professional-grade market intelligence. That belief is why Prometheus Technical Version exists, and why it costs nothing. Consider it our handshake to the trading community. What You're Getting This is not a simplified tool dressed up as a gift. Prometheus Technican Version is a fully built, institutional-quality technical analysis indicator running a dual-model
FREE
1. Overview The ATR Dynamic Stop (CE) is a powerful technical indicator designed to help traders identify and follow market trends. Its core function is to provide a dynamic trailing stop-loss based on price volatility, as measured by the Average True Range (ATR) indicator. The main objectives of the ATR Dynamic Stop are: Profit Optimization: It helps you ride a strong trend by setting a reasonable stop-loss, preventing premature exits due to minor market noise and fluctuations. Risk Management:
FREE
This indicator automatically identifies liquidity levels using swing fractals and tracks when price sweeps through them. Works on any symbol and timeframe with full multi-timeframe support. Features: — Detects swing highs and lows via a fractal method (configurable bars left & right) on a selected timeframe. Active levels are displayed as rays extending to the right; swept levels turn into dashed lines ending at the sweep candle. — Plots Previous Day (PDhigh / PDlow), Previous Week (PWhigh / PWl
FREE
RSI abcd
Francisco Gomes Da Silva
4.33 (3)
RSI ABCD Pattern Finder: Estratégia Técnica 1. Como o Indicador Funciona Combina o RSI clássico com detecção automática de padrões harmônicos ABCD . Componentes Principais RSI Padrão (período ajustável) Marcações de Topos e Fundos (setas) Padrões ABCD (linhas verdes/vermelhas) Filtros de Overbought (70) e Oversold (30) 2. Configuração no MT5 period = 14 ; // Período do RSI size = 4 ; // Tamanho máximo do padrão OverBought = 70 ; // Nível de sobrecompra OverSold = 30 ; // Nível de sobrevenda Filt
FREE
Pivot Points Indicator – a fast, reliable, and fully customizable pivot detection for MetaTrader 5. This indicator uses MetaTrader’s native iHighest and iLowest functions to identify pivot highs and lows by scanning for the highest and lowest prices within a user-defined window of bars. A pivot is confirmed only when the current bar is the absolute maximum or minimum within the selected range, ensuring accurate and timely signals based on robust built-in logic. Key Features No Repainting : Onc
FREE
O indicador mostra os   níveis redondos   no gráfico. Eles também são chamados de níveis   psicológicos , bancários ou de jogador principal. Nestes níveis, há uma verdadeira luta entre touros e ursos, o acúmulo de muitas ordens, o que leva ao aumento da volatilidade. O indicador se ajusta   automaticamente   a qualquer instrumento e período de tempo. Quando o   nível 80   é rompido e testado,   nós compramos . Quando o   nível 20   é rompido e testado,   nós vendemos . A meta é 00. Atenção. Dev
FREE
Follow The Line MT5
Oliver Gideon Amofa Appiah
4.6 (35)
This indicator obeys the popular maxim that: "THE TREND IS YOUR FRIEND" It paints a GREEN line for BUY and also paints a RED line for SELL. (you can change the colors). It gives alarms and alerts of all kinds. IT DOES NOT REPAINT and can be used for all currency pairs and timeframes. Yes, as easy and simple as that. Even a newbie can use it to make great and reliable trades. NB: For best results, get my other premium indicators for more powerful and reliable signals. Get them here: https://www.m
FREE
Este é um indicador de agressão comprador e vendedor que analisa o formato de cada vela e projeta esses dados em forma de histograma. Há 4 histogramas em um só. Na parte frontal temos dois: Superior - força compradora Inferior - força vendedor Na parte de trás temos também dois histogramas, ambos da mesma cor. Eles medem a força conjunta dos compradores e vendedores. Esses histogramas podem ser desativados nos Parâmetros de Entrada. É possível também ter o volume real ou de tick para fazer essa
FREE
MT4 Version Most indicators draw lines. This one draws the battlefield. If you ever bought an EA or indicator based on a perfect equity curve — and then watched it bleed out live — you’re not alone. The problem? Static logic in a dynamic market. Fibonacci Bollinger Bands   adapts. It combines Bollinger structure with customizable Fibonacci levels to mark   zones of control   — where price reacts, pauses, or reverses. No magic. Just logic that follows volatility. Why this tool matters   It
FREE
How it works –   Base-departure detection — algorithmically finds consolidation bases (overlapping range with compressed volatility) followed by displacement departures. Patterns: Drop-Base-Rally, Rally-Base-Drop, Rally-Base-Rally, Drop-Base-Drop — detected structurally, not by candle names. –   Strength score (0–100) — from departure velocity, time-at-base, freshness (each revisit decays the score), higher-timeframe confluence and origin volume. –   Lifecycle — Fresh, Tested (decaying), Broken
FREE
FibRetrace Zones Zonas de retração de Fibonacci do último swing FibRetrace Zones é o companheiro visual gratuito do Expert Advisor FibRetrace. Ele desenha os níveis de retração de Fibonacci e destaca a zona de pullback no último swing, para que você veja onde as entradas de retração se alinham — antes de operar. A zona é codificada por cores conforme a direção: verde para setups de alta, vermelho para setups de baixa. Funciona em qualquer símbolo e qualquer timeframe, e as barras confirmadas nun
FREE
MSX Hybrid Heiken Scalper
Som Prakash Gehlot
5 (1)
MSX Hybrid Heiken Scalper Overview MSX Hybrid Heiken Scalper is a MetaTrader 5 indicator based on a modified Heiken Ashi methodology with closed-bar smoothing. The indicator is designed to display trend direction through color-coded candles while reducing sensitivity to short-term market fluctuations. All calculations are performed using completed candles, allowing historical values to remain fixed after bar close. Features • Modified Heiken Ashi calculation • Closed-bar processing • Color-code
FREE
LT Donchian Channel
Thiago Duarte
4.86 (7)
Donchian Channel (ou canal de Donchian) é um indicador criado por  Richard Donchian. Ele é  formado tomando a máxima mais alta e a mais baixa mais baixa do último período especificado em velas. A área entre alta e baixa é o canal para o período escolhido. Sua configuração é simples. É possível ter a média entre a linha superior e inferior além de alertas quando o preço atinge um dos lados. Se tiver alguma dúvida ou encontrar alguma falha, me contate. Faça bom uso!
FREE
Fibonacci Trend Indicator
Vinoth Durairaj Durairaj
Fibonacci Trend Indicator for MT5 Unlock the power of Fibonacci analysis on your MetaTrader 5 charts! Our   Fibonacci Trend Indicator   automatically plots dynamic support and resistance levels so you can spot trends, reversals, and breakout opportunities at a glance. Features & Advantages Automatic Fibonacci Levels Instantly displays seven key Fibonacci retracement levels based on the highest and lowest prices from your chosen lookback period — no manual work required. Dynamic Trend Adaptatio
FREE
Os compradores deste produto também adquirem
Trend Sniper X
Sarvarbek Abduvoxobov
4.9 (41)
Trend Sniper X é um indicador de acompanhamento de tendência para múltiplos tempos gráficos no MetaTrader 5 que ajuda os traders a identificar a direção da tendência e potenciais pontos de reversão com clareza e precisão. para MT4: https://www.mql5.com/en/market/product/193245 Informações sobre o preço: O preço atual é promocional e está sujeito a alterações à medida que novas atualizações e funcionalidades forem lançadas. Oferta Bônus: Para obter o Auto-Trade Assistant EA GRATUITO para este in
Smart Trend Trading System — MetaTrader 5 Após a compra, envie-me uma mensagem no MQL5 para receber Smart Universal Expert Advisor GRÁTIS, além do curso online, do manual em PDF e do acesso ao grupo privado. O STTS reúne a direção da tendência, sinais de entrada e saída, zonas de reversão e níveis de preço importantes diretamente no seu gráfico. Siga o sistema manualmente ou conecte um EA compatível separado para executar operações automaticamente com as configurações que você escolher. UM SISTE
SuperScalp Pro
Van Minh Nguyen
4.56 (36)
SuperScalp Pro - Professional Multi-Layer Confluence Scalping System SuperScalp Pro é um indicador avançado de scalping que aprimora o Supertrend clássico com vários filtros inteligentes de confirmação. Ele ajuda a identificar oportunidades de Buy/Sell com maior probabilidade, reduzindo significativamente os sinais falsos. Setas claras de Buy e Sell aparecem diretamente no gráfico, enquanto os níveis de Stop Loss e Take Profit baseados em ATR são calculados automaticamente em tempo real. Após a
Zoryk Gold
Reda El Koutbane
5 (15)
O desconto termina em 24 horas — próximo preço $ 69 ZORYK — Sistema avançado de sinais para XAUUSD no MetaTrader 5 Você conhece essa sensação. Você passa muito tempo analisando o ouro. Espera pela entrada certa. Finalmente abre a operação e o preço começa imediatamente a se mover contra você. Você fecha cedo demais, move o Stop Loss ou hesita por alguns segundos. Depois disso, o mercado alcança exatamente o destino que você esperava originalmente, mas sem você dentro da operação. O problema ne
Um novo Rei chegou à cidade - Indicador + Gestão de Ordens (TP1 + TP2 + TP3) + Enviador opcional de sinais para Telegram INCLUÍDO (GRÁTIS) (SISTEMA COMPLETO DE TRADING e SINAIS) Nosso melhor EA para Ouro: Gold Slayer Este indicador inclui uma estratégia avançada, um sistema de trading com gestão de ordens personalizável e um sistema de reversão à média que combina extensões de envelopes, apoiado por múltiplos filtros inteligentes de confirmação, como o RSI, para capturar entradas de reversão de
SMC Intraday Formula
VividMind Digital Solutions
5 (26)
Vamos ser honestos primeiro. Nenhum indicador sozinho vai te tornar lucrativo. Se alguém te disser o contrário, está te vendendo um sonho. Qualquer indicador que mostre setas perfeitas de compra/venda pode ser feito para parecer impecável — basta dar zoom na parte certa da história e tirar um print das operações vencedoras. Nós não fazemos isso.  SMC Intraday Formula é uma ferramenta. Ela lê a estrutura do mercado para você, identifica as zonas de maior probabilidade de preço e mostra exatament
A lenda está de volta: Entry Points Pro 10. O relançamento do lendário indicador que se manteve por 3 anos no Top-3 do MQL5 Market. Centenas de avaliações entusiasmadas (589 nas duas versões), milhares de traders operam com ele todos os dias, 31.000+ downloads da versão demo   MT4+MT5 . Li cada avaliação de vocês ao longo de cinco anos — e, em vez de promessas, coloquei as respostas dentro da versão 10. Do autor que está no mercado desde 1999 e valoriza a honestidade, a própria reputação e os se
GoldenX Entry MT5
VividMind Digital Solutions
5 (16)
GoldenX Entry é um indicador para MT5 com um algoritmo adaptativo Smart Entry Trend, um sistema de pontuação de sinais, um detector de regime de mercado e um filtro de volatilidade. Cada sinal inclui um nível de entrada calculado, três níveis de Take-Profit (TP1, TP2, TP3) e um nível de Stop-Loss. Ele é construído sobre múltiplas camadas analíticas projetadas para se adaptar a diferentes condições de mercado, combinando um sistema analítico multicamadas com um otimizador integrado e um sistema d
Gann Made Easy   é um sistema de negociação Forex profissional e fácil de usar, baseado nos melhores princípios de negociação usando a teoria do sr. W. D. Gann. O indicador fornece sinais precisos de COMPRA e VENDA, incluindo níveis de Stop Loss e Take Profit. Você pode negociar mesmo em movimento usando notificações PUSH. Entre em contato comigo após a compra para receber instruções de negociação e ótimos indicadores extras gratuitamente! Provavelmente você já ouviu muitas vezes sobre os método
Neuro Poseidon MT5
Daria Rezueva
4.75 (52)
Neuro Poseidon is a new indicator by Daria Rezueva. It combines precise trading signals with adaptive TP/SL levels - creating best possible trades as a result! Message me and get  Neuro Poseidon Assistant  as a gift to automize your trading process! What makes it stand out? 1. Proven profitability on all assets and timeframes 2. Only confirmed BUY and SELL signals present on the chart 3. Adaptive TP & SL levels generated by the software for each trade 4. Easy to understand - suitable for al
ARIPoint
Temirlan Kdyrkhan
1 (4)
ARIPoint is a powerful trading companion designed to generate high-probability entry signals with dynamic TP/SL/DP levels based on volatility. Built-in performance tracking shows win/loss stats, PP1/PP2 hits, and success rates all updated live. Key Features: Buy/Sell signals with adaptive volatility bands Real-time TP/SL/DP levels based on ATR Built-in MA Filter with optional ATR/StdDev volatility Performance stats panel (Success, Profit/Loss, PP1/PP2) Alerts via popup, sound, push, or email Cu
Tenha sua vantagem no trading à vista! M5 Sniper é um novo indicador da MeanFX. Ele combina sinais de trading precisos com níveis adaptativos de TP/SL — criando, como resultado, as melhores operações estatísticas possíveis! O preço aumenta a cada 5 compras, o próximo preço é de 69$ Envie-me uma mensagem após a compra para receber dicas/guia e um EA bônus O que o faz se destacar? Desempenho estatístico comprovado no Gold XAUUSD ( funciona em praticamente todos os ativos , com foco em dominar um ú
Auto Optimized SpeedAngle é um sistema de vetorização de momentum de nível institucional que elimina o sobreajuste ( curve-fitting ) por meio da otimização contínua de avanço ( Walk-Forward Optimization , WFO). Em vez de depender de entradas estáticas que se degradam quando os regimes de mercado mudam, o indicador recalibra dinamicamente seus parâmetros utilizando validação fora de amostra ( Out-of-Sample , OOS), garantindo que os sinais exibidos representem vantagens estatísticas genuínas e não
Gold Entry Sniper
Tahir Mehmood
5 (21)
Gold Entry Sniper – Painel ATR Multi-Tempo Profissional para Scalping e Swing Trading em Ouro Gold Entry Sniper é um indicador avançado para MetaTrader 5 projetado para fornecer sinais de compra/venda precisos para XAUUSD e outros ativos, com base na lógica de Trailing Stop ATR e análise multi-tempo . Ideal tanto para scalpers quanto para swing traders. Principais Recursos e Vantagens Análise Multi-Tempo – Veja a tendência de M1, M5 e M15 em um único painel. Trailing Stop Baseado em ATR – Níveis
Welcome to ENTRY IN THE ZONE AND SMC MULTI TIMEFRAME  SPECIAL BENEFIT / FOR OUR MQL5 CUSTOMERS FREE ACCESS TO THE NEW TOOL  — COMING SOON — Learn more on our official website  : https://www.fableedge.net Entry In The Zone and SMC Multi Timeframe is a real-time market analysis tool based on Smart Money Concepts (SMC) , designed to analyze market structure, price direction, and key trading zones. It supports both Single-Timeframe and Multi-Timeframe Analysis , providing a clearer view of overall m
M1 Sniper MT5
Oleg Rodin
5 (7)
O   M1 SNIPER   é um sistema indicador de negociação fácil de usar. É um indicador de seta projetado para o período M1. O indicador pode ser usado como um sistema independente para scalping no período M1 e pode ser usado como parte do seu sistema de negociação existente. Embora este sistema de negociação tenha sido projetado especificamente para negociação no M1, ele também pode ser usado em outros períodos. Originalmente, desenvolvi este método para negociar XAUUSD e BTCUSD. Mas considero-o úti
Unix Scalper
Issam Kassas
4 (4)
Unix Scalper — MetaTrader 5 Após a compra, envie-me uma mensagem no MQL5 para receber Smart Universal Expert Advisor GRÁTIS, além do curso online, do manual em PDF e do acesso ao grupo privado. Identifique a oportunidade. Veja o plano. Escolha como operar. O UNIX Scalper reúne análise de mercado, decisões BUY/SELL/WAIT e níveis de Entry, Stop Loss, TP1 e TP2 em um painel organizado. VEJA O SINAL E O PLANO • Decisões claras: BUY, SELL ou WAIT. • Níveis definidos: Entry, Stop Loss, TP1 e TP2. •
Divergence Bomber
Ihor Otkydach
4.89 (94)
Cada comprador deste indicador recebe adicionalmente, e de forma gratuita: A ferramenta exclusiva "Bomber Utility", que acompanha automaticamente cada operação, define os níveis de Stop Loss e Take Profit e fecha operações de acordo com as regras da estratégia; Arquivos de configuração (set files) para ajustar o indicador em diferentes ativos; Set files para configurar o Bomber Utility nos modos: "Risco Mínimo", "Risco Balanceado" e "Estratégia de Espera"; Um vídeo tutorial passo a passo que a
Scalper Vault   é um sistema profissional de escalpelamento que fornece tudo o que você precisa para um escalpelamento bem-sucedido. Este indicador é um sistema de negociação completo que pode ser usado por comerciantes de forex e opções binárias. O período de tempo recomendado é M5. O sistema fornece sinais de seta precisos na direção da tendência. Ele também fornece sinais superiores e inferiores e níveis de mercado Gann. Os indicadores fornecem todos os tipos de alertas, incluindo notificaçõe
RelicusRoad Pro MT5
Relicus LLC
4.96 (25)
Pare de chutar suas operações. Saiba quando entrar, onde sair e para que lado o mercado está pendendo, tudo em um único gráfico. O RelicusRoad Pro reúne quase vinte ferramentas em um só indicador, e você liga apenas as que combinam com o seu jeito de operar. Entradas claras. Saídas claras. Um plano em cada gráfico. Parece familiar? Você compra, e o preço vira contra você um minuto depois. Você fecha cedo demais e depois vê o movimento continuar sem você. Cinco indicadores no gráfico, cinco respo
Tokyo mt5 Indicator
Vasiliy Strukov
5 (7)
O Tokyo Indicator oferece uma visão geral visual clara da direção da tendência, de possíveis sinais de negociação e das condições de mercado. Sua linha de tendência em degraus e codificada por cores distingue as fases de alta (azul) das fases de baixa (magenta). Setas direcionais correspondentes destacam possíveis oportunidades de compra e venda quando a tendência exibida muda. Um painel integrado reúne o sinal atual, o viés de mercado, o momentum, a volatilidade e a qualidade do sinal em uma v
FX Trend MT5 NG
Daniel Stein
5 (6)
FX Trend NG: A Nova Geração de Inteligência de Tendência Multi-Mercado Visão Geral FX Trend NG é uma ferramenta profissional de análise de tendências e monitoramento de mercado em múltiplos períodos de tempo. Permite compreender a estrutura completa do mercado em segundos. Em vez de alternar entre vários gráficos, você visualiza instantaneamente quais ativos estão em tendência, onde o momentum está enfraquecendo e onde existe alinhamento forte entre diferentes timeframes. Oferta de Lançamento
FiboSniper Pro
Van Minh Nguyen
5 (3)
FiboSniper Pro – Multi-Filter Fibonacci System with Auto SL/TP and Control Panel FiboSniper Pro é um indicador técnico que combina Fibonacci Envelopes dinâmicos com vários filtros de confirmação para gerar sinais seletivos de Buy e Sell. Os níveis de Fibonacci são calculados com base em Moving Average e ATR e, em seguida, filtrados por ADX, EMA, RSI, ATR, Volume, Time e estrutura das velas. O indicador exibe diretamente no gráfico os níveis automáticos de Stop Loss e Take Profit baseados em ATR,
Olá, traders! A maioria dos traders de retalho depende de scripts web lentos. Para operar com verdadeira rentabilidade, é necessário um framework institucionalizado. O indicador Astro AI não é uma sobreposição gráfica padrão. Trata-se de uma rede neural compilada contendo dois agentes que são executados diretamente no seu terminal. Eis a tecnologia específica por trás do sistema: 1. Agente 1: Analista (Rede Neural Gráfica - GNN) Os mercados não são barras de preço isoladas; são redes de dad
Market Structure Order Block Dashboard MT5 é um indicador MT5 projetado para traders que querem ler a estrutura de mercado e as principais zonas de reação do preço diretamente no gráfico. Combina BOS, ChoCH, Order Blocks, Fair Value Gaps (FVG), Liquidez, Kill Zones, Volume Profile e um painel compacto para análise rápida. Este indicador é voltado para traders que usam estrutura de mercado, conceitos ICT e Smart Money como quadro de decisão. Pode ajudar a identificar continuações de tendência, po
Adaptive Price Action Engine Compre um indicador, ganhe o EA de graça Análise Auto-Otimizada de Tendências e Padrões de Candlestick em Múltiplos Timeframes Os mercados estão em constante mudança, e nem todos os padrões de Price Action têm o mesmo valor em todas as condições de mercado. O Adaptive Price Action Engine foi desenvolvido para se adaptar às mudanças nas condições do mercado, combinando estrutura de tendência, análise Multi-Timeframe, padrões de candlestick e otimização estatística em
Apresentando       Quantum Breakout PRO   , o inovador Indicador MQL5 que está transformando a maneira como você negocia Breakout Zones! Desenvolvido por uma equipe de traders experientes com experiência comercial de mais de 13 anos,       Quantum Breakout PRO       foi projetado para impulsionar sua jornada comercial a novos patamares com sua estratégia de zona de fuga inovadora e dinâmica. O Quantum Breakout Indicator lhe dará setas de sinal em zonas de breakout com 5 zonas-alvo de lucro e su
Trend Catcher ind mt5
Ramil Minniakhmetov
5 (18)
INDICADOR TREND CATCHER O Indicador Trend Catcher analisa os movimentos de preços do mercado, utilizando uma combinação de indicadores de análise de tendências adaptativos, proprietários e personalizados pelo autor. Identifica a verdadeira direção do mercado, filtrando o ruído de curto prazo e focando a força do momentum subjacente, a expansão da volatilidade e o comportamento da estrutura de preços. Utiliza também uma combinação de indicadores personalizados de suavização e filtragem de tendê
Quant Direction MT5
Georgios Kalomoiropoulos
Quant Direction é uma ferramenta de análise de mercado tridimensional. Ela oferece uma análise de mercado totalmente objetiva, baseada em algoritmos, que calcula simultaneamente desvios percentuais precisos em diversos parâmetros. Desenvolvido com ferramentas avançadas de modelagem com inteligência artificial e rigorosamente testado, o algoritmo foi projetado para interpretar o mercado com precisão sem precedentes. Você pode analisar qualquer par de moedas ou instrumento financeiro em sua plataf
Quantum TrendPulse
Bogdan Ion Puscasu
5 (26)
Apresentando   Quantum TrendPulse   , a ferramenta de negociação definitiva que combina o poder do   SuperTrend   ,   RSI   e   Stochastic   em um indicador abrangente para maximizar seu potencial de negociação. Projetado para traders que buscam precisão e eficiência, este indicador ajuda você a identificar tendências de mercado, mudanças de momentum e pontos de entrada e saída ideais com confiança. Principais características: Integração SuperTrend:   siga facilmente a tendência predominante do
Mais do autor
Smc Pro ToolKit
Talal N Z Aljarusha
5 (13)
SMC PRO TOOLKIT — SMART MONEY ANALYSIS & STRUCTURED TRADE PLANNING SMC Pro ToolKit is a professional Smart Money Concepts analysis workspace for MetaTrader 5. It combines market structure, multi-timeframe analysis, institutional price zones, setup evaluation, confirmation tools, volume context, alerts, and risk planning inside one organized chart environment. One workspace. Multiple layers of confirmation. One structured trading plan. OPEN COMPLETE USER GUIDE MULTI-CONDITION SETUP ENGINE At


Fibo Nova
Talal N Z Aljarusha
‖ Fibo Nova ‖ Fibonacci Strategy Indicator Turn Fibonacci into a Complete Trading Plan Fibo Nova transforms structured Fibonacci opportunities into a clear visual setup — from Entry Zone and Stop Loss to TP1, TP2 and TP3. ENTRY Automatically highlighted Fibonacci Entry Zone RISK Clear Stop Loss reference and invalidation TARGETS TP1 • TP2 • TP3 mapped directly on the chart Stronger Zones. More Than Fibonacci. Fibo Nova combines Fibonacci precision, market structure and setup quality insid

Smc Pro Chart
Talal N Z Aljarusha
4.5 (2)
SMC Pro Chart   is a professional Smart Money Concepts chart-analysis indicator for MetaTrader 5, designed to transform a standard chart into a clear and structured market map. It automatically highlights key elements such as   market structure, BOS and CHoCH, Order Blocks, Fair Value Gaps, i Fair Value Gaps ,  liquidity areas, and Premium / Discount zones , helping traders understand price action and important market locations directly from the chart. The interface is built to stay clean and p
FREE
Smc Pro Chart MT4
Talal N Z Aljarusha
SMC Pro Chart   is a professional Smart Money Concepts chart-analysis indicator for MetaTrader 4, designed to transform a standard chart into a clear and structured market map. It automatically highlights key elements such as   market structure, BOS and CHoCH, Order Blocks, Fair Value Gaps, liquidity areas, and Premium / Discount zones , helping traders understand price action and important market locations directly from the chart. The interface is built to stay clean and practical, with quick
FREE
Volume Profile Horizon Where Volume Concentrates. Manual ranges. Daily volume profiles. Multiple market periods on one MetaTrader 5 chart. Volume Profile Horizon is an interactive fixed-range volume analysis indicator for MetaTrader 5. It converts available broker tick-volume data into a horizontal distribution across price levels, helping traders examine where estimated market activity was concentrated within a chosen period. Instead of applying a single profile to an entire chart, you decide p
FREE
Filtro:
Sem comentários
Responder ao comentário